
Reflection Spectra Coupling Analysis and Polarized Modeling of Optically Active Particles in Lakes
by
 ,
,
Banglong Pan
1,*,
Hongwei Cheng
1,
Shuhua Du
2,
Hanming Yu
1,
Yi Tang
1,
Ying Shu
1,
Juan Du
1 and
Huaming Xie
1 1
School of Environmental and Energy Engineering, Anhui Jianzhu University, Hefei 230000, China
2
Institute of Geological Experiments of Anhui Province, Hefei 230000, China
*
Author to whom correspondence should be addressed.
Water 2023, 15(9), 1706; https://doi.org/10.3390/w15091706
Submission received: 22 February 2023
/
Revised: 15 April 2023
/
Accepted: 21 April 2023
/
Published: 27 April 2023
(This article belongs to the Special Issue Remote Sensing-Based Study on Surface Water Environment)
Abstract
:The coupling between optically active substances of algae particles and inorganic suspended solids of water makes the characteristics of reflection spectra of water complex and changeable. This makes modeling and inversion of polarization remote sensing in class II water difficult. In our study, considering the influence of the mixing ratio of algae particles and inorganic suspended solids, the sensor incidence angle, and the solar zenith angle on the polarization reflection spectrum, we analyzed the coupling characteristics of the polarized bidirectional reflectance of particulate matter through control experiments of mixed components of water particles in the laboratory. With Chaohu Lake in China as an example, the polarized reflectance coupling characteristics of water particles was investigated by the water-leaving radiation. The results showed that in the characteristic bands of 570, 675, and 705 nm, the degree of linear polarization (DOLP) was sensitive to the water-leaving radiation of the particles rather than to the reflectance. With the variation of observation angle, the reflection spectra were strongly interfered with by solar flare when the sensor zenith angle was close to 50° on the meridian plane with an azimuth angle of 180°, but DOLP was less affected, while also having a low correlation in the high concentration region. Combined with the coupling characteristics of particles at 675 and 705 nm, the model of DOLP ratio was established by partial least squares regression (PLSR) with a determination coefficient (R2) of 0.91, root mean square error (RMSE) 0.035, and a verification accuracy of 0.959. This shows that the model has better prediction ability for the coupling characteristics of water particles by the polarization reflection spectra and provides good support for mixed spectral unmixing of class II water.
1. Introduction
Freshwater resources play an important role in human production and life. However, the acceleration of global lake eutrophication is increasingly reducing the ecological effects of lakes [1]. The development of effective water quality monitoring technology is the basis for predicting and controlling the occurrence and development of lake eutrophication. At present, there is no effective standard inversion algorithm for class II water such as lakes and coasts [2]. The reason lies in the complexity of the components of such water bodies [3,4]. The spectral characteristics of water-leaving radiation in lakes are usually the result of the coupling interaction of a variety of optically active substances [5]. Among them, indicators of water quality closely related to the spectrum include planktonic algae, suspended particles, yellow matter, etc. [6]. Through absorption and scattering at different wavelengths, these substances produce a superposition effect in the characteristic spectral region. This will cause significant differences in the water-leaving radiation in a certain wavelength range, making it difficult to separate mixtures using one-dimensional scalar spectral information. This has a great impact on the stability and inversion accuracy of the lake water remote sensing inversion model [7,8].
As further independent dimensional information, the polarization characteristics of the electric field vector are significantly different from those of the scalar intensity [9]. Polarization describes the vibrational direction of an electric field vector during the process of radiative transfer [10]. The state of this attribute will change due to the interaction with the medium when light propagates through the water. The time of depolarization in the transfer process is much longer than that of diffusion, which can well maintain the polarization state characteristics, so it is more effective in analyzing the coupling characteristics of different particles in the water and distinguishing different components of the water [11,12]. In recent years, researchers have used polarized spectroscopy to detect water, which shows the potential of polarization information. Parallel polarized light was proposed to calculate the concentration of inorganic suspended solids in turbid water [13,14], and multiangle polarized scattering light was used to analyze the characteristics of suspended solids in offshore seawater [15]. These efforts demonstrated the value of polarization information in the application of remote sensing of inorganic suspended solids in water. Simultaneously, polarized light and a Mueller matrix was used to measure the shape and particle distribution of algae and it was found that the change in algae morphology had an important impact on Mueller matrix M11D [16]. Polarized scattered light was used to analyze the change in the physiological state of marine microalgae [17]. Furthermore, polarized light scattering data were used to analyze microalgae and early warning of cyanobacterial blooms based on machine learning methods [18]. These studies show the unique role of polarization information in the detection of algae particles.
Previous studies have shown that there are intensity differences between inorganic suspended solids and algae particles in water [19,20]. Generally, the light intensity of inorganic suspended solids is high and their polarization characteristics are also different in terms of angular distribution [21]. Inorganic suspended solids have obvious high scattering characteristics in the near-infrared band, while algae particles have fluorescent inelastic scattering in the red part but have no obvious polarization characteristics [22,23]. Therefore, the difference in the polarized intensity spectrum of the material components in lake water and the coexistence of polarization and non-polarization in the spectrum make it possible to distinguish the components of water [24]. For example, the full Stokes vector was believed to describe the polarization spectrum as an effective method of determining organic and inorganic substances [25,26]. Polarized light was used to separate the chlorophyll-a fluorescence from scattered light from algae water [27]. At the same time, the particle characteristics of particulate matter include the particle shape and the real and imaginary parts of the refractive index and scale [28]. These characteristics of the particles make the upwards polarized radiance contain the internal information of the water particles [29]. The sensitivity of linearly polarized light to particle size and shape could also be used as an important basis for the analysis of particle characteristics [30,31]. These studies provide a useful exploration for polarized light in the field of water color remote sensing, but reports are rare on the polarized coupling modeling of water particles.
In this study, our aims were (i) to investigate the reflected signal coupling characteristics of algae particles and inorganic suspended solids by the experiments of single and mixed components of surface water particles in the laboratory, (ii) to propose a polarized coupling model for accurate estimation of the cross-correlation of inorganic and organic particles in class II water, and (iii) to explore the ability to analyze the optical signal of water-leaving radiation in terms of the contribution of optically active particles in lakes water [32].
2. Materials and Methods
2.1. Materials
2.1.1. Laboratory Samples
Guided by the index classification standard for five categories of water quality in the environmental quality standard for surface water, four samples of inorganic suspended solids and algae particles with different concentrations were designed. Specifically, the median particle size of a single inorganic suspended solids was 30–40 μm. The sediment samples were configured with concentrations of 30, 100, 250, and 500 mg/L. The single algae particle samples were made of green algae by grinding and filtering in a dark room. Then, 400, 600, 800, and 1000 mL of algae solution were taken for the preparation of the sample. The corresponding chlorophyll-a concentrations were 25.66, 38.57, 74.61, and 116.53 μg/L. Then, four mixed water samples were prepared by using sediment and algae solution. According to the concentration distribution range of lake water parameters, the four mixed water samples were configured in a certain proportion. After testing, the corresponding chlorophyll-a concentrations of four mixed water samples were 77.4, 117.16, 160.25, 207.5, and 270.31 μg/L, and suspended solid concentrations were 72, 138, 182, and 237 mg/L, respectively. To test the simulation effect of mixed water, samples of natural water were collected in the field according to the four types of water quality standards. The concentrations of chlorophyll a were 77.4, 107.5, 149.4, and 207.5 μg/L, and the suspended solids concentrations were 32, 45, 58, and 65 mg/L, respectively.
2.1.2. Lake Water Samples
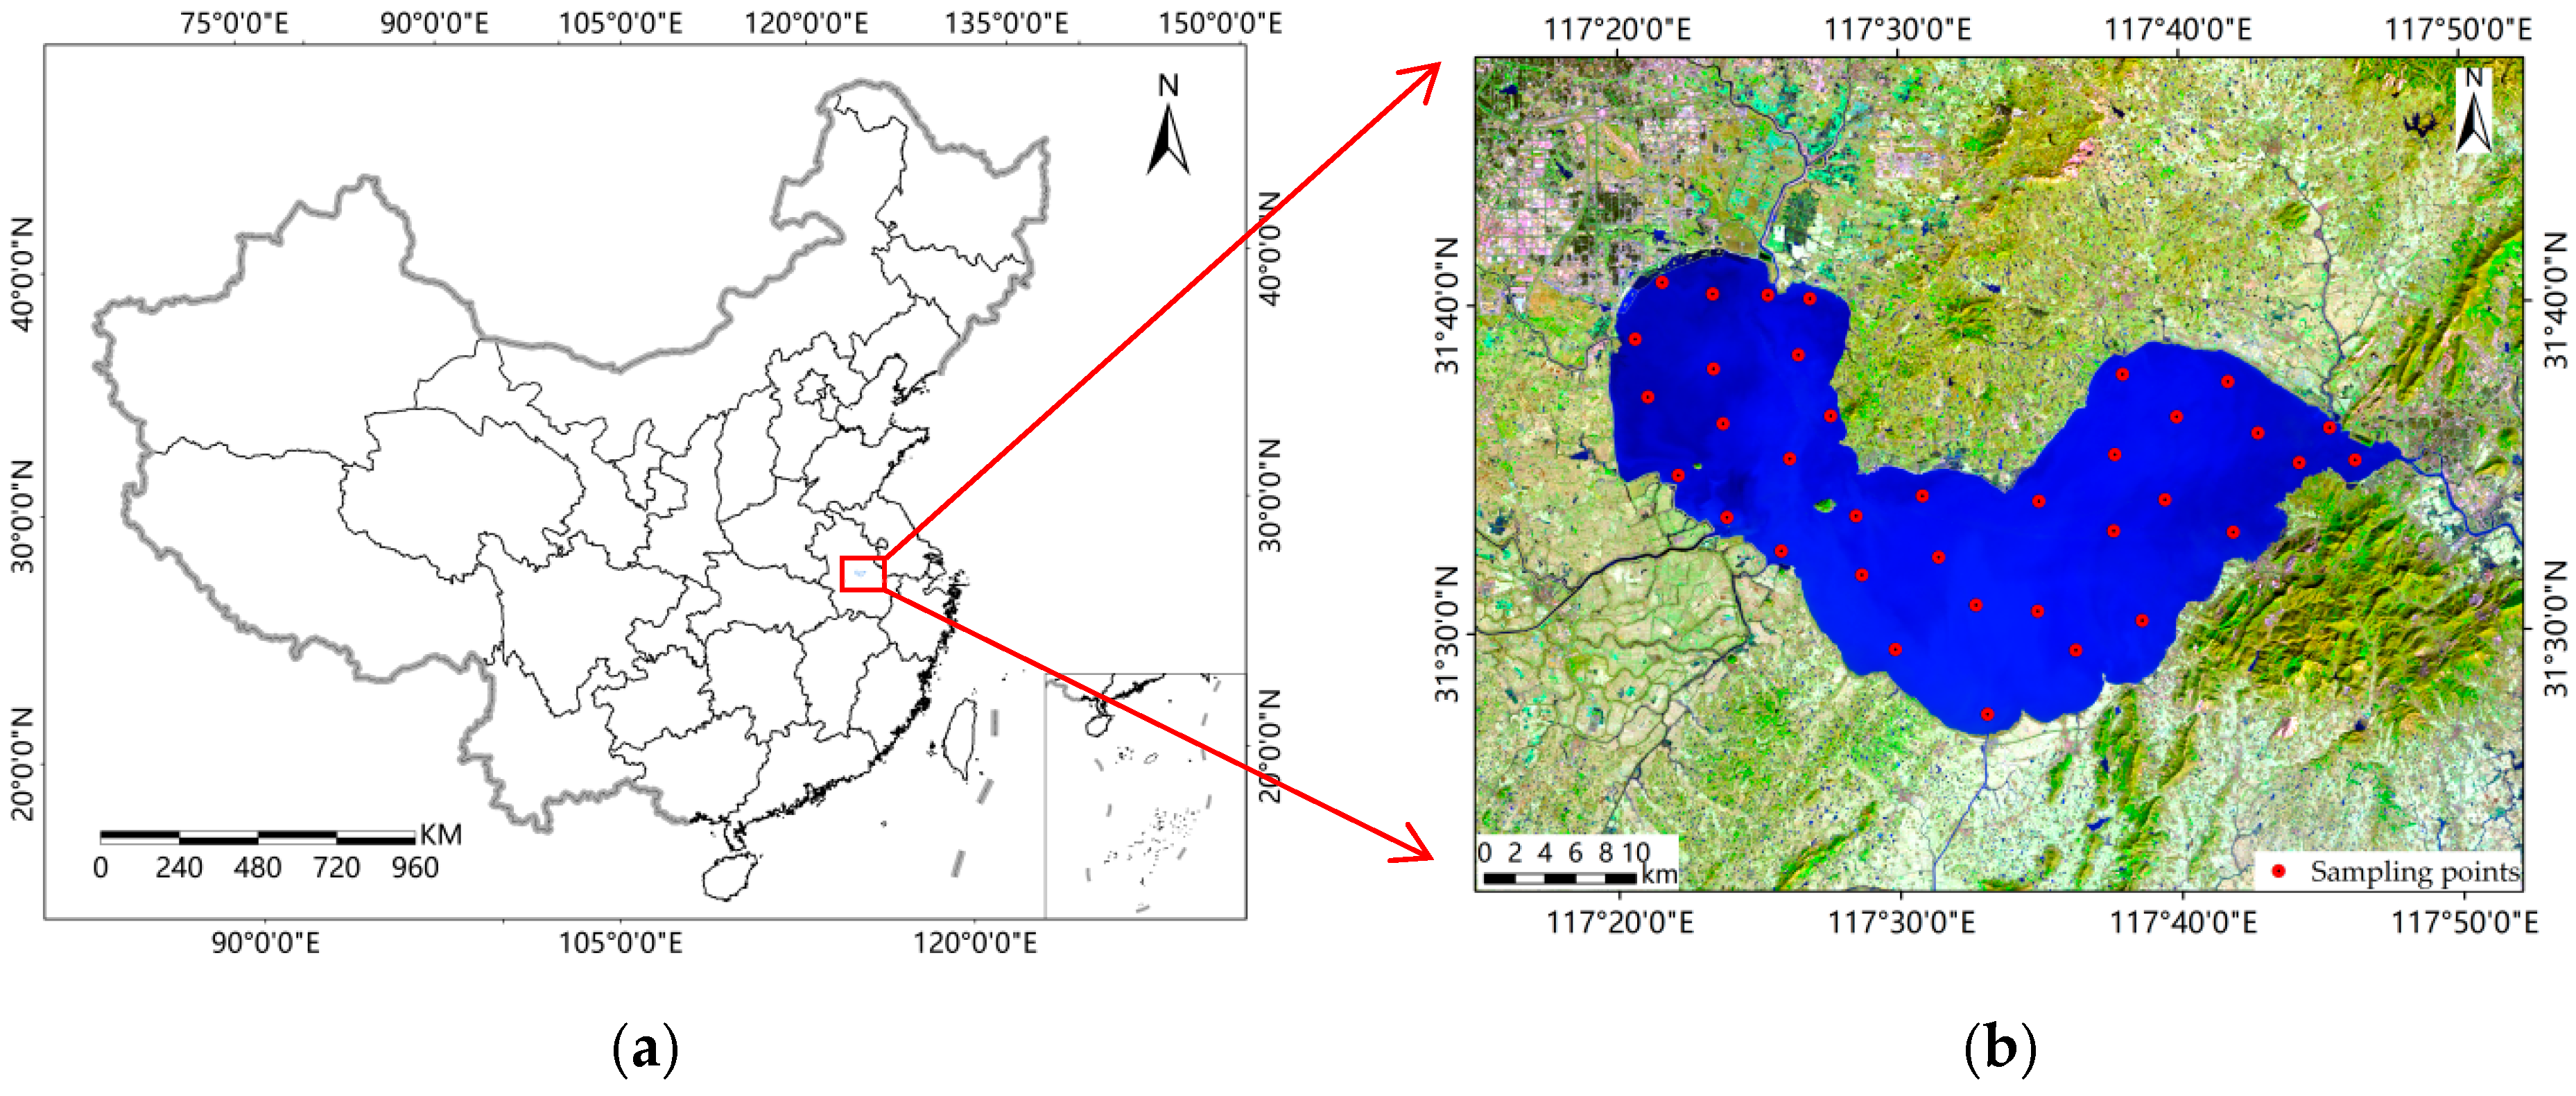
As the study area, Chaohu Lake is one of the five largest freshwater lakes in China. It is located in the central part of Anhui Province, China with an area of 780 square kilometers, a volume of 2.07 billion cubic meters, an east–west length of 55 km, a north–south width of 21 km, a lake shoreline circumference of 176 km, an average water depth of 2.89 m, and is a typical shallow-water algae-derived lake, as shown in Figure 1a. There are 227 phytoplankton belonging to 85 genera with cyanobacteria greater than 95% in the lake area.
The experimental samples were obtained from 36 sample points in the lake, as shown in Figure 1b. A standard sampler was used to collect approximately 2 L of surface water approximately 20 cm below the surface of the water, and placed in plastic buckets that were washed with 10% HCl deionized water. The longitude and latitude coordinates of the sample points were recorded with GPS. After sampling, the water samples were measured to form reflection intensity and polarization spectra and were tested simultaneously to obtain the concentration of chlorophyll-a and inorganic suspended solids in the laboratory within 24 h.
2.2. Instruments
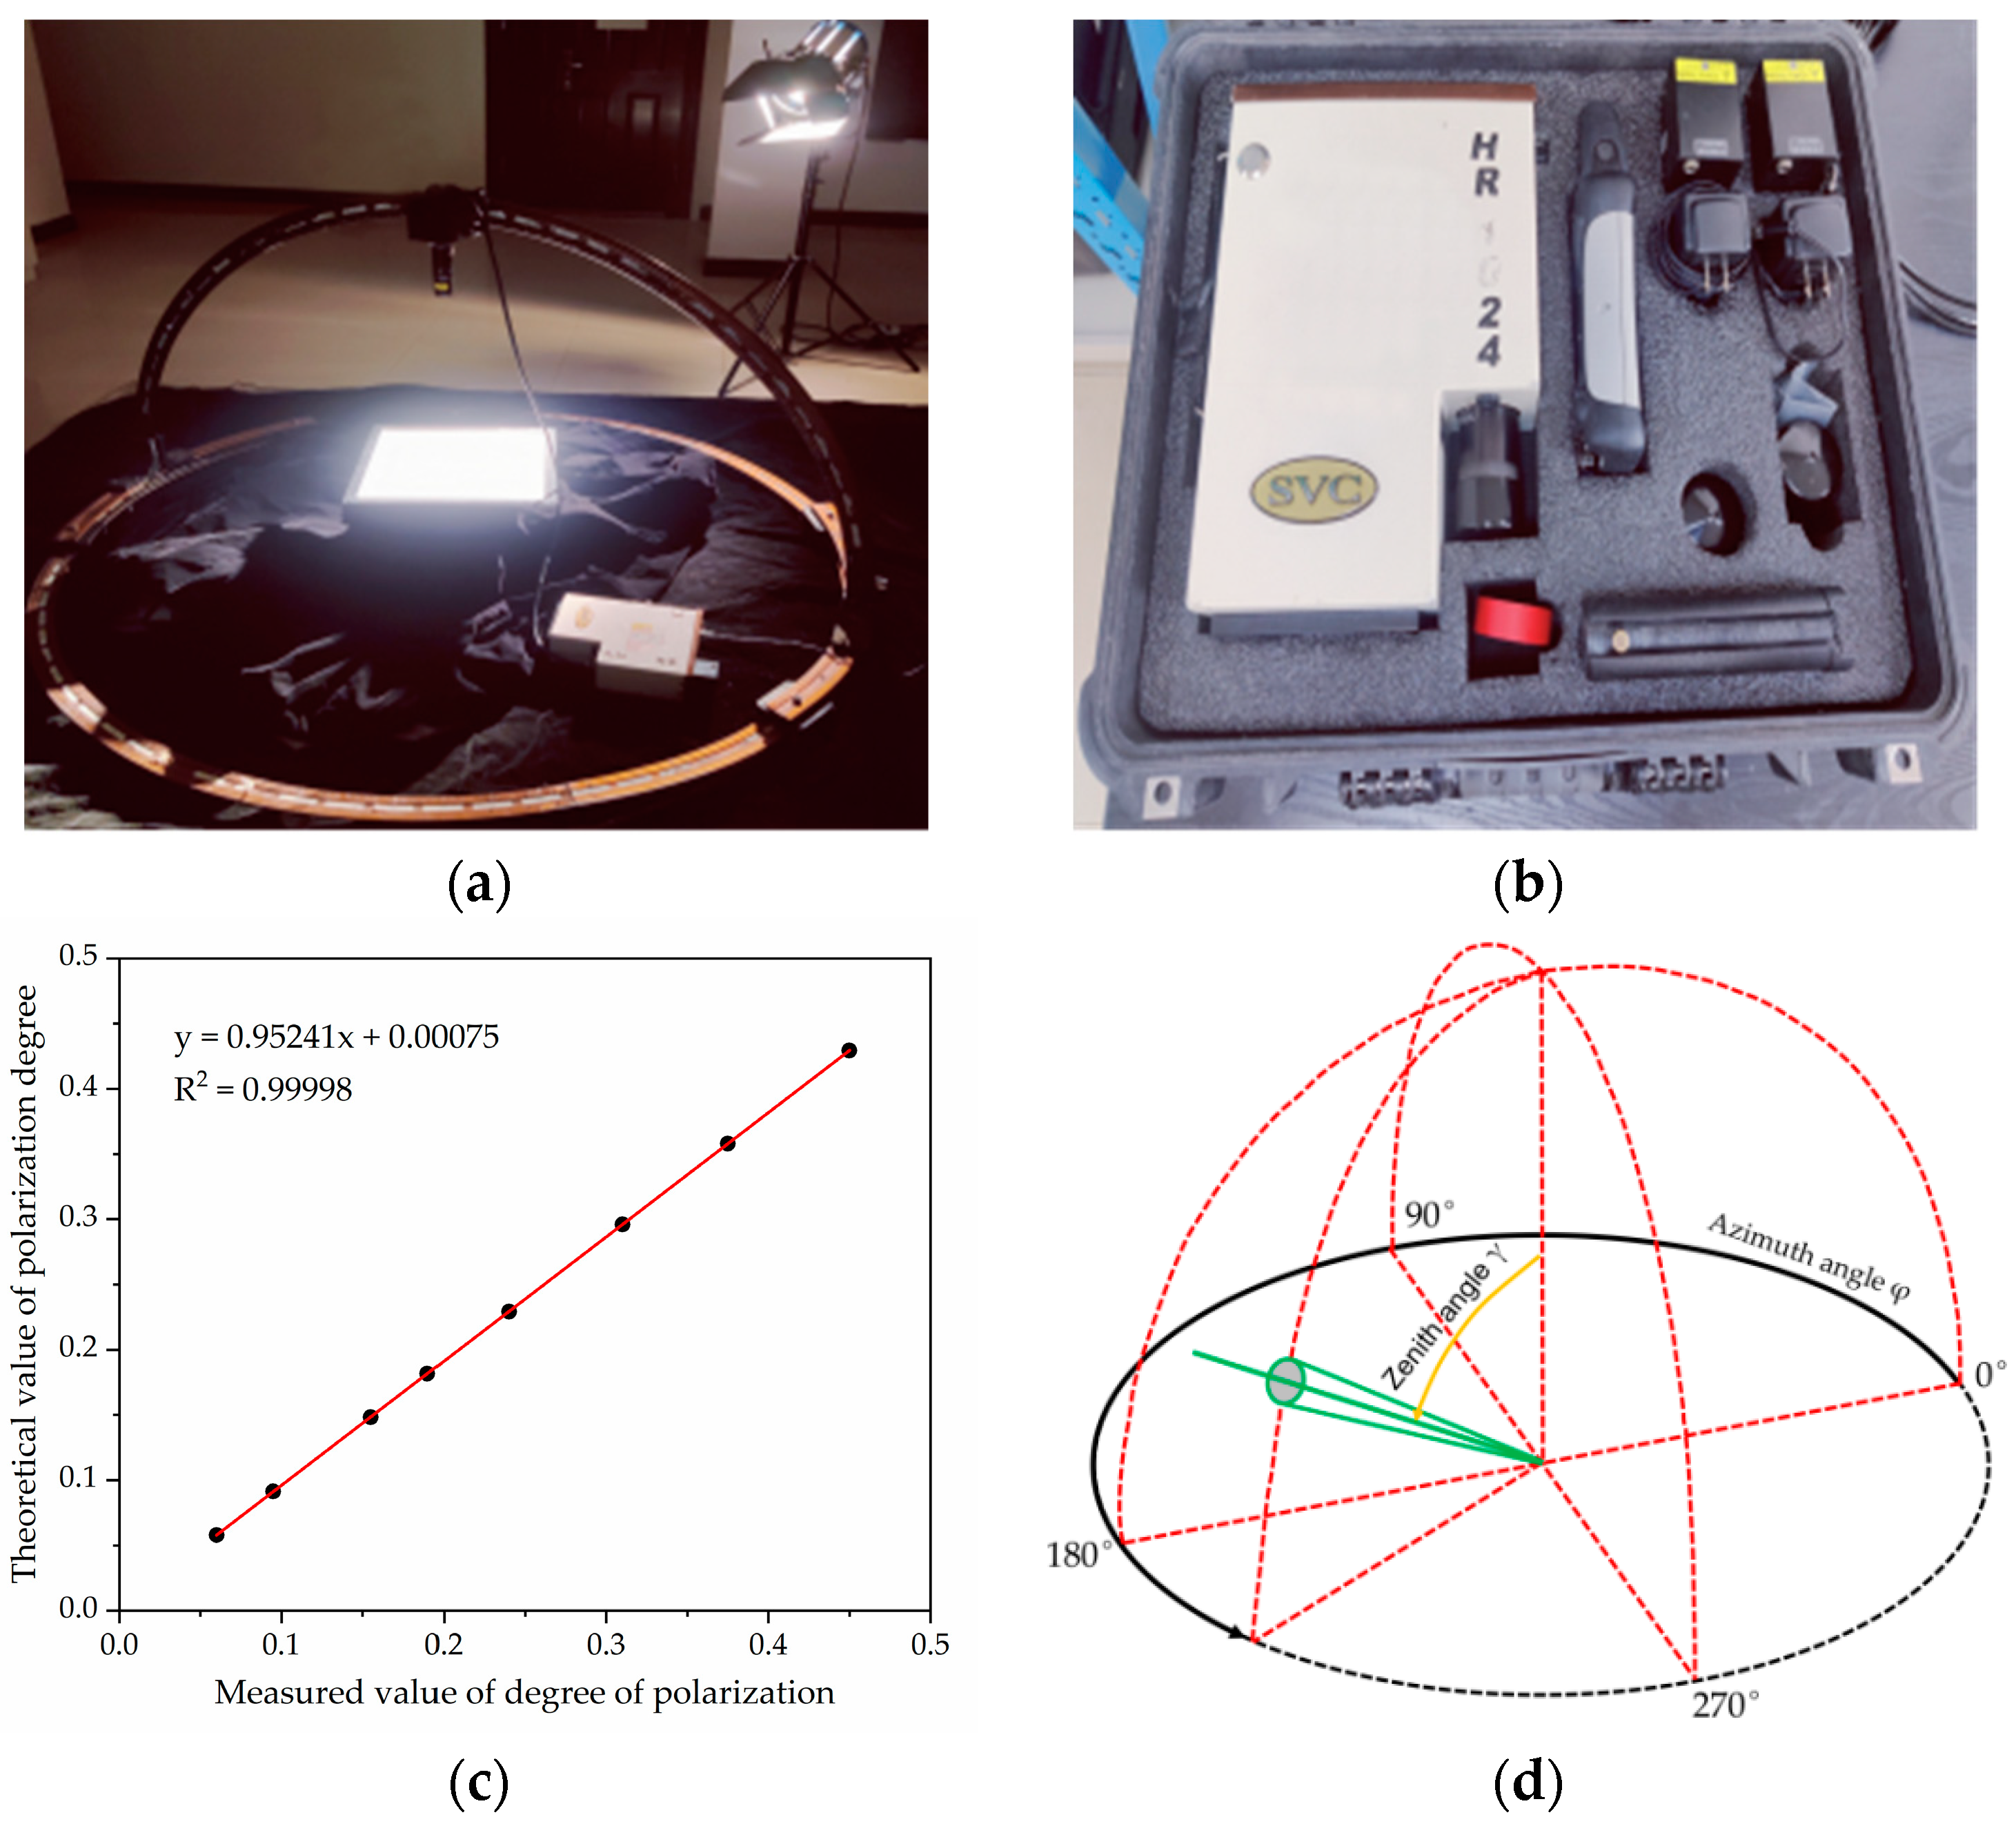
Bidirectional reflectance distribution function (BRDF) describes how the reflectance depends on view and solar angles, and provides surface reflectance explicitly in terms of its spectral, directional, spatial, and temporal characteristics [33]. A BRDF measurement system consists of a measurement frame, an SVC HR1024 portable field spectrometer, control system units, and an ordinary high-power photographic searchlight. An SVC spectrometer is mounted on an automatically rotating semi-circular orbit with a zenith angle of 0° to 70°. Driven by the control unit motor, the SVC spectrometer can rotate freely on the horizontal plane, and the azimuth angle is set to 0° to 360°, as shown in Figure 2a [34]. SVC HR1024 can obtain high spectral resolution in the whole VIS-NIR-SWIR field, with a spectral range of 350–2500 nm, 1024 channels, and a spectral resolution better than 10 nm, as shown in Figure 2b. A polarizing lens with an arbitrary rotation angle was installed in front of the measuring lens of the SVC HR1024 ground object spectrometer, which consisted of a polarizer and a depolarizer with an equivalent spectral range of 400–750 nm.
To verify the accuracy of the polarization degree measured by the instrument, a variable polarization degree light source (VPOLS) was used to realize polarization calibration to ensure good polarization measurement accuracy. Figure 2c shows that the measured degree of polarization was linearly matched with the degree of polarization of the VPOLS emission, and the polarization correction coefficient R2 was 0.99998. When the spectrum was measured, the experimental stainless steel cylindrical iron pool was used to hold water samples. The inside and outside of the pool were sprayed with black matte paint, and two stirring pumps were placed at the bottom of the pool to prevent particles precipitation.
For multi-angle intensity spectrum measurement, the standard white board was vertically measured first in each group of radiance measurements, and then the multi-angle BRDF measurement was carried out in groups with the observation azimuth every 30° and the observation zenith angle every 10°, as shown in Figure 2d. The white board was measured after each azimuth was measured. An SVC HR1024 detection optical fiber was used, and the field angle was 25° in the experiment. The BRDF angle adjustment frame was used to control the change in observation angle.
For multi-angle polarization spectrum measurement, an SVC HR1024 spectrometer was used with a polarizing lens and a 10° field angle. Polarization states of 0°, 60°, and 120° were selected in the main plane to obtain three Stokes parameters (I, Q, U) and degree of polarization in each direction. The observation zenith angle was measured at a point every 10°, and the white board was also measured every half of the main plane. The measurement method for the multi-angle polarized BRDF was the same as that for the multi-angle radiance BRDF.
2.3. Methods
2.3.1. The Degree of Linear Polarization (DOLP)
The intensity and polarization characteristics of a radiance can be fully described by the Stokes vector (S). The Stokes vector is composed of four elements, I, Q, U, and V and provides a complete description of the light polarization state as [35]:
where I is the total radiance intensity, Q is the linearly polarized component in the parallel or perpendicular to the meridian plane, U is the linearly polarized component in the direction 45° or −45° to the meridian plane, and V is the circular polarized component [36].
In the actual measurement, V is very little for the light on the water surface and is usually negligible. Stokes parameters I, Q, and U can be obtained by measuring the light intensity of the linearly polarized component at three different angles. It is usually calculated by three polarized directions of 0°, 60°, and 120° as [37]:
For water-leaving radiation, the three components of the Stokes vector can be obtained by Equation (2), thus the DOLP of the underwater upwelling radiance can be determined as follows:
2.3.2. Construction and Verification of Estimation Models
Partial least squares regression (PLSR) is a multivariate statistical method commonly used in hyperspectral inversion to analyze multiple dependent variables. It finds a linear regression model by projecting the predicted variable and the observed variable in a new space and can solve the multicollinearity problem between independent variables.
First, the input spectral matrix X and the output matrix Y of the training set are decomposed as follows:
where T and U are the score matrix of matrix X and matrix Y, respectively. P and Q are the load matrix of matrix X and matrix Y, respectively, and E and F are the residual matrix of matrix X and matrix Y, respectively. When using PCA in matrix decomposition, it is necessary to ensure that T and U retain the information of X and Y as much as possible and have as much correlation as possible.
Next, the score matrices T and U perform linear regression to obtain Equation (7),
In Equation (6), B and Ed are the regression coefficients and the residual matrices, respectively. Equations (5) and (6) can be combined to obtain Equation (7). For prediction, the scoring matrix T of the input spectral matrix X is calculated according to the load matrix P of X, and then the predicted value of the pending sample can be calculated using Equation (7) [38].
The stability of the model is determined by the determination coefficient (R2) and the correlation coefficient represents the main index of the degree of correlation between different variables. The larger the correlation coefficient is, the higher the correlation. The accuracy is tested by the root mean square error (RMSE), which can evaluate the correlation between different variables after fitting. The smaller the RMSE, the higher the correlation. The RMSE formula is as follows:
where is the inversion value of the water parameter model of the sample points, is the measured value of the water parameter concentration of the sample points, and n is the total number of sample points [38].
3. Results and Discussion
3.1. Coupled Analysis of the Polarization Intensity Spectrum and DOLP Spectrum Characteristics of Lake Water
3.1.1. Spectral Variation
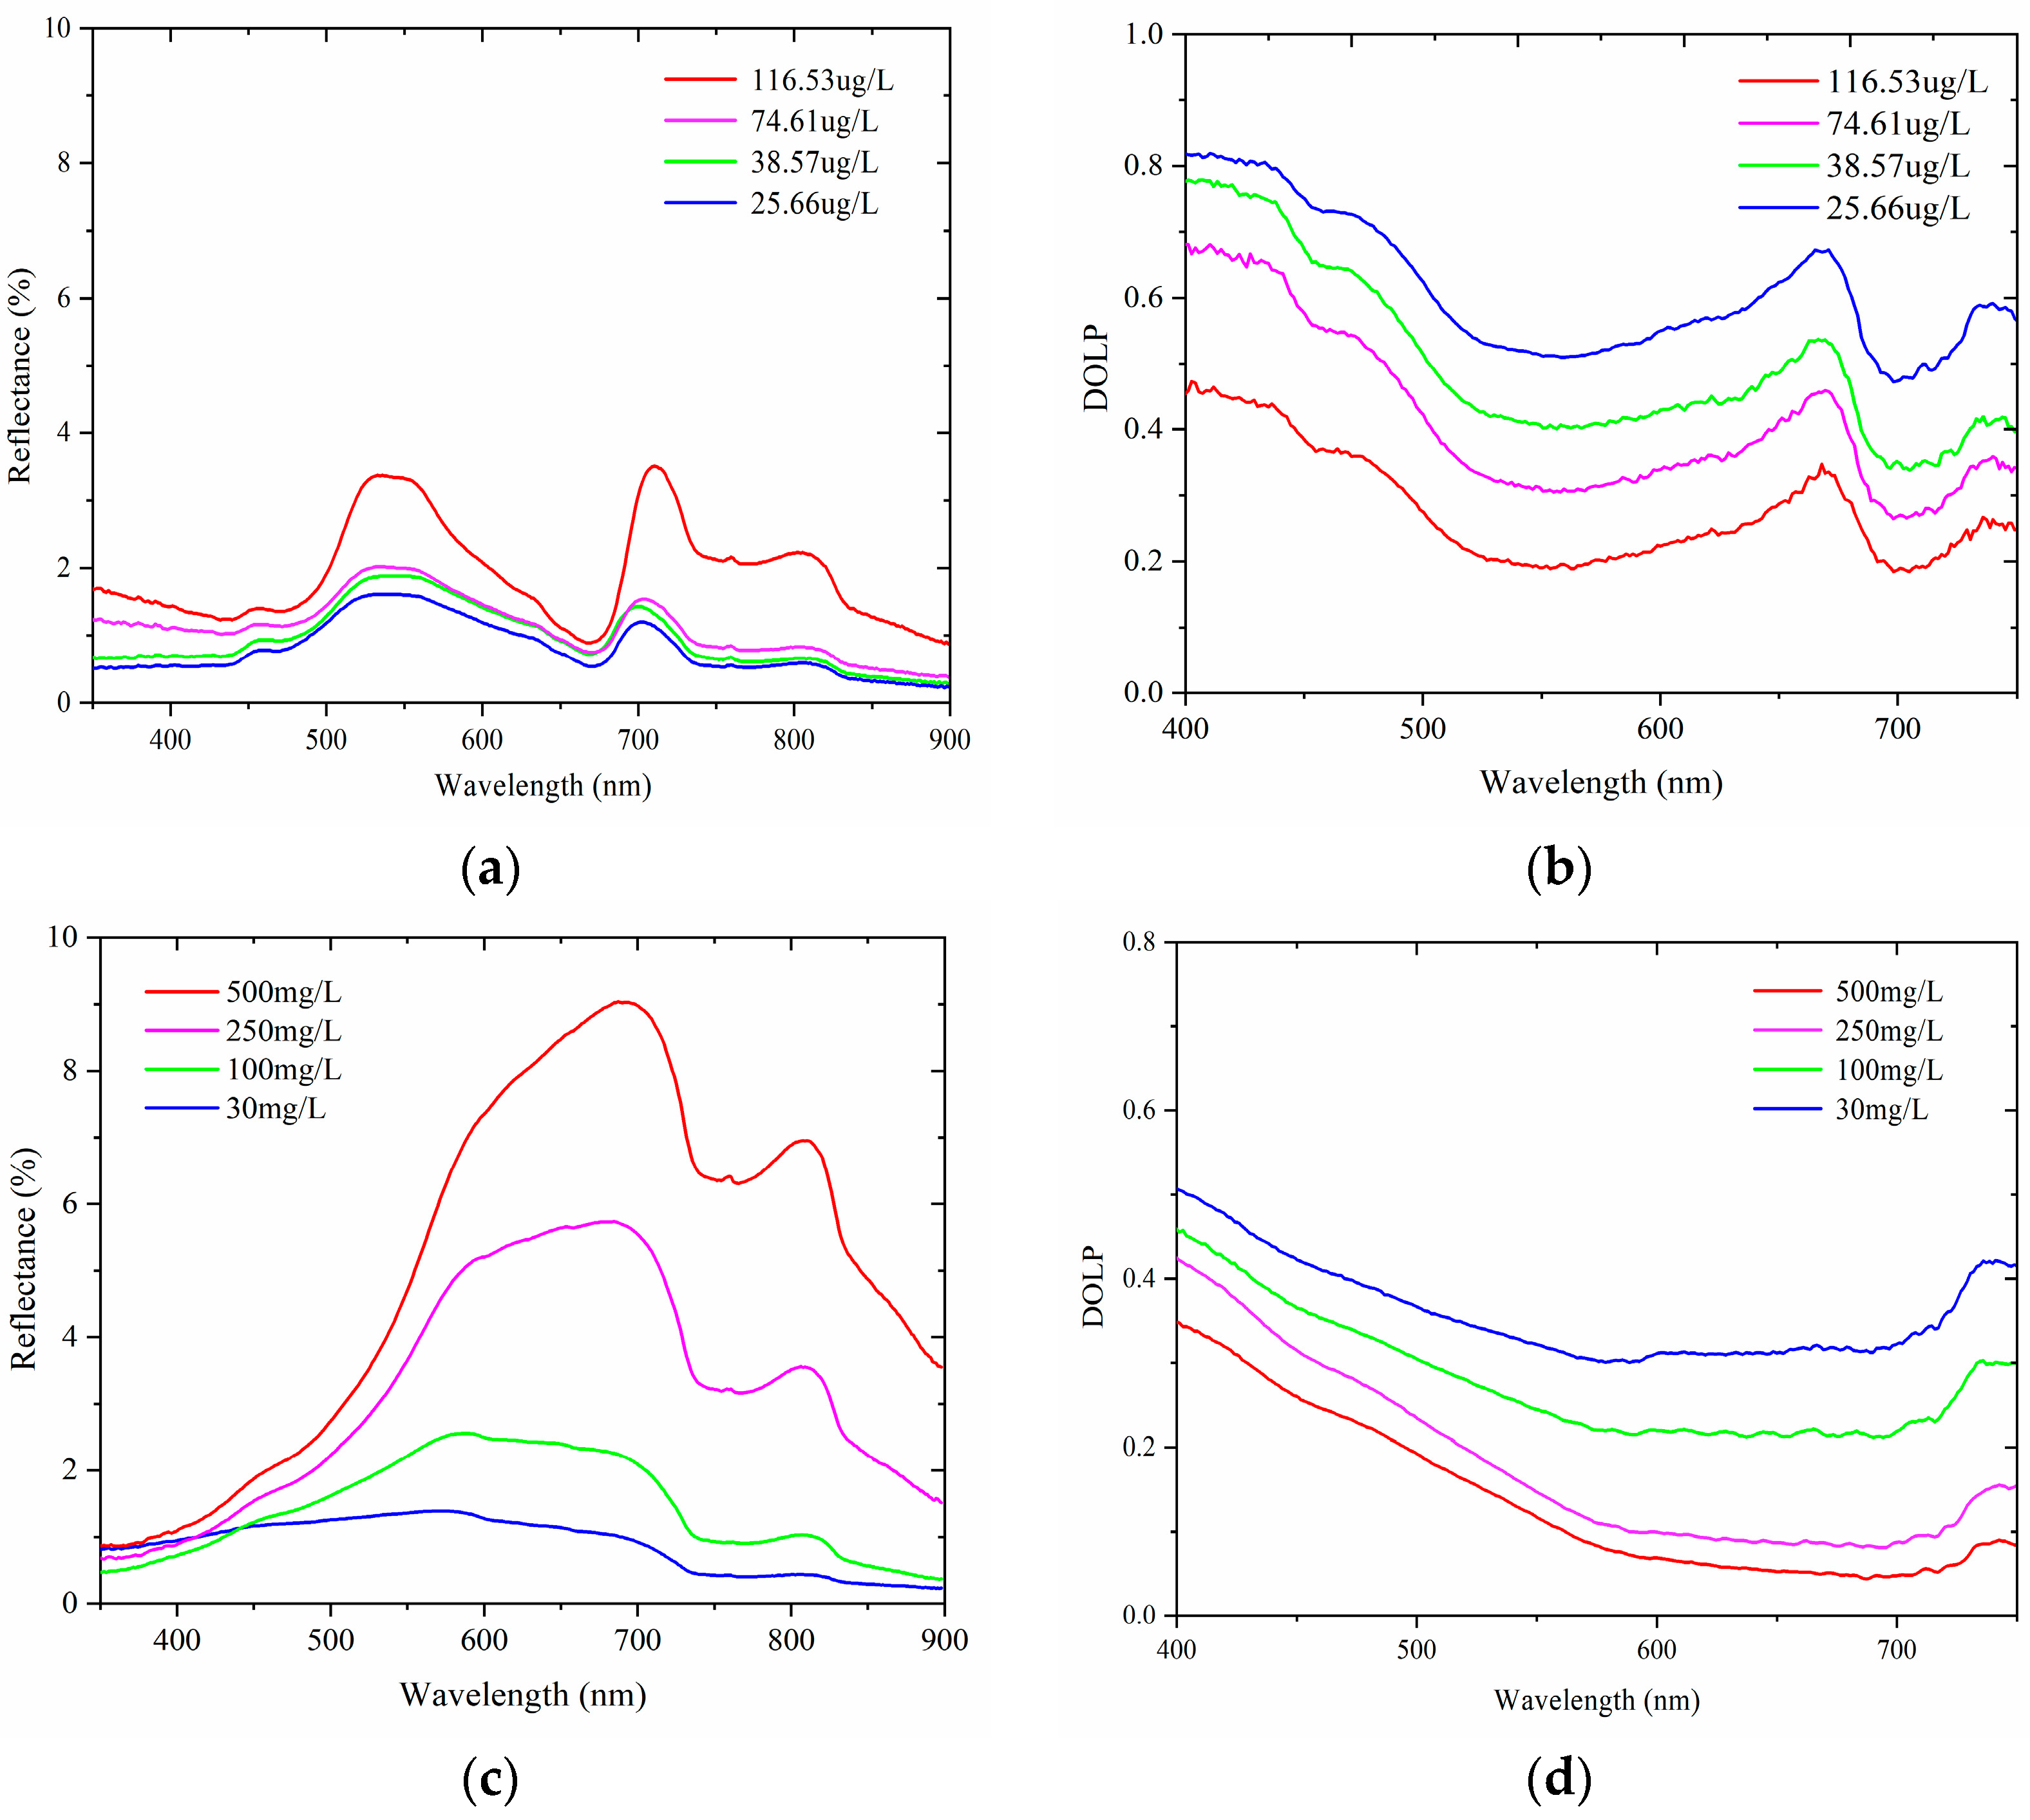
Figure 3 showed the reflectance and DOLP spectra of single algae particles and single inorganic suspended solids by an azimuth angle of 90° in the underwater upwelling radiance, respectively. For single algae particles in water, the characteristic bands of the reflectance and DOLP spectra were consistent and located at 550, 670, and 710 nm bands in the four water samples. With an increase in the concentration of algal pigment, the reflectance of water began to increase slowly, and DOLP showed a downward trend. As shown in Figure 3a,b, DOLP had obvious discrimination with respect to concentration rather than reflectance spectrum.
For inorganic suspension particles, the characteristic bands of the reflectance and the DOLP spectra of the underwater upwelling radiance were also consistent and were located in the bands of 685 and 740 nm, as shown in Figure 3c,d. With the increase in the concentration of inorganic suspended solids, the reflectance of the water increased rapidly because the backscattering characteristics of the particles were strong. However, while the probability of multiple scattering between light and particles in the water increased, the depolarization of multiple scattering led to a decrease in DOLP, as shown in Figure 3c,d. Compared to the reflectance spectra, the discrimination of DOLP at the characteristic band was slightly reduced, which was conducive to the coupling analysis of multi-component water [39].
3.1.2. Angle Variation
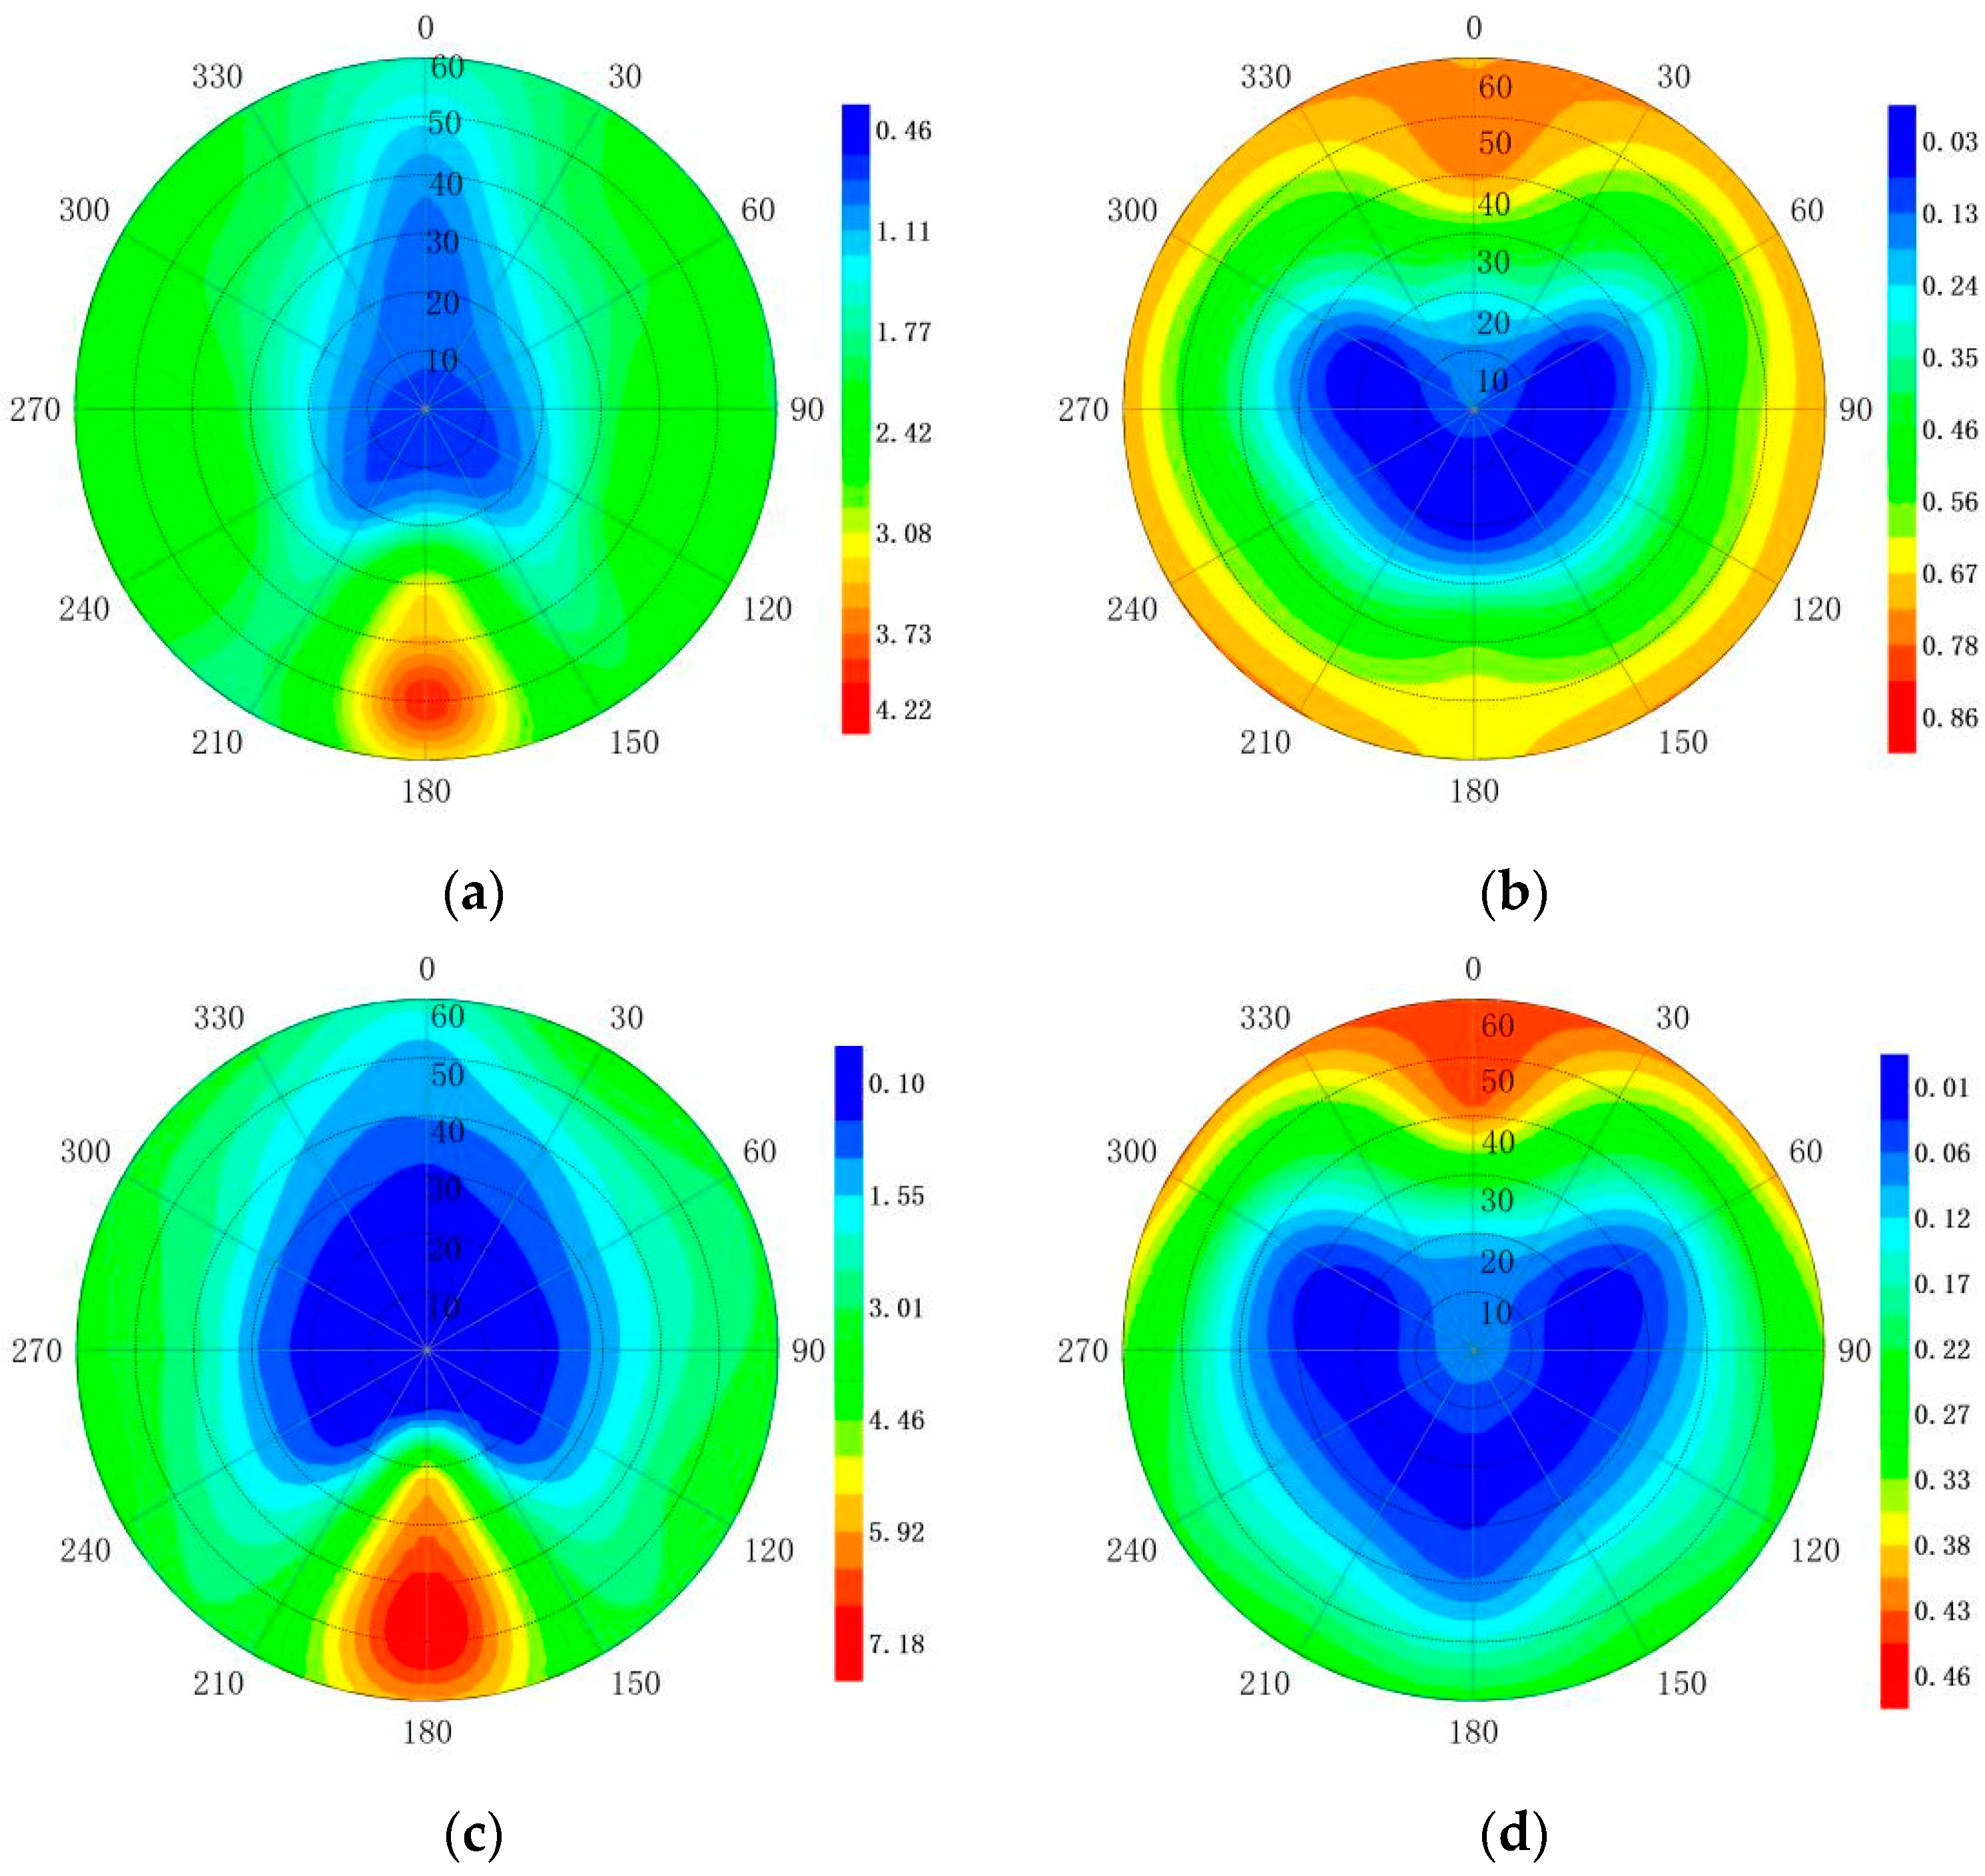
Figure 4 shows the polar coordinate diagram of the variation in reflectance and DOLP of algae particles and inorganic suspended solids in underwater upwelling radiance with the sensor zenith angle and the sensor azimuth angle, respectively. The concentration of the algae solution in water is 116.53 μg/L, inorganic suspended solids 100 mg/L at 685 nm band, and solar zenith angle of 45°. Each circle in the concentric cluster refers to the sensor zenith angle with a 10° increase and the sensor azimuth angle with a 30° increase.
In Figure 4, the reflectance and DOLP of algae particles and inorganic suspended solids are symmetrically distributed along the solar meridian plane and show obvious directional reflectance characteristics. In the meridian plane with an azimuth angle of 180°, the maximum value of the directional reflectance lies in the sensor zenith angle of 50–60°, and the bright solar flare region appears. As shown in Figure 4a,c, the solar flare area of the inorganic suspended solids is larger than that of the algal particles. It shows that even in high algae water, a small amount of inorganic suspended solids in the 685 nm band still has a great influence on the water-leaving radiation signal. However, in Figure 4b,d, solar flare region disappears on the meridian plane. The DOLP of the direction towards an azimuth angle of 180° is larger than that of the direction towards an azimuth angle of 0°. The maximum value of DOLP appears near Brewster angle. This indicates that the polarizer effectively suppressed the influence of the solar flare and showed that DOLP is less sensitive to solar flare than reflectance and had a better interpretation of the water-leaving radiance signal [40].
3.1.3. Mixing Spectral Analysis
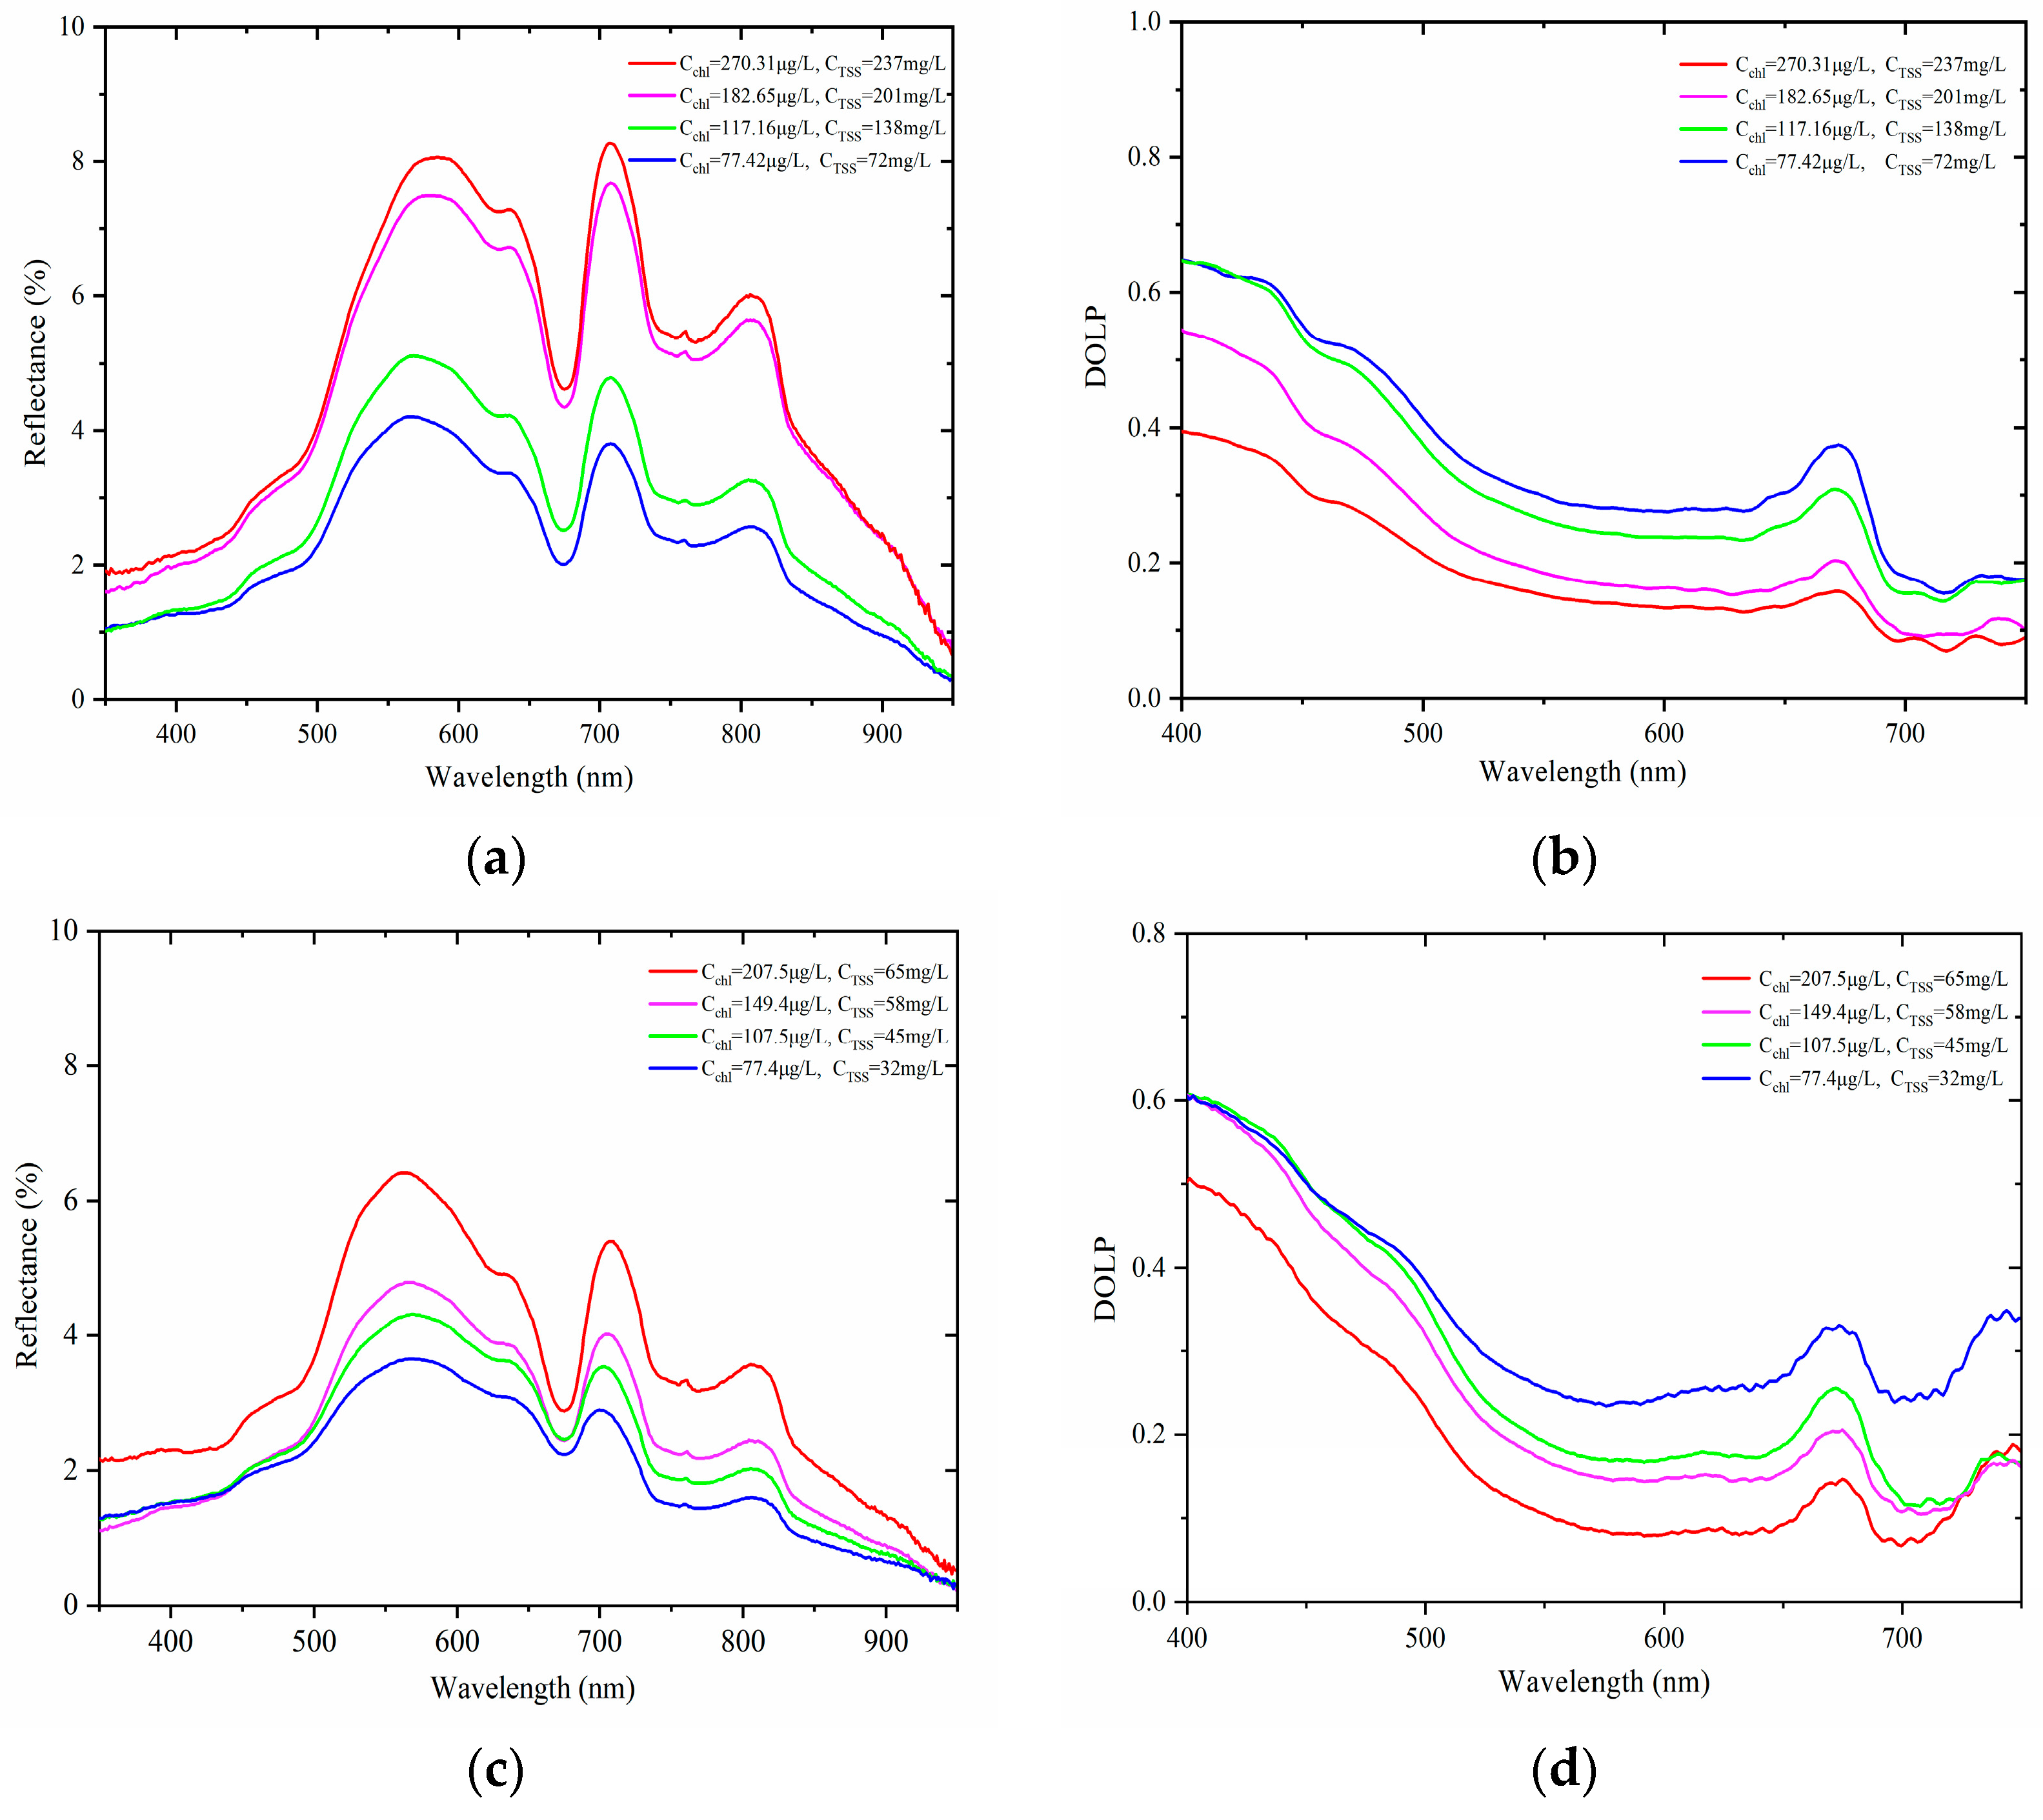
Laboratory mixed water samples and natural water samples in the pond were selected to verify the control results. The reflectance spectra in Figure 5a,c, both of the characteristic bands are consistent and lie near the 570, 670, 710, and 740 nm bands. Compared with Figure 3, the characteristic peak of green band (570 nm) has a certain deviation, which may be the result of the coupling of algal particles and inorganic suspended solids in the water-leaving radiance signal.
For Figure 5b,d, the DOLP did not show good consistency with the reflectance spectra in Figure 5a,c in the characteristic spectral band, such as 570 nm band. The inelastic scattering of algae particles and the multiple scattering of organic particles have a strong depolarization effect, resulting in the disappearance of the characteristic position. This coupling characteristic effect may bring some uncertainty to the prediction model of class II water.
3.2. Coupling Modeling of Polarized Reflection between the Particles
3.2.1. Polarized Reflection Spectra of Chaohu Lake
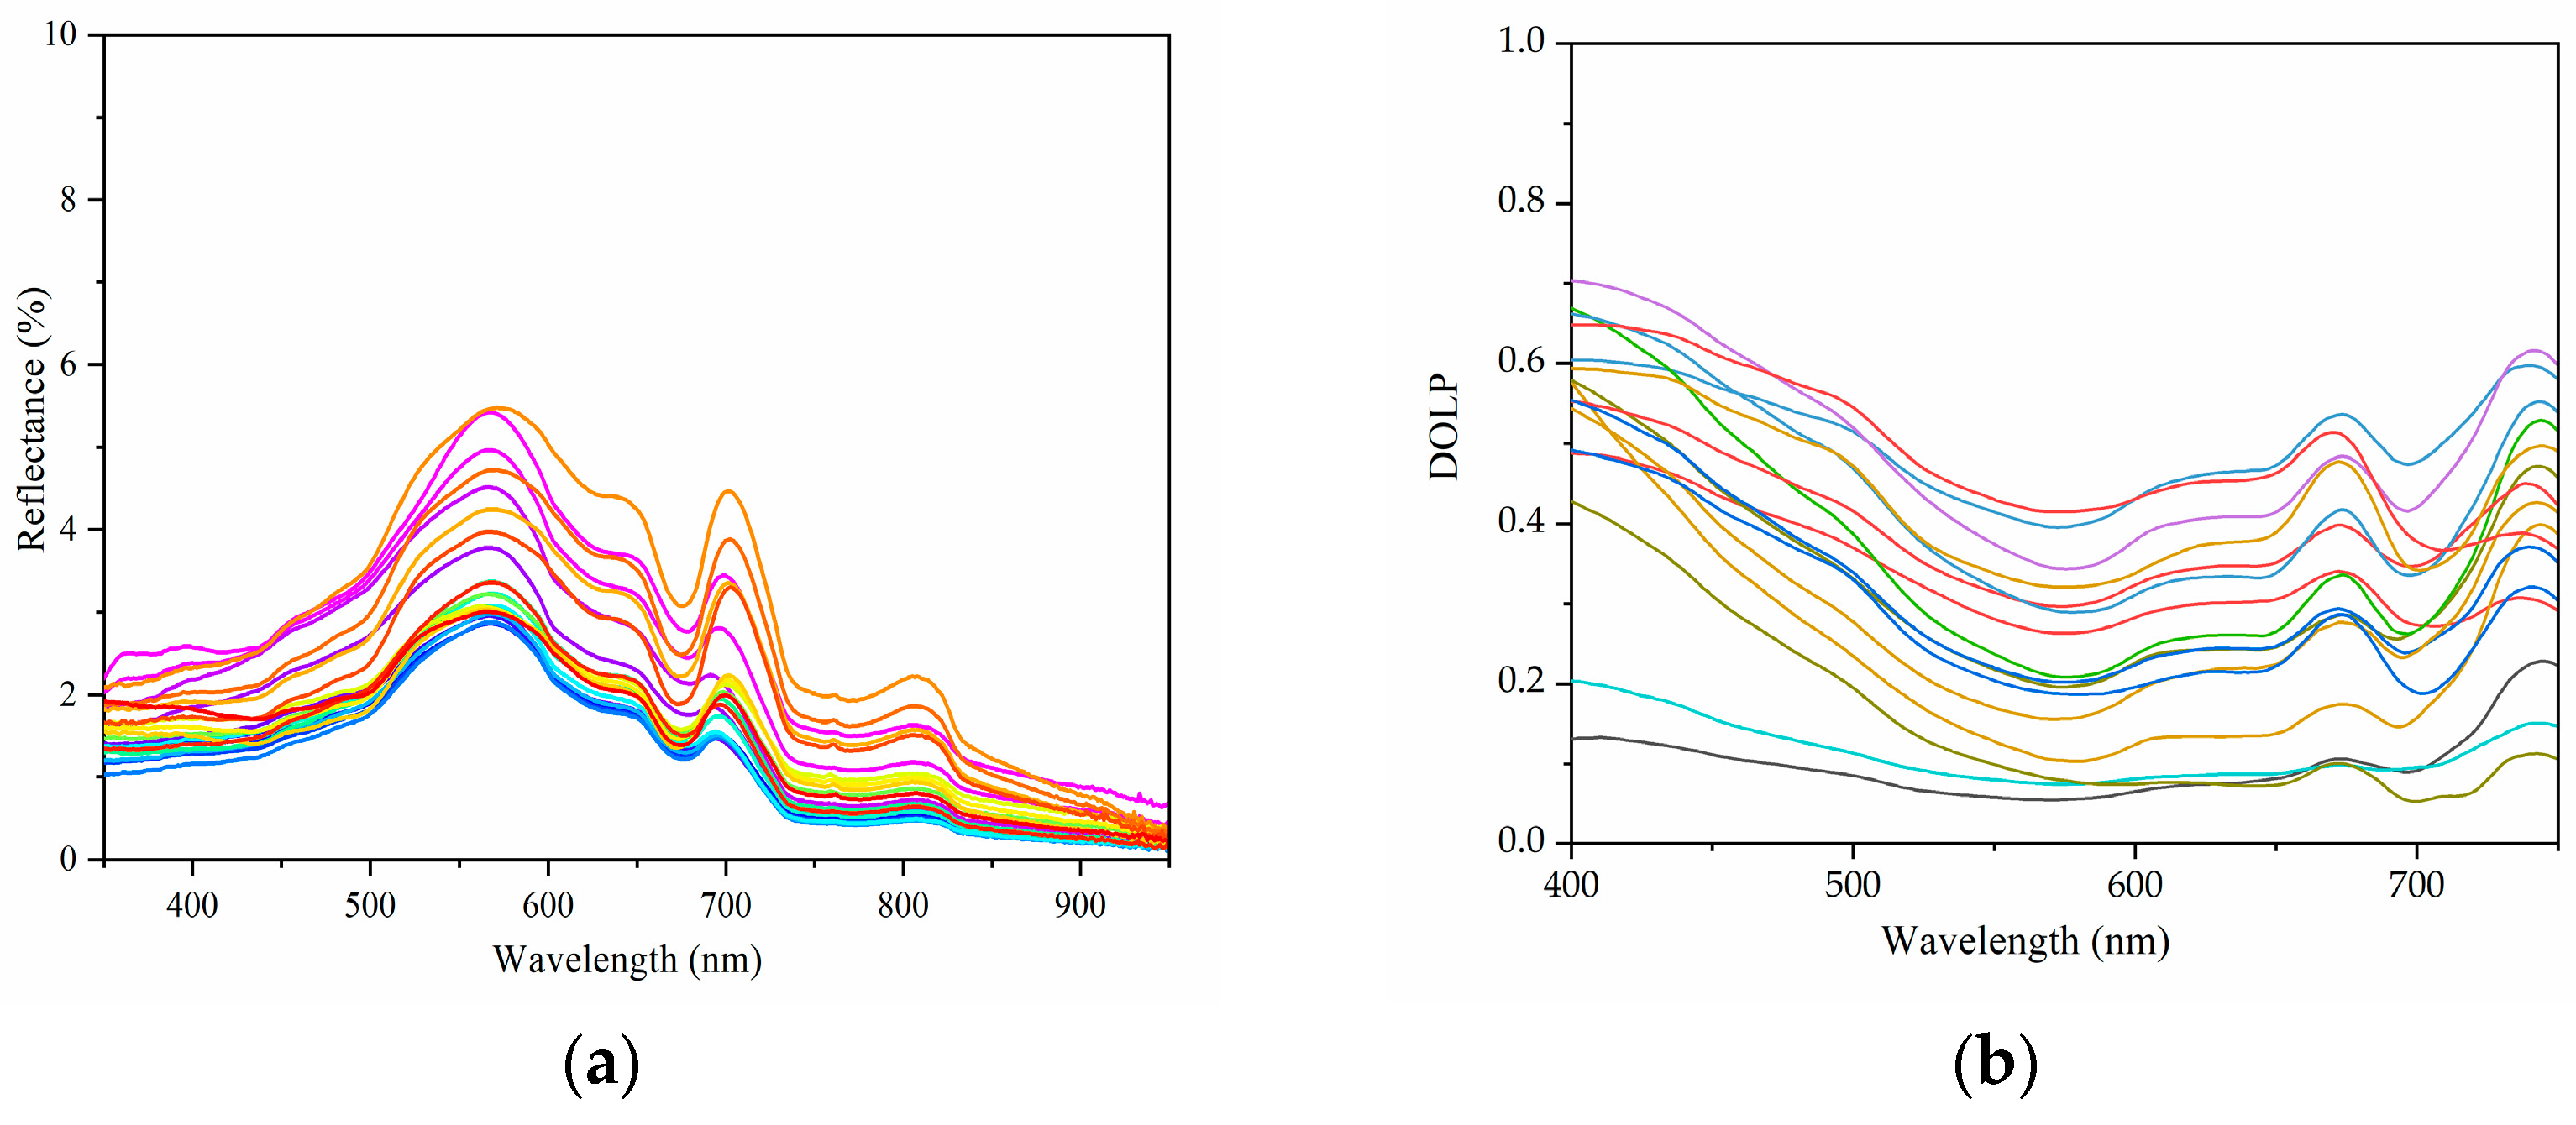
The reflectance and DOLP of 36 samples from Chaohu Lake were measured with an SVC HR1024 spectrometer with a polarizing lens in the laboratory, as shown in Figure 6. In the meridian plane with an azimuth angle of 0°, spectra were collected with a solar zenith angle of 45° and a sensor zenith angle of 53°. The chlorophyll-a concentration ranged from 10–80 μg/L, the concentration of inorganic suspended solids from 10 mg/L to 65 mg/L in the water samples. Compared with natural water in the pond in Figure 5, the characteristic bands were verified to be 570, 675, 705, and 810 nm. Similar to the natural water in Figure 4c, the characteristic band at 675 and 705 nm also has a certain deviation, which further proved the uncertainty of the coupling characteristics of particles in the water to the water-leaving radiance signal. Compared to the DOLP of natural water in the field in Figure 5d, the characteristic bands were verified to be 570, 675, and 705 nm.
3.2.2. PLSR Modeling of the Particle Concentration in Lake Water
According to the control experiment, the reflectance and DOLP of algae particles and inorganic suspended solids in water is closely related to the corresponding concentration near 560, 670, 710, 740, and 810 nm, and there is a coupling effect of mixed spectra. Based on the actual measured spectrum of the sampling point of Chaohu Lake water, the ratio of the reflectance and DOLP at 675 and 705 nm (R (705)/R (675), P (705)/P (675)) were selected to establish the particle concentration regression model. A total of 24 samples were selected as training samples and 12 samples as test samples. They were divided, respectively, by random functions as shown in Table 1. Then, the concentration of algae particles (Cchl-a), inorganic suspended solids (CTSS) were selected as independent variables (x), the reflectance and DOLP as dependent variables (y), and PLSR algorithms were selected to establish the coupling model of the particles, respectively. The accuracy of the model was determined by R2 and RMSE, as shown in Table 2.
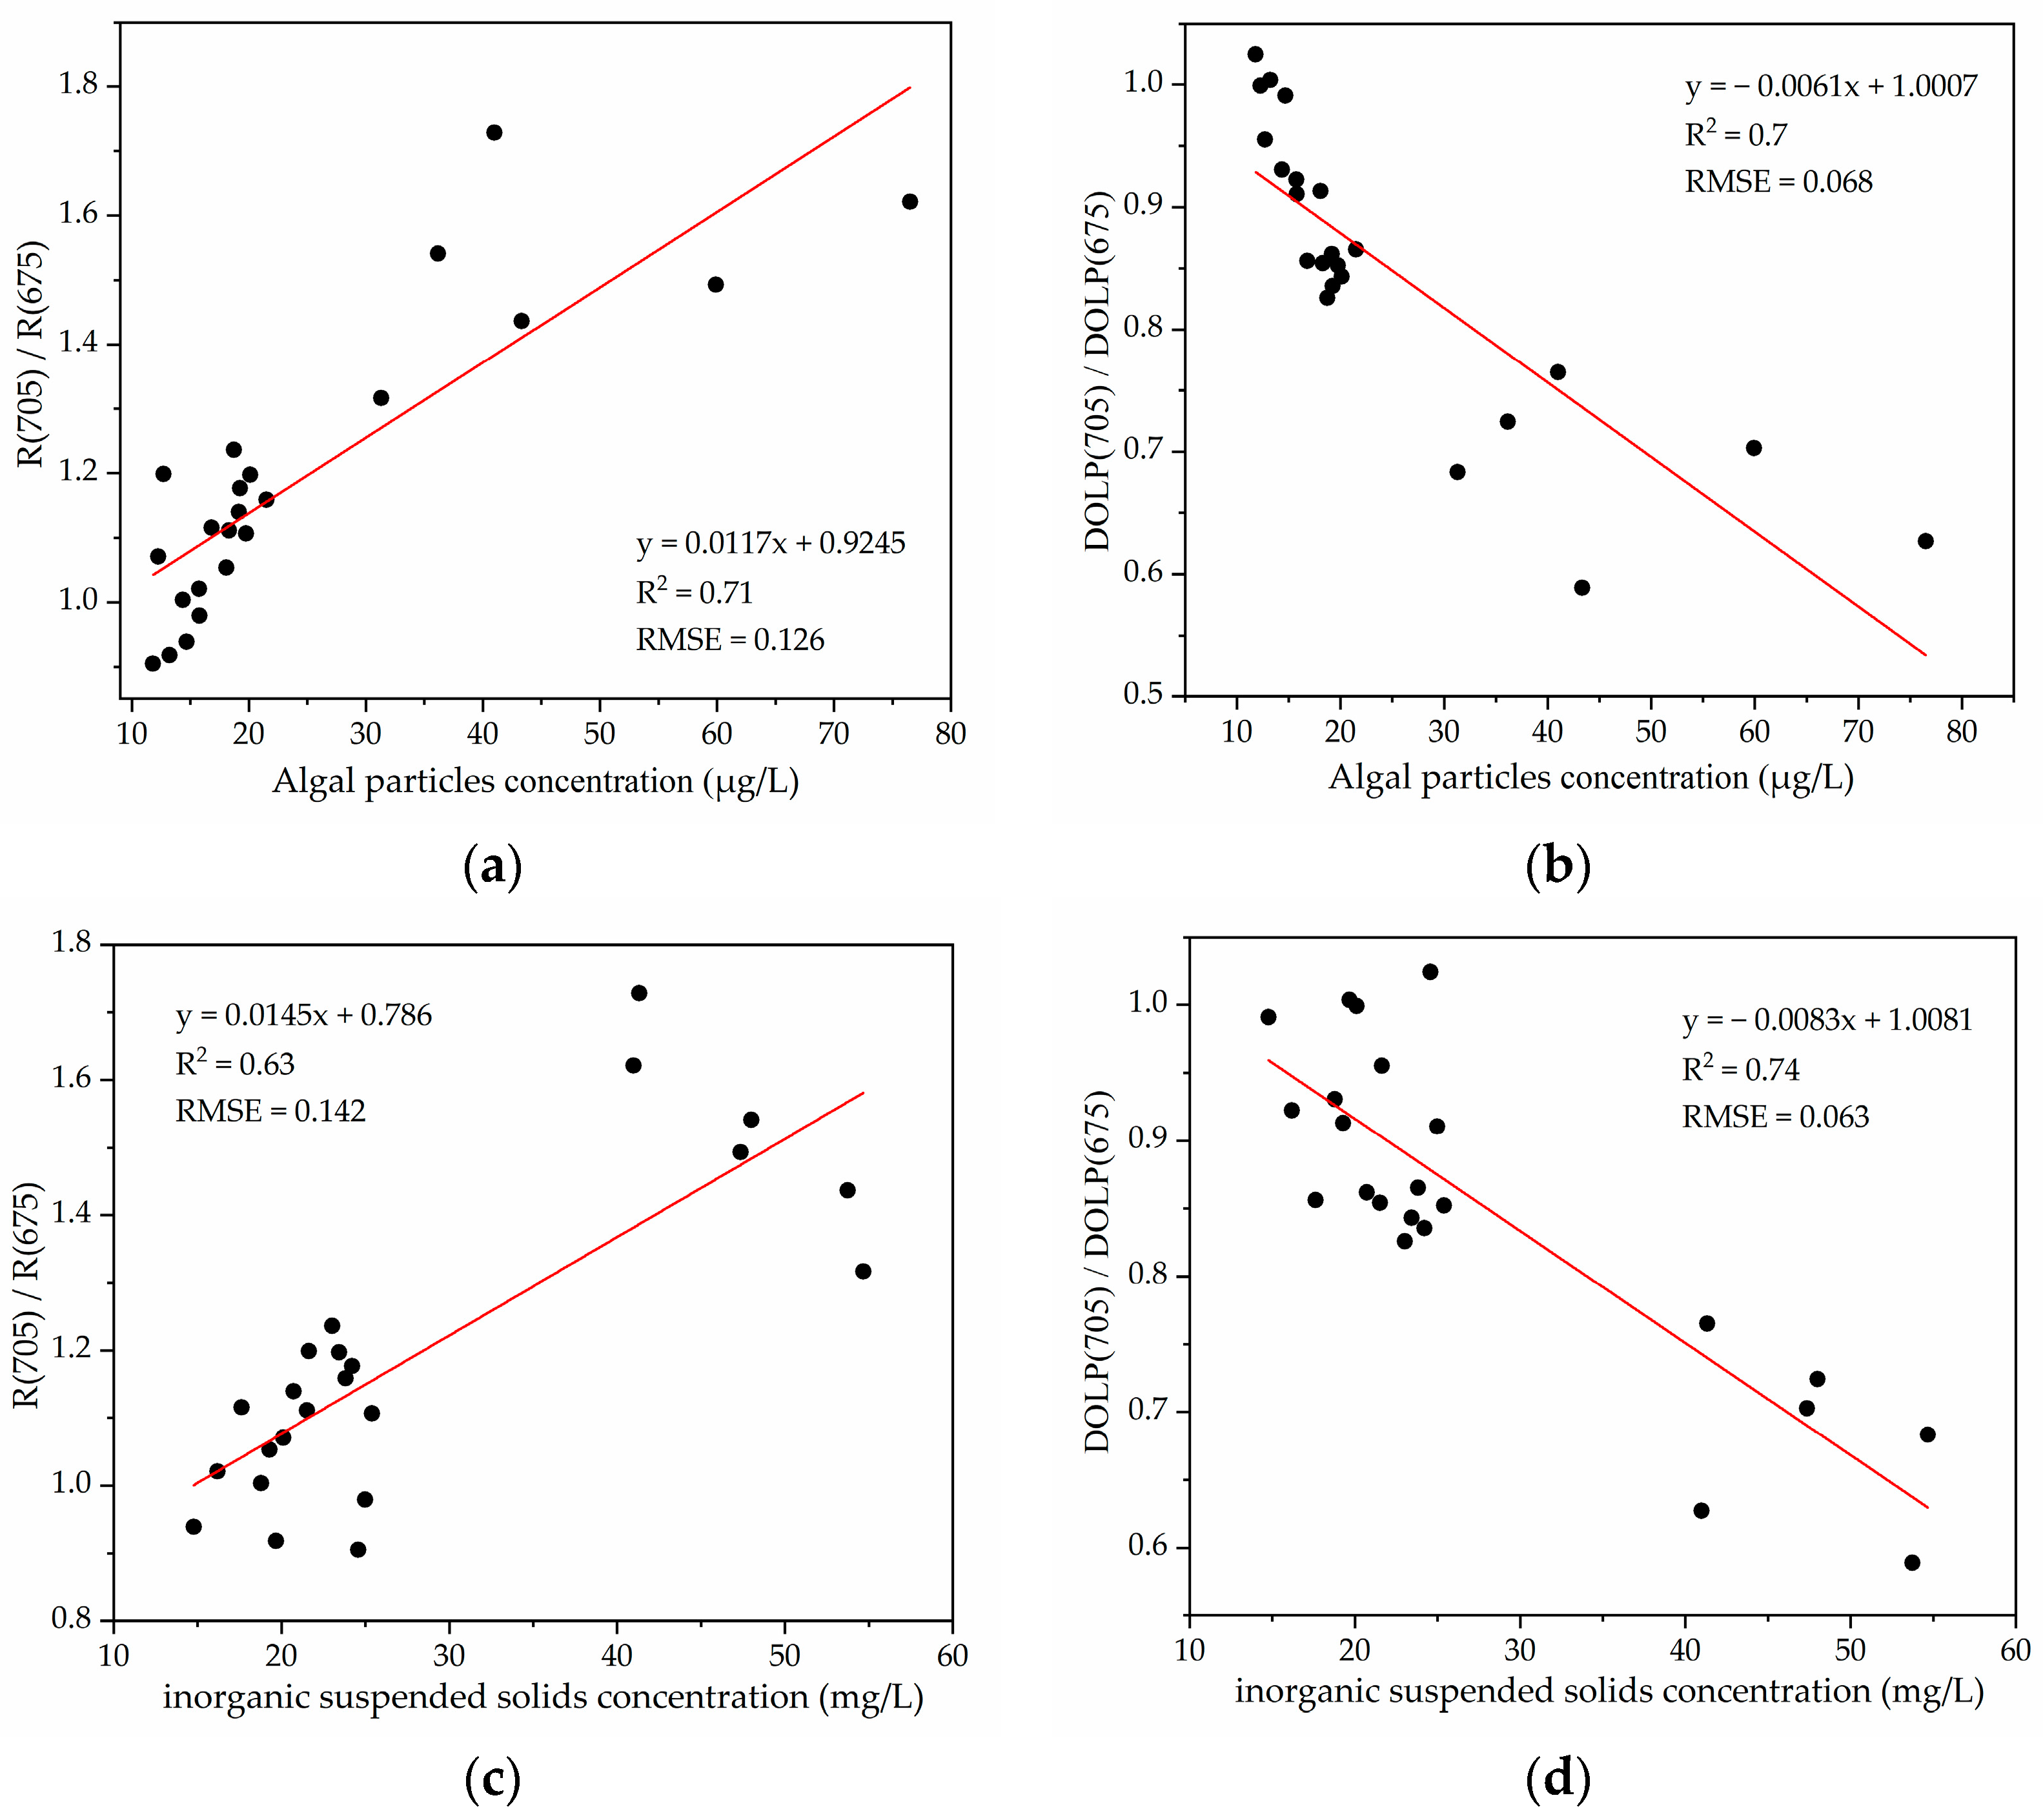
Figure 7 showed that for the ratio at the 675 and 705 nm bands, the reflectance showed a positive correlation with the concentration of particulate matter in water, but DOLP was just the opposite. In the low concentration region of algal particles and inorganic suspended solids, the coupling between a small number of particles in the surface layer of water had little effect on the spectral ratio of reflectance and DOLP, but in the high concentration region of them, the scattering effect of particles was dominant and the effect was very significant with the increase of particle concentration. Due to the interaction of particles on the spectra of the water-leaving radiation, these led to the low correlation between them in the high concentration region and it was often difficult to establish an effective high-precision prediction model.
However, the DOLP ratio spectrum showed unique characteristics in distinguishing inorganic particles from algae particles. As shown in Figure 7c,d, the correlation between DOLP ratio and the concentration of inorganic particles was better than that of reflectance ratio with R2 0.74, RMSE 0.063, but the correlation between DOLP ratio and the concentration of algae particles was almost the same in Figure 7a,b. For algae particles, because chlorophyl-a fluorescence in algae cells was excited at 705 nm, the fluorescence was obviously unpolarized. For inorganic suspended solids, the single scattering in the low concentration and the multiple scattering in the high concentration both had a strong correlation with their concentration. This indicates that DOLP is more sensitive to inorganic particle scattering than inelastic algae particle scattering, and it is helpful to improve the precision of the model [41].
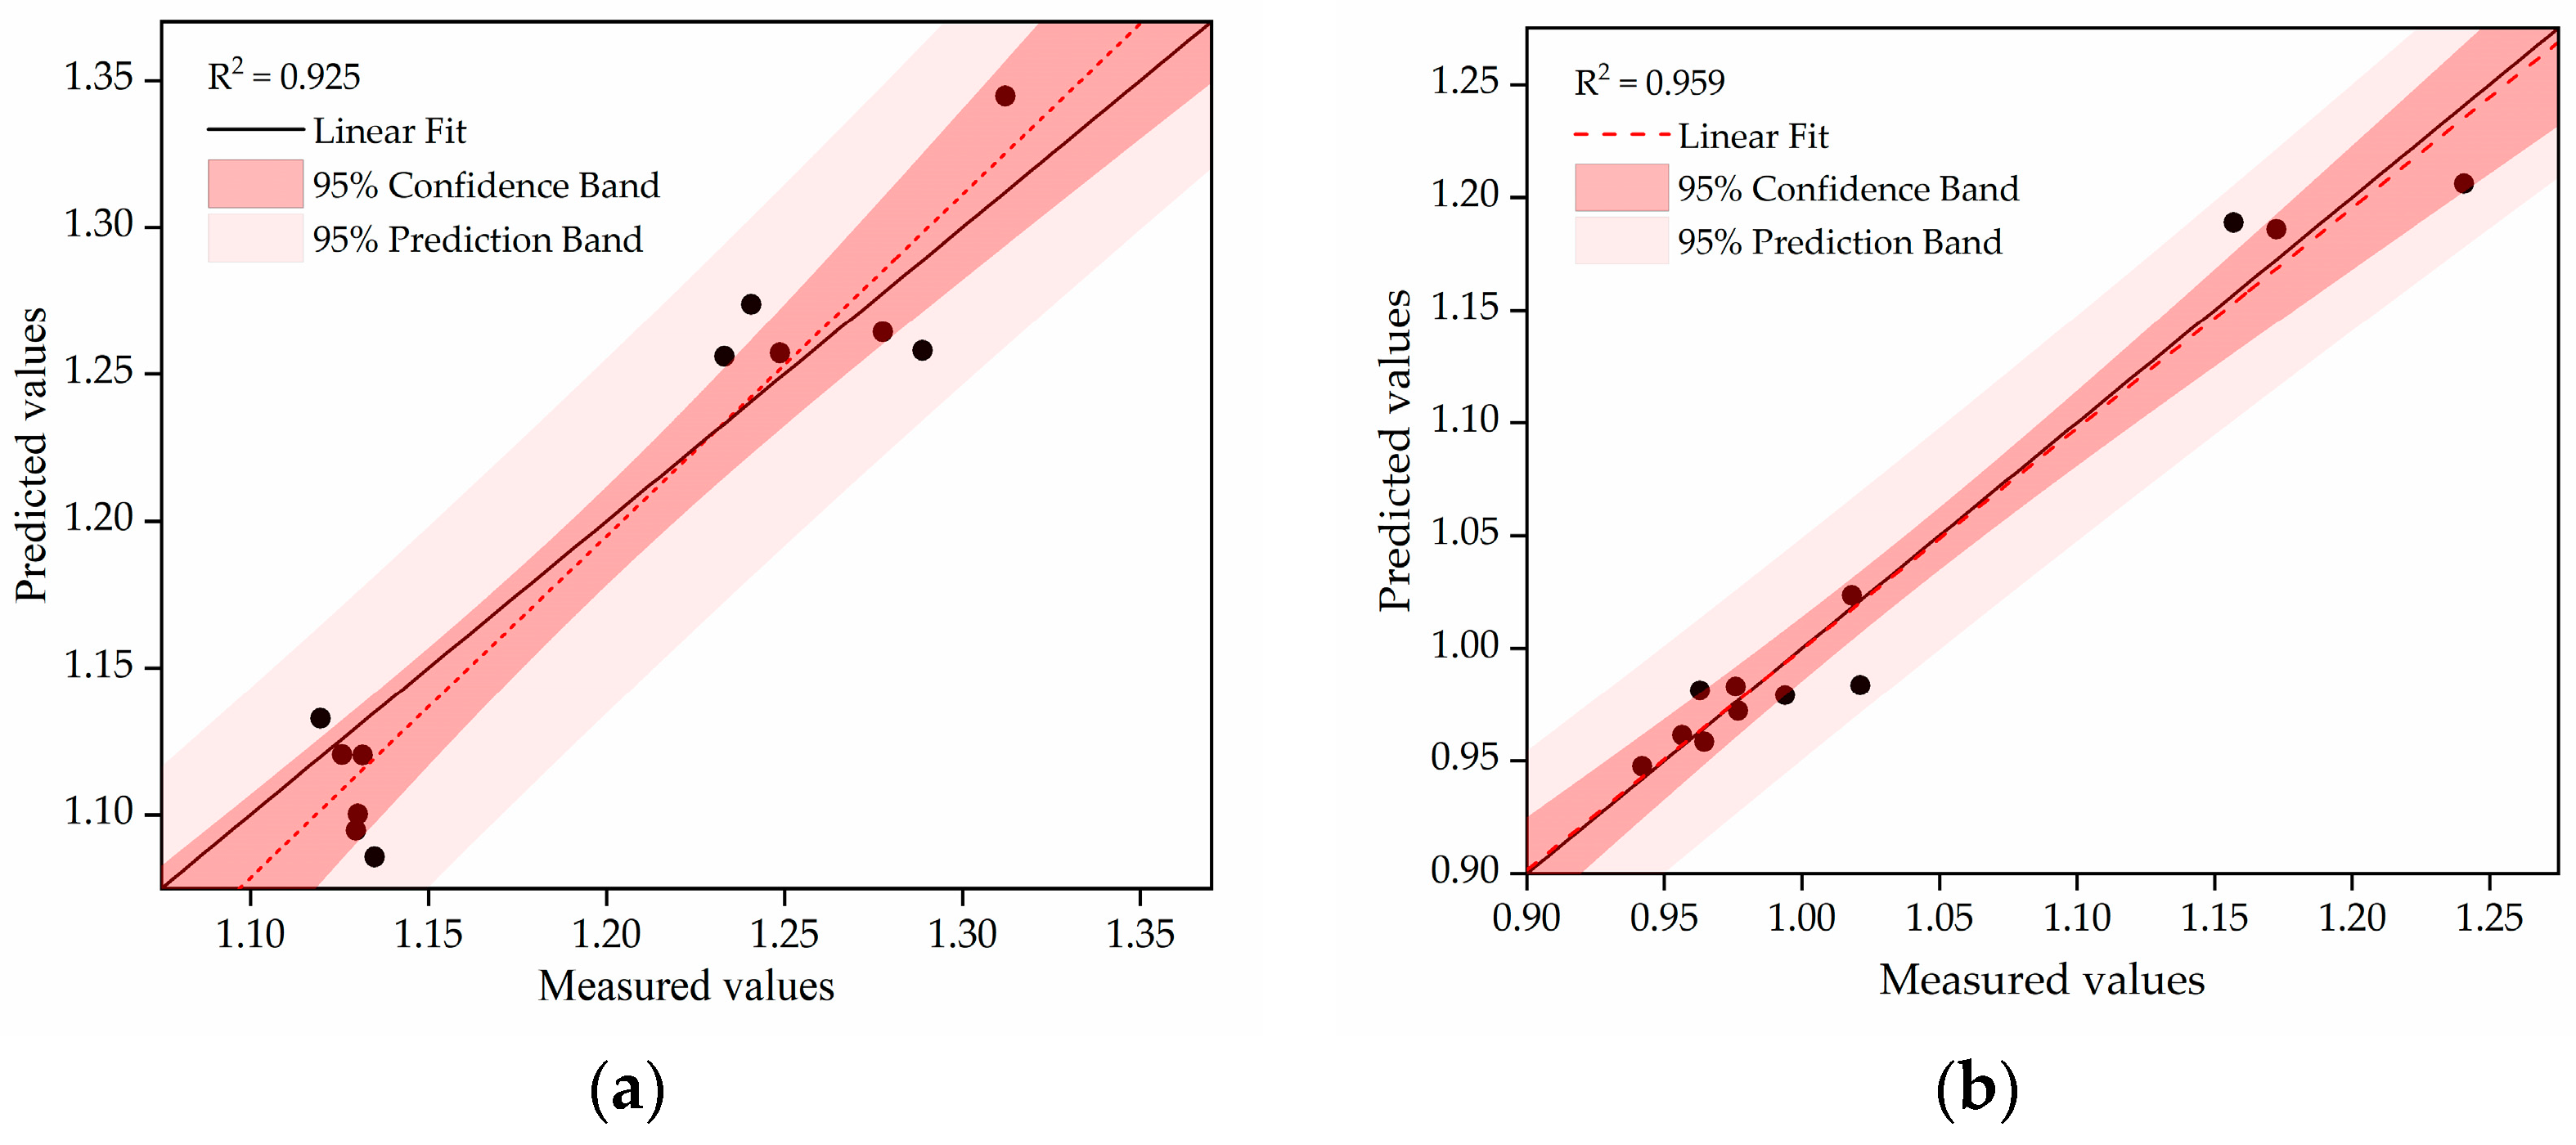
Considering that the spectral band characteristics of water particles were the coupling result of the interaction of optically active particles in water, the coupling model of algae particles and inorganic particles was established to improve the accuracy of model prediction. The concentration of particles could be taken as independent variables (Cchl-a, CTSS), and the reflectance and DOLP could be taken as dependent variables (y). Accordingly, PLSR on multiple regression analysis was generated, and the fitting results were shown in Table 3. Compared to Table 2, the coupled model of DOLP had a good significant level with R2 0.91, RMSE 0.035, 9.6% higher than that of reflectance, 22.9% higher than that of the single component optimal model, and RMSE 63.5% and 44.4% higher.
Using the 12 test samples, the model is tested, and the relationship between the predicted value and the measured value is calculated on the reflectance, DOLP, and the measured value, as shown in Figure 8. The prediction confidence of the two methods is within 95%, the R2 of the reflectance and DOLP is 0.925 and 0.959. Therefore, the coupling model of two types of particles significantly improved the prediction ability of the model [42].
4. Conclusions
To solve the problem of low accuracy of the model caused by the coupling of spectral signals of optically active substances in class II water, polarization hyperspectral technology was used to study the polarized characteristics and construction of the coupling model of algae particles and inorganic suspended solids in water. The conclusions are as follows.
The DOLP was more sensitive to the water-leaving radiance signal of particles than the reflectance with the characteristics of spectral and angle variation in the surface layer of water. The characteristic bands of the polarized spectra were near 570, 675, and 705 nm for algae particles and inorganic suspended solids in Chaohu Lake. In the meridian plane with an azimuth angle of 0°, sensor zenith angle of 53°, DOLP was larger than that of the other directions, and the polarizer effectively suppressed the influence of solar flare.
Owing to the interaction of optically active particles in water, the spectral characteristics of algae particles and inorganic suspended solids were the result of coupling between particles. The DOLP decreased with increasing concentration of particles, and the reflectance had the opposite trend.
For the spectral signal and angle information, the model of DOLP ratio at 675 and 705 nm were established by PLSR. In the high concentration region, the coupling effects of algae particles and inorganic suspended solids led to the low correlation between them. Taking into account the cross-correlation between particles, the DOLP ratio coupling model showed a good significant level with R2 0.91, RMSE 0.035, and effectively improved the low accuracy of the model in the high concentration region.
The above results showed that the DOLP model had a better prediction ability for the coupling characteristics of the water particle. This is conducive to improve the accuracy of water color remote sensing inversion of class II water and provides a technical means for the future high-precision inversion of polarized water color satellite remote sensing in inland lakes.
Author Contributions
Conceptualization and writing original draft preparation: B.P. and H.C.; methodology, supervision, project administration, funding acquisition, H.Y. and H.X.; field test: Y.T. and Y.S.; data analysis: J.D., H.Y., and H.C.; writing—review and editing supported by B.P. and S.D. All authors have read and agreed to the published version of the manuscript.
Funding
The author gratefully acknowledges the financial support from Anhui Natural Science Research Foundation (2208085US14, 1708085MD90), Anhui University Collaborative Innovation Fund (GXXT-2019-047), Natural Science Foundation of colleges and universities in Anhui Province (KJ2020JD07, KJ2020JD09).
Institutional Review Board Statement
Not applicable.
Informed Consent Statement
Not applicable.
Data Availability Statement
Not applicable.
Conflicts of Interest
The authors declare no conflict of interest.
References
- Bone, S.E.; Steinruck, H.G.; Toney, M.F. Advanced characterization in clean water technologies. Joule 2020, 4, 1637–1659. [Google Scholar] [CrossRef]
- Babichenko, S.; Neyt, X.; Mertikas, S.P.; Bostater, C.R.; Chen, P.; Hao, Z.; Wang, Y.; Zhu, F.; Chen, T.; He, X.; et al. Retrieval of total suspended particulate matter in highly turbid Hangzhou Bay waters based on geostationary ocean color imager. In Proceedings of the Remote Sensing of the Ocean, Sea Ice, Coastal Waters, and Large Water Regions 2017, Warsaw, Poland, 11–12 September 2017. [Google Scholar]
- Collister, B.L.; Zimmerman, R.C.; Sukenik, C.I.; Hill, V.J.; Balch, W.M. Remote sensing of optical characteristics and particle distributions of the upper ocean using shipboard lidar. Remote Sens. Environ. 2018, 215, 85–96. [Google Scholar] [CrossRef]
- Cheng, H.Y.; Chu, J.K.; Zhang, R.; Tian, L.B.; Gui, X.Y. Turbid underwater polarization patterns considering multiple mie scattering of suspended particles. Photogramm. Eng. Remote Sens. 2020, 86, 737–743. [Google Scholar] [CrossRef]
- Mukherjee, L.; Zhai, P.-W.; Gao, M.; Hu, Y.; Franz, B.A.; Werdell, P.J. Neural network reflectance prediction model for both open ocean and coastal waters. Remote Sens. 2020, 12, 1421. [Google Scholar] [CrossRef]
- Rozanov, V.V.; Dinter, T.; Rozanov, A.V.; Wolanin, A.; Bracher, A.; Burrows, J.P. Radiative transfer modeling through terrestrial atmosphere and ocean accounting for inelastic processes: Software package SCIATRAN. J. Quant. Spectrosc. Radiat. Transf. 2017, 194, 65–85. [Google Scholar] [CrossRef]
- Singh, R.K.; Shanmugam, P. A multidisciplinary remote sensing ocean color sensor: Analysis of user needs and recommendations for future developments. IEEE J. Sel. Top. Appl. Earth Observ. Remote Sens. 2016, 9, 5223–5238. [Google Scholar] [CrossRef]
- Stramski, D.; Reynolds, R.A.; Gernez, P.; Rottgers, R.; Wurl, O. Inherent optical properties and particle characteristics of the sea-surface microlayer. Prog. Oceanogr. 2019, 176, 19. [Google Scholar] [CrossRef]
- Stamnes, J.K.L.J.J. Impact of particulate oceanic composition on the radiance and polarization of underwater and backscattered light. Opt. Express 2010, 18, 10432–10445. [Google Scholar] [CrossRef]
- Harmel, T.; Gilerson, A.; Tonizzo, A.; Chowdhary, J.; Weidemann, A.; Arnone, R.; Ahmed, S. Polarization impacts on the water-leaving radiance retrieval from above-water radiometric measurements. Appl. Opt. 2012, 51, 8324–8340. [Google Scholar] [CrossRef]
- Freda, W.; Haule, K.; Sagan, S. On the role of the seawater absorption-to-attenuation ratio in the radiance polarization above the southern Baltic surface. Ocean Sci. 2019, 15, 745–759. [Google Scholar] [CrossRef]
- Cao, H.; Han, L.; Zhang, Q.; Li, L. Influence of different linear polarized light on the measurement of water absorption coefficient: A case study in Qujiang Lake, China. Appl. Opt. 2021, 60, 526–532. [Google Scholar] [CrossRef] [PubMed]
- Liu, J.; Hu, B.; He, X.; Bai, Y.; Tian, L.; Chen, T.; Wang, Y.; Pan, D. Importance of the parallel polarization radiance for estimating inorganic particle concentrations in turbid waters based on radiative transfer simulations. Int. J. Remote Sens. 2020, 41, 4923–4946. [Google Scholar] [CrossRef]
- Liu, J.; Liu, J.; He, X.; Tian, L.; Bai, Y.; Chen, T.; Wang, Y.; Zhu, F.; Pan, D. Retrieval of marine inorganic particle concentrations in turbid waters using polarization signals. Int. J. Remote Sens. 2019, 41, 4901–4922. [Google Scholar] [CrossRef]
- Liao, R.W.; Guo, W.; Zeng, N.; Guo, J.; He, Y.H.; Di, H.G.; Hua, D.X.; Ma, H. Polarization measurements and evaluation based on multidimensional polarization indices applied in analyzing atmospheric particulates. Appl. Sci. 2021, 11, 5992. [Google Scholar] [CrossRef]
- Svensen, O.; Stamnes, J.J.; Kildemo, M.; Aas, L.M.S.; Erga, S.R.; Frette, O. Mueller matrix measurements of algae with different shape and size distributions. Appl. Opt. 2011, 50, 5149–5157. [Google Scholar] [CrossRef]
- Liu, Z.; Liao, R.; Ma, H.; Li, J.; Leung, P.T.Y.; Yan, M.; Gu, J. Classification of marine microalgae using low-resolution Mueller matrix images and convolutional neural network. Appl. Opt. 2020, 59, 9698–9709. [Google Scholar] [CrossRef]
- Wang, H.; Li, J.; Liao, R.; Tao, Y.; Peng, L.; Li, H.; Deng, H.; Ma, H. Early warning of cyanobacterial blooms based on polarized light scattering powered by machine learning. Measurement 2021, 184, 109902. [Google Scholar] [CrossRef]
- Zhu, J.; Wang, X.H.; Pan, B.L. Study on Polarization Spectral Feature of Suspended Sediment in the Water Body. Spectrosc. Spectr. Anal. 2012, 32, 1913–1917. [Google Scholar] [CrossRef]
- Zhuo, Z.; Wang, H.; Liao, R.; Ma, H. Machine learning powered microalgae classification by use of polarized light scattering data. Appl. Sci. 2022, 12, 3422. [Google Scholar] [CrossRef]
- Koestner, D.; Stramski, D.; Reynolds, R.A. Characterization of suspended particulate matter in contrasting coastal marine environments with angle-resolved polarized light scattering measurements. Appl. Opt. 2021, 60, 11161–11179. [Google Scholar] [CrossRef]
- Liu, J.; Gong, F.; He, X.Q.; Zhu, Q.K.; Huang, H.Q. Impact of light polarization on the measurement of water particulate backscattering coefficient. Spectrosc. Spectr. Anal. 2016, 36, 31–37. [Google Scholar] [CrossRef]
- Liu, Z.; Liao, R.; Wan, J.; Ma, H.; Leung, P.T.Y.; Yan, M.; Wai, T.-C.; Gu, J. Polarization staining and high-throughput detection of marine microalgae using single cell average Mueller matrices. Optik 2019, 180, 84–90. [Google Scholar] [CrossRef]
- Wu, T.X.; Yan, L.; Xiang, Y.; Zhao, Y.S.; Chen, W. The multi-angle polarization spectral character of water and its applications in water color remote sensing. Spectrosc. Spectr. Anal. 2010, 30, 448–452. [Google Scholar] [CrossRef]
- Tzabari, M.; Lin, W.; Lerner, A.; Iluz, D.; Haspel, C. Sensitivity study on the contribution of scattering by randomly oriented nonspherical hydrosols to linear polarization in clear to semi-turbid shallow waters. Appl. Opt. 2019, 58, 7258–7279. [Google Scholar] [CrossRef]
- Tzabari, M.; Mayron, D.M.; Iluz, D.; Dubinsky, Z.; Haspel, C. Linear polarization characteristics within the Rosh HaNikra Mid-Littora cave, Israel. Front. Mar. Sci. 2018, 5, 13. [Google Scholar] [CrossRef]
- Pang, H.F.; Wang, L.; Jiang, L.L.; Chen, Y.L.; Wang, B.Q.; Xiong, D.Q. Separation of chlorophyll fluorescence from scattering light of algal water based on the polarization technique. Spectrosc. Spectr. Anal. 2017, 37, 486–490. [Google Scholar] [CrossRef]
- Lerner, A.; Shashar, N.; Haspel, C. Sensitivity study on the effects of hydrosol size and composition on linear polarization in absorbing and nonabsorbing clear and semi-turbid waters. J. Opt. Soc. Am. A Opt. Image Sci. Vis. 2012, 29, 2394–2405. [Google Scholar] [CrossRef]
- Ibrahim, A.; Gilerson, A.; Harmel, T.; Tonizzo, A.; Chowdhary, J.; Ahmed, S. The relationship between upwelling underwater polarization and attenuation/absorption ratio. Opt. Express 2012, 20, 25662–25680. [Google Scholar] [CrossRef]
- Wang, L.; Qiu, Z.F.; Pang, H.F.; Liu, Y.J.; Chen, Y.L.; Jiang, L.L. Chlorophyll fluorescence extraction from water-leaving radiance of algae-containing water through polarization. J. Ocean. Univ. China 2017, 16, 1003–1008. [Google Scholar] [CrossRef]
- Liu, F.; Han, P.L.; Wei, Y.; Yang, K.; Huang, S.Z.; Li, X.; Zhang, G.; Bai, L.; Shao, X.P. Deeply seeing through highly turbid water by active polarization imaging. Opt. Lett. 2018, 43, 4903–4906. [Google Scholar] [CrossRef]
- Liu, J.; He, X.; Liu, J.; Bai, Y.; Wang, D.; Chen, T.; Wang, Y.; Zhu, F. Polarization-based enhancement of ocean color signal for estimating suspended particulate matter: Radiative transfer simulations and laboratory measurements. Opt. Express 2017, 25, A323–A337. [Google Scholar] [CrossRef] [PubMed]
- Lucht, W.; Schaaf, C.B.; Strahler, A.H. An algorithm for the retrieval of albedo from space using semiempirical BRDF models. IEEE Trans. Geosci. Remote Sens. 2000, 38, 977–998. [Google Scholar] [CrossRef]
- Yang, M.; Xu, W.B.; Li, J.W.; Zhou, Z.Y.; Lu, Y. Measurement and modeling of polarized reflectance factor on rough coating materials using a goniometer instrument. Optik 2019, 182, 766–773. [Google Scholar] [CrossRef]
- Gleason, A.; Voss, K.; Gordon, H.; Twardowski, M.; Berthon, J.-F. Measuring and modeling the polarized upwelling radiance distribution in clear and coastal waters. Appl. Sci. 2018, 8, 2683. [Google Scholar] [CrossRef]
- Cheng, H.Y.; Chu, J.K.; Zhang, R.; Tian, L.B.; Gui, X.Y. Underwater polarization patterns considering single Rayleigh scattering of water molecules. Int. J. Remote Sens. 2020, 41, 4947–4962. [Google Scholar] [CrossRef]
- Li, J.J.; Liao, R.; Tao, Y.; Liu, Z.D.; Wang, Y.; Ma, H. Evaluation for gas vesicles of sonicated cyanobacteria using polarized light scattering. Optik 2020, 216, 7. [Google Scholar] [CrossRef]
- Zhai, P.W.; Knobelspiesse, K.; Ibrahim, A.; Franz, B.A.; Hu, Y.; Gao, M.; Frouin, R. Water-leaving contribution to polarized radiation field over ocean. Opt. Express 2017, 25, A689–A708. [Google Scholar] [CrossRef]
- You, Y.; Tonizzo, A.; Gilerson, A.A.; Cummings, M.E.; Brady, P.; Sullivan, J.M.; Twardowski, M.S.; Dierssen, H.M.; Ahmed, S.A.; Kattawar, G.W. Measurements and simulations of polarization states of underwater light in clear oceanic waters. Appl. Opt. 2011, 50, 4873–4893. [Google Scholar] [CrossRef]
- Shashar, N.; Johnsen, S.; Lerner, A.; Sabbah, S.; Chiao, C.C.; Mathger, L.M.; Hanlon, R.T. Underwater linear polarization: Physical limitations to biological functions. Philos. Trans. R. Soc. B Biol. Sci. 2011, 366, 649–654. [Google Scholar] [CrossRef]
- Wang, Y.; Dai, J.; Liao, R.; Zhou, J.; Meng, F.; Yao, Y.; Chen, H.; Tao, Y.; Ma, H. Characterization of physiological states of the suspended marine microalgae using polarized light scattering. Appl. Opt. 2020, 59, 1307–1312. [Google Scholar] [CrossRef]
- Liu, J.; Jia, X.; He, X.; Wang, Y.; Zhu, Q.; Li, H.; Zou, C.; Chen, T.; Feng, X.; Zhang, G.; et al. A new method for direct measurement of polarization characteristics of water-leaving radiation. IEEE Trans. Geosci. Remote Sens. 2022, 60, 1–14. [Google Scholar] [CrossRef]
Figure 1.
(a) Location of study area; (b) sampling points of Chaohu Lake.

Figure 2.
(a) BRDF spectrum measurement system; (b) SVC HR1024; (c) results of the calibration for polarization at 600 nm; (d) geometric coordinate system observed by BRDF.
Figure 2.
(a) BRDF spectrum measurement system; (b) SVC HR1024; (c) results of the calibration for polarization at 600 nm; (d) geometric coordinate system observed by BRDF.

Figure 3.
Reflectance spectra (a) and DOLP (b) of the underwater upwelling radiance dominated by single algae particles; reflectance spectra (c) and DOLP (d) of the underwater upwelling radiance dominated by single inorganic suspended solids.
Figure 3.
Reflectance spectra (a) and DOLP (b) of the underwater upwelling radiance dominated by single algae particles; reflectance spectra (c) and DOLP (d) of the underwater upwelling radiance dominated by single inorganic suspended solids.

Figure 4.
Angular distributions of the underwater upwelling radiance signals at 685 nm with a solar zenith angle of 45°. Concentric circles correspond to the sensor zenith angle, and the plane of the azimuth angle of 0° and 180° is the solar meridian plane. Distribution of reflectance spectrum (a) and DOLP (b) dominated by single algal particles in 2π space; distribution of reflectance spectrum (c) and DOLP (d) dominated by single inorganic suspended solids in 2π space.

Figure 5.
Reflectance spectra (a) and DOLP (b) of laboratory mixed water samples; reflectance spectra (c) and DOLP (d) of natural water samples in the pond.
Figure 5.
Reflectance spectra (a) and DOLP (b) of laboratory mixed water samples; reflectance spectra (c) and DOLP (d) of natural water samples in the pond.

Figure 6.
Reflectance spectra (a) and DOLP (b) of water samples in Chaohu Lake. The curves of different colors represent the measured spectra of the different water samples.
Figure 6.
Reflectance spectra (a) and DOLP (b) of water samples in Chaohu Lake. The curves of different colors represent the measured spectra of the different water samples.

Figure 7.
Analysis of regression between the reflectance (a), DOLP (b), and algae particle concentration, and between the reflectance (c), DOLP (d) and inorganic suspended solid concentration.
Figure 7.
Analysis of regression between the reflectance (a), DOLP (b), and algae particle concentration, and between the reflectance (c), DOLP (d) and inorganic suspended solid concentration.

Figure 8.
Comparison between the measured and predicted values of the reflectance (a) and DOLP (b) coupling model. The black line shows the 1:1 relationship and the red dotted line shows the model trend. The coupling model falls within the largest number of points within the 95% confidence band.
Figure 8.
Comparison between the measured and predicted values of the reflectance (a) and DOLP (b) coupling model. The black line shows the 1:1 relationship and the red dotted line shows the model trend. The coupling model falls within the largest number of points within the 95% confidence band.


Table 1.
Descriptive statistics of the water sample set in Chaohu Lake.
| Sample Set | Number | Algae Particles (μg/L) | Inorganic Suspended Solids (mg/L) | ||||||
|---|---|---|---|---|---|---|---|---|---|
| Min | Max | Mean | Standard Deviation | Min | Max | Mean | Standard Deviation | ||
| Train set | 24 | 11.81 | 76.51 | 24.81 | 16.48 | 14.77 | 54.67 | 28.08 | 12.52 |
| Validation set | 12 | 13.43 | 50.76 | 26.13 | 12.44 | 15.6 | 53.92 | 27.21 | 12.8 |
Table 2.
Analysis of the model on the relationship between particle concentration and the reflectance, DOLP in lake water.
Table 2.
Analysis of the model on the relationship between particle concentration and the reflectance, DOLP in lake water.
| Type | Reflectance | DOLP | ||||
|---|---|---|---|---|---|---|
| Model | R2 | RMSE | Model | R2 | RMSE | |
| Algal particles | R (705)/R (675) = 0.0117Cchl-a + 0.9245 | 0.71 | 0.126 | P (705)/P (675) = −0.0061Cchl-a + 1.0007 | 0.7 | 0.068 |
| Inorganic suspension solids | R (705)/R (675) = 0.0145CTSS + 0.786 | 0.63 | 0.142 | P (705)/P (675) = −0.0083CTSS + 1.0081 | 0.74 | 0.063 |
Table 3.
PLSR coupling model and precision analysis of the relationship between particle concentration and reflectance, DOLP in lake water.
Table 3.
PLSR coupling model and precision analysis of the relationship between particle concentration and reflectance, DOLP in lake water.
| Type | Reflectance | DOLP | ||||||
|---|---|---|---|---|---|---|---|---|
| Model | R2 | RMSE | Verified R2 | Model | R2 | RMSE | Verified R2 | |
| Coupling model | R (570)/R (675) = 0.8116 + 0.0078Cchl-a + 0.0067CTSS | 0.83 | 0.096 | 0.925 | P (570)/P (675) = 1.0716 − 0.0038Cchl-a − 0.0047CTSS | 0.91 | 0.035 | 0.959 |
Disclaimer/Publisher’s Note: The statements, opinions and data contained in all publications are solely those of the individual author(s) and contributor(s) and not of MDPI and/or the editor(s). MDPI and/or the editor(s) disclaim responsibility for any injury to people or property resulting from any ideas, methods, instructions or products referred to in the content. |
© 2023 by the authors. Licensee MDPI, Basel, Switzerland. This article is an open access article distributed under the terms and conditions of the Creative Commons Attribution (CC BY) license (https://creativecommons.org/licenses/by/4.0/).
Share and Cite
MDPI and ACS Style
Pan, B.; Cheng, H.; Du, S.; Yu, H.; Tang, Y.; Shu, Y.; Du, J.; Xie, H. Reflection Spectra Coupling Analysis and Polarized Modeling of Optically Active Particles in Lakes. Water 2023, 15, 1706. https://doi.org/10.3390/w15091706
AMA Style
Pan B, Cheng H, Du S, Yu H, Tang Y, Shu Y, Du J, Xie H. Reflection Spectra Coupling Analysis and Polarized Modeling of Optically Active Particles in Lakes. Water. 2023; 15(9):1706. https://doi.org/10.3390/w15091706
Chicago/Turabian StylePan, Banglong, Hongwei Cheng, Shuhua Du, Hanming Yu, Yi Tang, Ying Shu, Juan Du, and Huaming Xie. 2023. "Reflection Spectra Coupling Analysis and Polarized Modeling of Optically Active Particles in Lakes" Water 15, no. 9: 1706. https://doi.org/10.3390/w15091706
Note that from the first issue of 2016, this journal uses article numbers instead of page numbers. See further details here.