Article

The Use of Mixed Composed Amendments to Improve Soil Water Content and Peach Growth (Prunus persica (L.) Batsch) in a Mediterranean Environment

by
Onofrio Cappelluti
1,†,
Maria Roberta Bruno
2,*,†,
Anna Francesca Modugno
2,
Rossana Monica Ferrara
2,
Liliana Gaeta
2,
Gabriele De Carolis
2 and
Pasquale Campi
2,*
1
Department of Soil, Plant and Food Sciences (Di.S.S.P.A.), University of Bari Aldo Moro, 70125 Bari, Italy
2
Research Centre for Agriculture and Environment, CREA—Council for Agricultural Research and Economics, 70125 Bari, Italy
*
Authors to whom correspondence should be addressed.
These authors contributed equally to this work.
Water 2023, 15(9), 1708; https://doi.org/10.3390/w15091708
Submission received: 22 March 2023 / Revised: 20 April 2023 / Accepted: 25 April 2023 / Published: 27 April 2023
(This article belongs to the Special Issue Agricultural Practices to Improve Irrigation Sustainability)

Abstract

:
Reduction of water availability imposes the agronomic issues of increasing the storage capacity of the soil and improving the use of rainwater or irrigation water. A field experiment in 2021 was conducted in a 5-year-old peach orchard in a Mediterranean environment to study the effect of mixed composed amendments (ACM), applied in different amounts, on the dynamics of soil water status. Water balance was monitored during the peach vegetative reproductive cycle on a daily scale. Three treatments of mixed composed amendments (ACM) were compared: A0, control; A1, with amendment (10 t ha−1); and A2, with half dose of amendment (5 t ha−1). On a seasonal scale, soil water content increased by 27% and 33% in A1 and A2 compared to A0, while relative extractable water varied between 0.41 (A0) and 0.65 (A1 and A2). Both soil water balance indicators show that storage capacity increases with the addition of amendment. Improved soil storage capacity was associated with higher values of stem water potential (throughout the growing season) and stomatal conductance (at the end of the season). Shoot and fruit growth observations were consistent with soil water content dynamics.

1. Introduction

The observed reduction of water availability [1] imposes water saving in every human activity and every production sector. Climate change has led to an increase in temperatures of +1.5 °C [2] and a decrease in total annual rainfall [3,4], with an increase, in general, in the intensity of rainfall events [5]. According to Trenberth [6], the increase in rainfall intensity is mainly caused by air humidity, which affects rain or snow rates, but not the total annual precipitation, at least locally. Very intense but short-lasting rainfall does not allow soils to store water [7], and 40–50% of rainfall [8] is lost through runoff [9]. In areas where rain is the primary source of water, a decrease in soil organic matter (SOM) can negatively impact the effective use of intense limited precipitation, due to a decrease in infiltration and hydraulic conductivity and an increase in runoff and erosion [10].
Extreme precipitation events and an increase in the drought period have occurred in the Mediterranean region in recent decades [11,12,13]. In the Mediterranean region, where rainfall is characterized by scarcity and extreme variability in space and time [14], daily storms of hundreds of millimeters are common [15,16]. Zittis et al. [17] reported that the frequency of extreme rainfall events in the region has increased since the 1980s. Additionally, Tramblay et al. [18] found that drought duration in the Mediterranean has increased by up to 60% over the past century, with the most significant changes occurring in southern Europe and the Middle East. As reported by Rashid, A. and Ryan, J. [19], Mediterranean-type soils typically have a high pH and low organic matter content due to the presence of free CaCO3 [20] and the effect of high air temperature; as a result, nutrients deficiencies are the primary limiting factor for crop production in these kinds of soils, followed by soil water stress. According to Umer et al. [21], calcareous soils dominate in arid and semi-arid regions due to low leaching; they contain excessive amounts of calcium carbonate (CaCO3) that alter soil properties associated with plant growth, such as water-holding capacity and nutrient availability. Soil pH is an important factor that affects plant growth and development, particularly under drought conditions. It influences nutrient availability, soil structure, and microbial activity in the rhizosphere [22]. In alkaline soils, for example, nutrient uptake is hindered due to the formation of insoluble metal hydroxides [23]. Drought stress, on the other hand, can have significant impacts on the physical, chemical, and biological properties of soil. It can alter soil structure, reduce water infiltration, and increase soil compaction [24]. According to Fernàndez et al. [25], agricultural soils in many Mediterranean regions are often subject to severe degradation, which includes a decrease in soil organic matter and an increased risk of erosion and desertification. As SOM decreases, the fertility of the soil negatively impacts its physical, chemical, and biological properties. As a consequence, soil limits its capacity to store water in the soil profile, and agronomy prescribes measures to improve water storage in the soil [10,25]. Several studies [26,27,28,29] have shown how agronomic techniques such as tillage, the use of mulches, and crop residue management can improve soil water storage. Moreover, the addition of organic matter can improve soil structure, water infiltration, and soil porosity [30,31]. Increasing the amount of soil organic matter in the soil can be achieved using organic amendments; in particular, mixed amendment, made from diverse organic materials such as animal manure and plant residues, contributes to the enhancement of soil’s physical, chemical, and biological properties [32], resulting in a crucial input for sustainable agricultural production, promoting long-term soil conservation and restoration [33]. Municipal waste has been used for many years as a soil conditioner for agricultural soils, is an economically attractive alternative to disposal by landfill and/or incineration, and it also constitutes an important organic mass for the formation of stable humus [34] and contributes to the improvement of soil fertility [35]. Several studies [36,37], however, have shown a possible negative impact from the use of organics, causing land and water pollution. As a function of this potential risk of pollution, in Italy, the ACM used in agriculture must comply with the legislation (Legislative Decree n. 75 of 29 April 2010) that regulates its sourcing, production, and application amounts (see Table 2). Indeed, Legislative Decree n. 75/2010 also considers the possible emissions of pollutants on a large scale, attending to the possible negative effects on biodiversity but allowing its use in biological agriculture. The employment of organic amendments could be a farm-scale solution to the problem of soil water storage capacity. This hydrological parameter indicates the capacity of the soil to accumulate water (rain or irrigation water) and then make water available for crops. On a laboratory scale, studies have shown that the capacity of soil to accumulate water is proportional to its organic matter [38,39] content. Moving from the laboratory to the field scale, rather than the intrinsic hydrophilic capacity [40], the benefit of applying organic matter to the soil depends on the ability of organic matter to structure the soil [41], form aggregates [42,43], and, consequently, increase soil porosity [44]. In addition to these effects, which occur as a result of repeated treatments over years, under actual growing conditions, there is a further immediate benefit resulting from the application of amendment to the soil, which reduces water loss through evaporation [45].
To monitor the effect of amendment on SOM and water retention, total organic carbon (TOC) can be taken into account [46,47,48]. Moreover, the effect of amendment supply on soil water status can be evaluated via a simple index of drought stress, the relative extractable soil water (REW), which describes the soil water reserve in terms of relative value, together with plant-based indices, such as stem water potential and stomatal conductance [49,50,51].
Then, the improvement in the nutrient conditions of the soil and the amount of water available due to the employment of organic amendment can enhance the growth of the plants. Even if several studies analyzed the use of soil amendment combined with chemical/organic fertilizer in peach orchards, focusing on its effects on (i) physical, chemical, and biological soil properties [52,53,54]; (ii) carbon dynamics [55]; and (iii) nitrous oxide emission [56], few studies had analyzed the use of soil amendment alone to promote peach tree growth [57].
The hypothesis posed in this study involves adding organic amendments to the soil. Two different quantities of mixed amendment—without adding chemical/organic fertilizers—were employed in a peach orchard located in a Mediterranean area to test (i) the increase of water storage and TOC along the soil profile; and (ii) the improvement of the peach orchard performance.

2. Materials and Methods

2.1. Experimental Site and Crop Management

The study was carried out during the 2021 growing season (May to September) in southern Italy (Rutigliano, lat: 40°59′, long: 17°02′) in an experimental farm of the Council for Agricultural Research and Economics (CREA). The experimental site is under the Mediterranean climate, characterized by warm and dry summers, with minimum and maximum annual air temperatures ranging from 0 to 5 °C and 32 to 43 °C [26], respectively. The annual rainfall is 560 mm [58]. Rains are distributed mainly in autumn and late winter, and they are negligible in the spring–summer period [59]. No significant difference was identified between experimental fields, and the average physicochemical characteristics of soil were reported in Table 1. Soil texture was classified as clay–loam [60].
Observations were carried out on a 5-year-old peach orchard of late ripening cv. Redcall, grown in a traditional pot, and grafted onto rootstock GF677, spaced 5.0 m × 5.0 m, and managed according to standard agricultural practices. Soil water content in volume at the field capacity and the wilting point are 0.36 and 0.22 m3 m−3, respectively (measured in Richards chambers). The soil water reserve was low (70 mm) because the root system did not develop below 0.5 m in this site. At 0.5 m of depth, there is a parent rock that reduces the capacity of the root systems to expand beyond this layer. Water was provided by a drip irrigation system with two drippers per tree and a flow rate of 16 L h−1 per dripper. The scheduling irrigation was performed using the FAO56 approach reported by Allen et al. [61] The required meteorological data were measured by a standard meteorological station near the experimental field. The seasonal irrigation volume of 116 mm was supplied to restore 100% of the crop evapotranspiration. A total of around 20 irrigations were carried out—2 irrigations per week, with an average duration of 4 h per irrigation session. Other agricultural practices, such as weed and pest control, were executed according to the local farmers’ best practices for production.

2.2. Experimental Design

The choice of the soil amendment to be used and the quantities to be administered was made according to the prescriptions of the Legislative Decree n. 75 of 29 April 2010 (Table 2).
Three different amounts of soil amendment (Table 3) (treatments) were applied (ACM, Fertileva srl, Evainfruit: Amendmented Mixed) at the beginning of the vegetative season (12 April 2021) along the rows: no ACM—control (A0); 10 t ha−1 of ACM (A1); and 5 t ha−1 of ACM (A2). Treatments were arranged under a randomized complete block design (RCBD) with three replicates. The ACM was spread and buried manually in the top 10 cm of soil.
To evaluate the effect of the different amounts of ACM on the soil, as well as on the tree performances, within each treatment, three plants, similar in terms of dimensional vigor and health status, were chosen in correspondence with the soil moisture probes.

2.3. Soil Water Monitoring

2.3.1. Soil Water Content

Soil water content (SWC) was measured using capacitive probes (TEROS11, Decagon Devices Inc., Pullman, WA, USA), starting from 1 May 2021. The daily soil water content is determined by measuring the water content by volume using probes connected to a data-logger (TE-CR1000, Campbell, Kenton, NJ, USA), and data were transmitted to a web server via LAN or GSM mode. Data download is available through an online platform to which the data-logger is connected. Soil-specific calibration functions were used to calculate volumetric SWC according to Mastrorilli et al. [62]. Three plants were monitored for each treatment. For each plant, three capacitive probes were installed horizontally in the soil profile and transversely to the row at −0.1, −0.3, and −0.45 m from the soil surface to intercept the dynamics of the SWC below the drip lines. Soil water content was determined daily for the soil profile (0.5 m) by integrating the values measured at each depth [26].

2.3.2. Relative Extractable Soil Water (REW)

Relative extractable soil water (REW) describes the soil water reserve in terms of relative value [63]. REW describes the availability of soil water in the root zone thoroughly, as it is derived from data that are estimated through probes set up in the soil in the root zone. It is most often used as a simple index of drought stress, as the REW can be calculated from the soil water content in the root zone at a given time, as follows:
REW = SWCday − SWCmin/SWCmax − SWCmin.
SWCday is the daily soil water content (m3 m−3), SWCmin (m3 m−3) is the minimum water content detected, while SWCmax (m3 m−3) is the maximum water content consumed by plants throughout the root zone during the irrigation season, or the water field capacity. The REW ranges from 1.0 (maximum soil water content) to 0 (minimum soil water content). Daily REW values for the experiments were calculated from daily SWC measurements.
Because a critical, site-specific value of matrix potential was not available for assessing soil water deficits, it was assumed that water supply stress occurs when REW falls below the threshold of 0.4 (REWc), triggering stomatal regulation [63,64,65]. The REW threshold < 0.4 is commonly used in various ecosystems [66]. In addition, the duration of water supply stress was calculated as the percentage of days in the growing season with a REW less than 0.4.

2.4. Soil Laboratory Measurements

Undisturbed soil cores were collected in 2021 during the entire vegetative period and the plant’s vegetative rest period—4 April, 31 May, 5 July, 13 September, and 8 November—within each experimental treatment in triplicate, and the average value was reported. Soil samples were collected at 0–0.10 m depth. Total organic carbon (TOC) and physical indicators were measured on the soil samples.
TOC was quantified on dried and 2-mm sieved samples, following protocols reported in Ferrara et al. [67,68]. In detail, for TOC quantification, soil samples were ground to a fine powder (0.5 mm) using an agate ball mill. TOC was determined by the TOC Vario Select analyzer (Elementar, Hanau, Germany) [69], which performs catalytic oxidation of the specimen at high temperatures in the presence of air.
Soil physical indicators resulting from bulk density were not statistically different among the treatments.

2.5. Plant Water Monitoring

2.5.1. Stem Water Potentials and Stomatal Conductance

The stem water potential is the ecophysiological parameter that is directly related to the soil water status. Plant water status was characterized for each treatment by stem water potential (Ψst, MPa) and stomal conductance (gs, mmol m−2 s−1), measured at midday since stem water potential and stomatal conductance are more closely correlated with leaf water status at midday [49,50].
Stem water potential was measured using Scholander-type pressure chamber (Soil Moisture Equipment Corp., Santa Barbara, CA, USA) at 12:00 p.m., once or twice a month on six plants per treatment, selecting two leaves per plant [70].
According to Gaeta et al. [51], in a late ripening peach cultivar such as Redcal, only stem water potential is not completely informative of plant water status because of its conservative or iso-hydric behaviour. The stomatal conductance was considered as another plant-based index and was measured using an open-circuit infrared gas analyzer with an LED light source (Li-COR6400XT, LI-COR, Lincoln, NE, USA). For each treatment, well-exposed leaves were selected in three replicates to the east and west sides of the canopy. Light intensity was held constant throughout the three treatments by adjusting the light source LED to the natural irradiance experienced by the leaf immediately before measurement. The values observed on the west and east sides of the canopies were averaged for each plant.

2.5.2. Fruit and Shoots Growth

The fruit growth trend was monitored during the season through a digital gauge implemented with a datalogger capable of memorizing and conserving data (HK-Horticultural Knowledge s.r.l. Bologna, Italy) for twelve fruits per treatment in the triple replication. Fruit volume (V, cm3) and absolute growth rate (AGR, cm3 day−1) were calculated by considering the form of the peach as a spheroid and by measuring the three axes of each peach [26]. Absolute growth rate (AGR, cm3 day−1) was calculated using the following formula:
A G R = V 1 V 0 t 1 t 0
where V1 and V0 are volumes measured at time t1 and t0, respectively.
The mean shoot length was assessed using a meter. For each treatment, two trees were considered on which four shoots were measured along the four cardinal points (N, S, W, E).

2.6. Statistical Analyses

The data were analyzed via a one-way ANOVA (A0, A1, and A2) per season (2021). The differences in each treatment were assessed using Tukey’s honestly significant difference (HSD) test.
To verify the correlations among stem water potential and relative extractable water, stem water potential and stomal conductance, and relative extractable water and stomal conductance, the Pearson correlation coefficient was determined. The confidence limits used in this study were based on 95% (p < 0.05).
The statistical analyses were computed using the statistical software R (R Development Core Team, http://www.r-project.org. accessed 10 March 2023).

3. Results and Discussion

This study, carried out here in a peach cropping system, is a rare example [52] of a field evaluation of the benefits of amendment application to soil water status. The study methodology included three agronomic criteria for evaluating the effects of amendment supply to the soil: soil water status, total organic carbon, vegetation water status and growth analysis of vegetation.

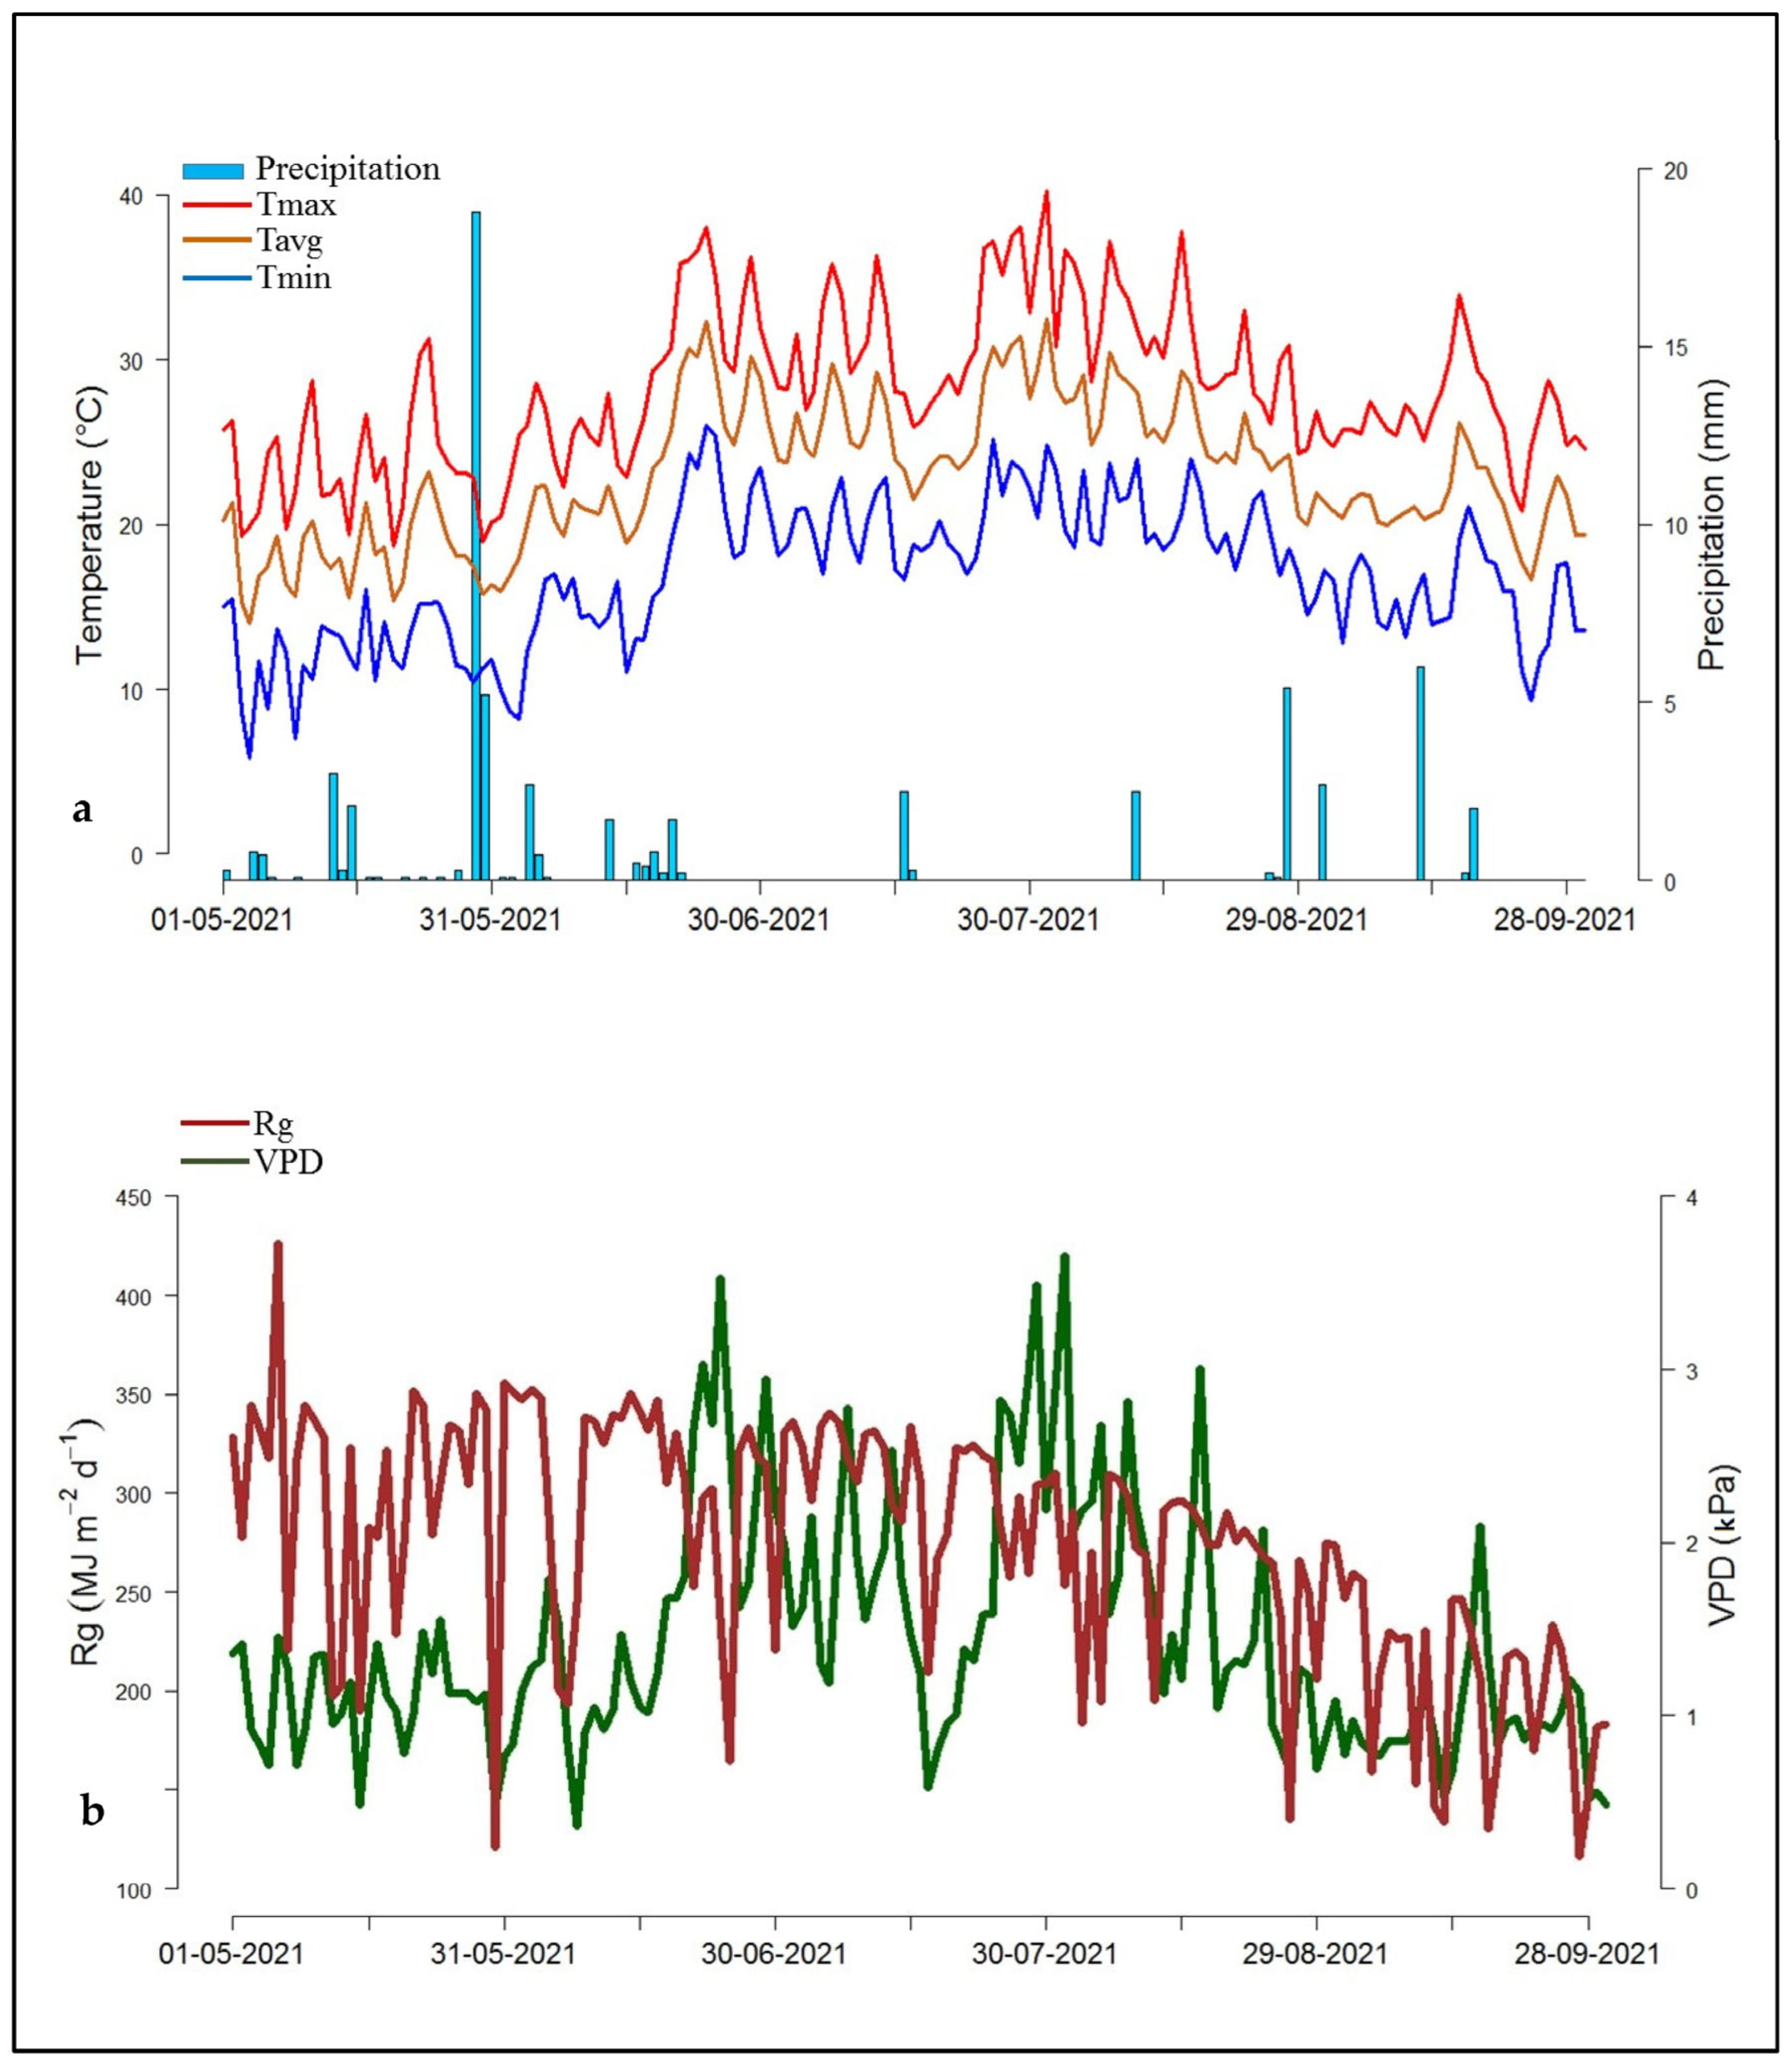
3.1. Weather Conditions

Figure 1a shows the evolution of daily air temperature values (°C) (average, minimum, and maximum) and daily precipitation (mm d−1) during the observation period from bud opening (1 May 2021) to the end of the productive season (30 September 2021).
The average air temperature during the observation period was 23 °C. The minimum temperature fell below 10 °C only five times: at the beginning of the growing season (9 May 2021), during the first stage of the second phase of fruit growing (3 June 2021), and at the end of the vegetative cycle (24 September 2021), which did not affect peach tree productivity. The maximum temperature reached values between 35 and 40 °C several times during the growing season between 20th of June and 20th of August.
The five drops below 10 °C, as mentioned above, did not affect peach tree productivity as they did not result in any significant stress or frost damage [71].
Rainfall recorded during the observation period amounted to 124 mm. The daily values of global radiation (Rg) and vapor pressure deficit (VPD) are shown in Figure 1b. Radiation follows the circadian pattern and decreases in daily values from June to September, with only a few days of cloud cover during the first 20 days of June. The daily mean values of vapor pressure deficit (VPD) during the peach crop cycle ranged from 1 to 1.5 kPa, with higher values occurring regularly between mid-June and the end of August. VPD is a measure of the evaporative demand of the atmosphere and is related to the plant’s ability to transpire water. As VPD increases, it is likely that the plant is more sensitive to water stress, especially during the most important stages of fruiting. Previous studies have shown that high VPD values can negatively impact peach tree growth and fruit quality [72]. Therefore, the observed higher VPD values in this study could have affected the plant’s water use and productivity. Studies conducted on peach trees in similar Mediterranean environments have shown [73,74,75] that peach trees have good resistance to irrigation deficit conditions. This characteristic can be advantageous for saving high-to-moderate irrigation volumes without compromising soil quality and peach orchard performance. According to a study by Rolbiecki et al. [76], it is estimated that due to climate change, there will be an increase in the water requirements by peach trees of about 26%. The irrigation volumes supplied in the peach orchard of this study were able to restore the evapotranspiration of the crop, so the plant was able to avoid water stress, even under high VPD conditions.

3.1.1. Soil Water Content

Figure 2a shows the daily soil water content in the A0, A1, and A2 treatments. A clear difference in SWC between A0 (0.28 m3 m−3) and the two conditioned soils, A1 (0.30 m3 m−3) and A2 (0.30 m3 m−3), at the start of monitoring season (May) is due to the time lapse between the soil amendment spreading (12 April 2021) and the beginning of the monitoring period (1 May 2021). SWC values of the three treatments ranged generally between the wilting point (before irrigation) and field capacity (after irrigation). Irrigation scheduling prevented the soil from exceeding field capacity and never allowed the soil to reach the wilting point, despite a weather pattern leading to high levels of evapotranspiration. The higher the evapotranspiration rate of the atmosphere, the earlier the soil moisture approaches the wilting point. Values of soil water content close to the wilting point were observed only in the case of the A0 treatment (without soil amendment). The value closest to the wilting point was approximately 0.25 m3 m−3 in the A0 treatment at the end of the production cycle, after irrigation was stopped. The behavior of the two treatments that received the amendment (regardless of the amendment amount) differs from the treatment without soil amendment. The seasonal values of soil water content for A1 and A2 are systematically +13.8% and +11.4% higher than in A0, respectively.
Figure 2b summarizes, on a seasonal scale, the mean soil water content for the three treatments, with significant differences between soil with amendment (A1 and A2) and the control (A0). Figure 2b further shows that the variability of soil moisture data during the peach tree growing season is significantly higher in the treatment without soil amendments than in the two treatments that received soil amendments.
It is observed that adding amendment to the soil not only raises the measured soil moisture values but also reduces the fluctuations around the seasonal mean value. This means that where amendment has not been added to the soil, the crop is exposed to potentially dangerous fluctuations in soil moisture during the growing cycle. These moisture variations are reflected in the plant performance, which appears to be more exposed to the risks of water stress.

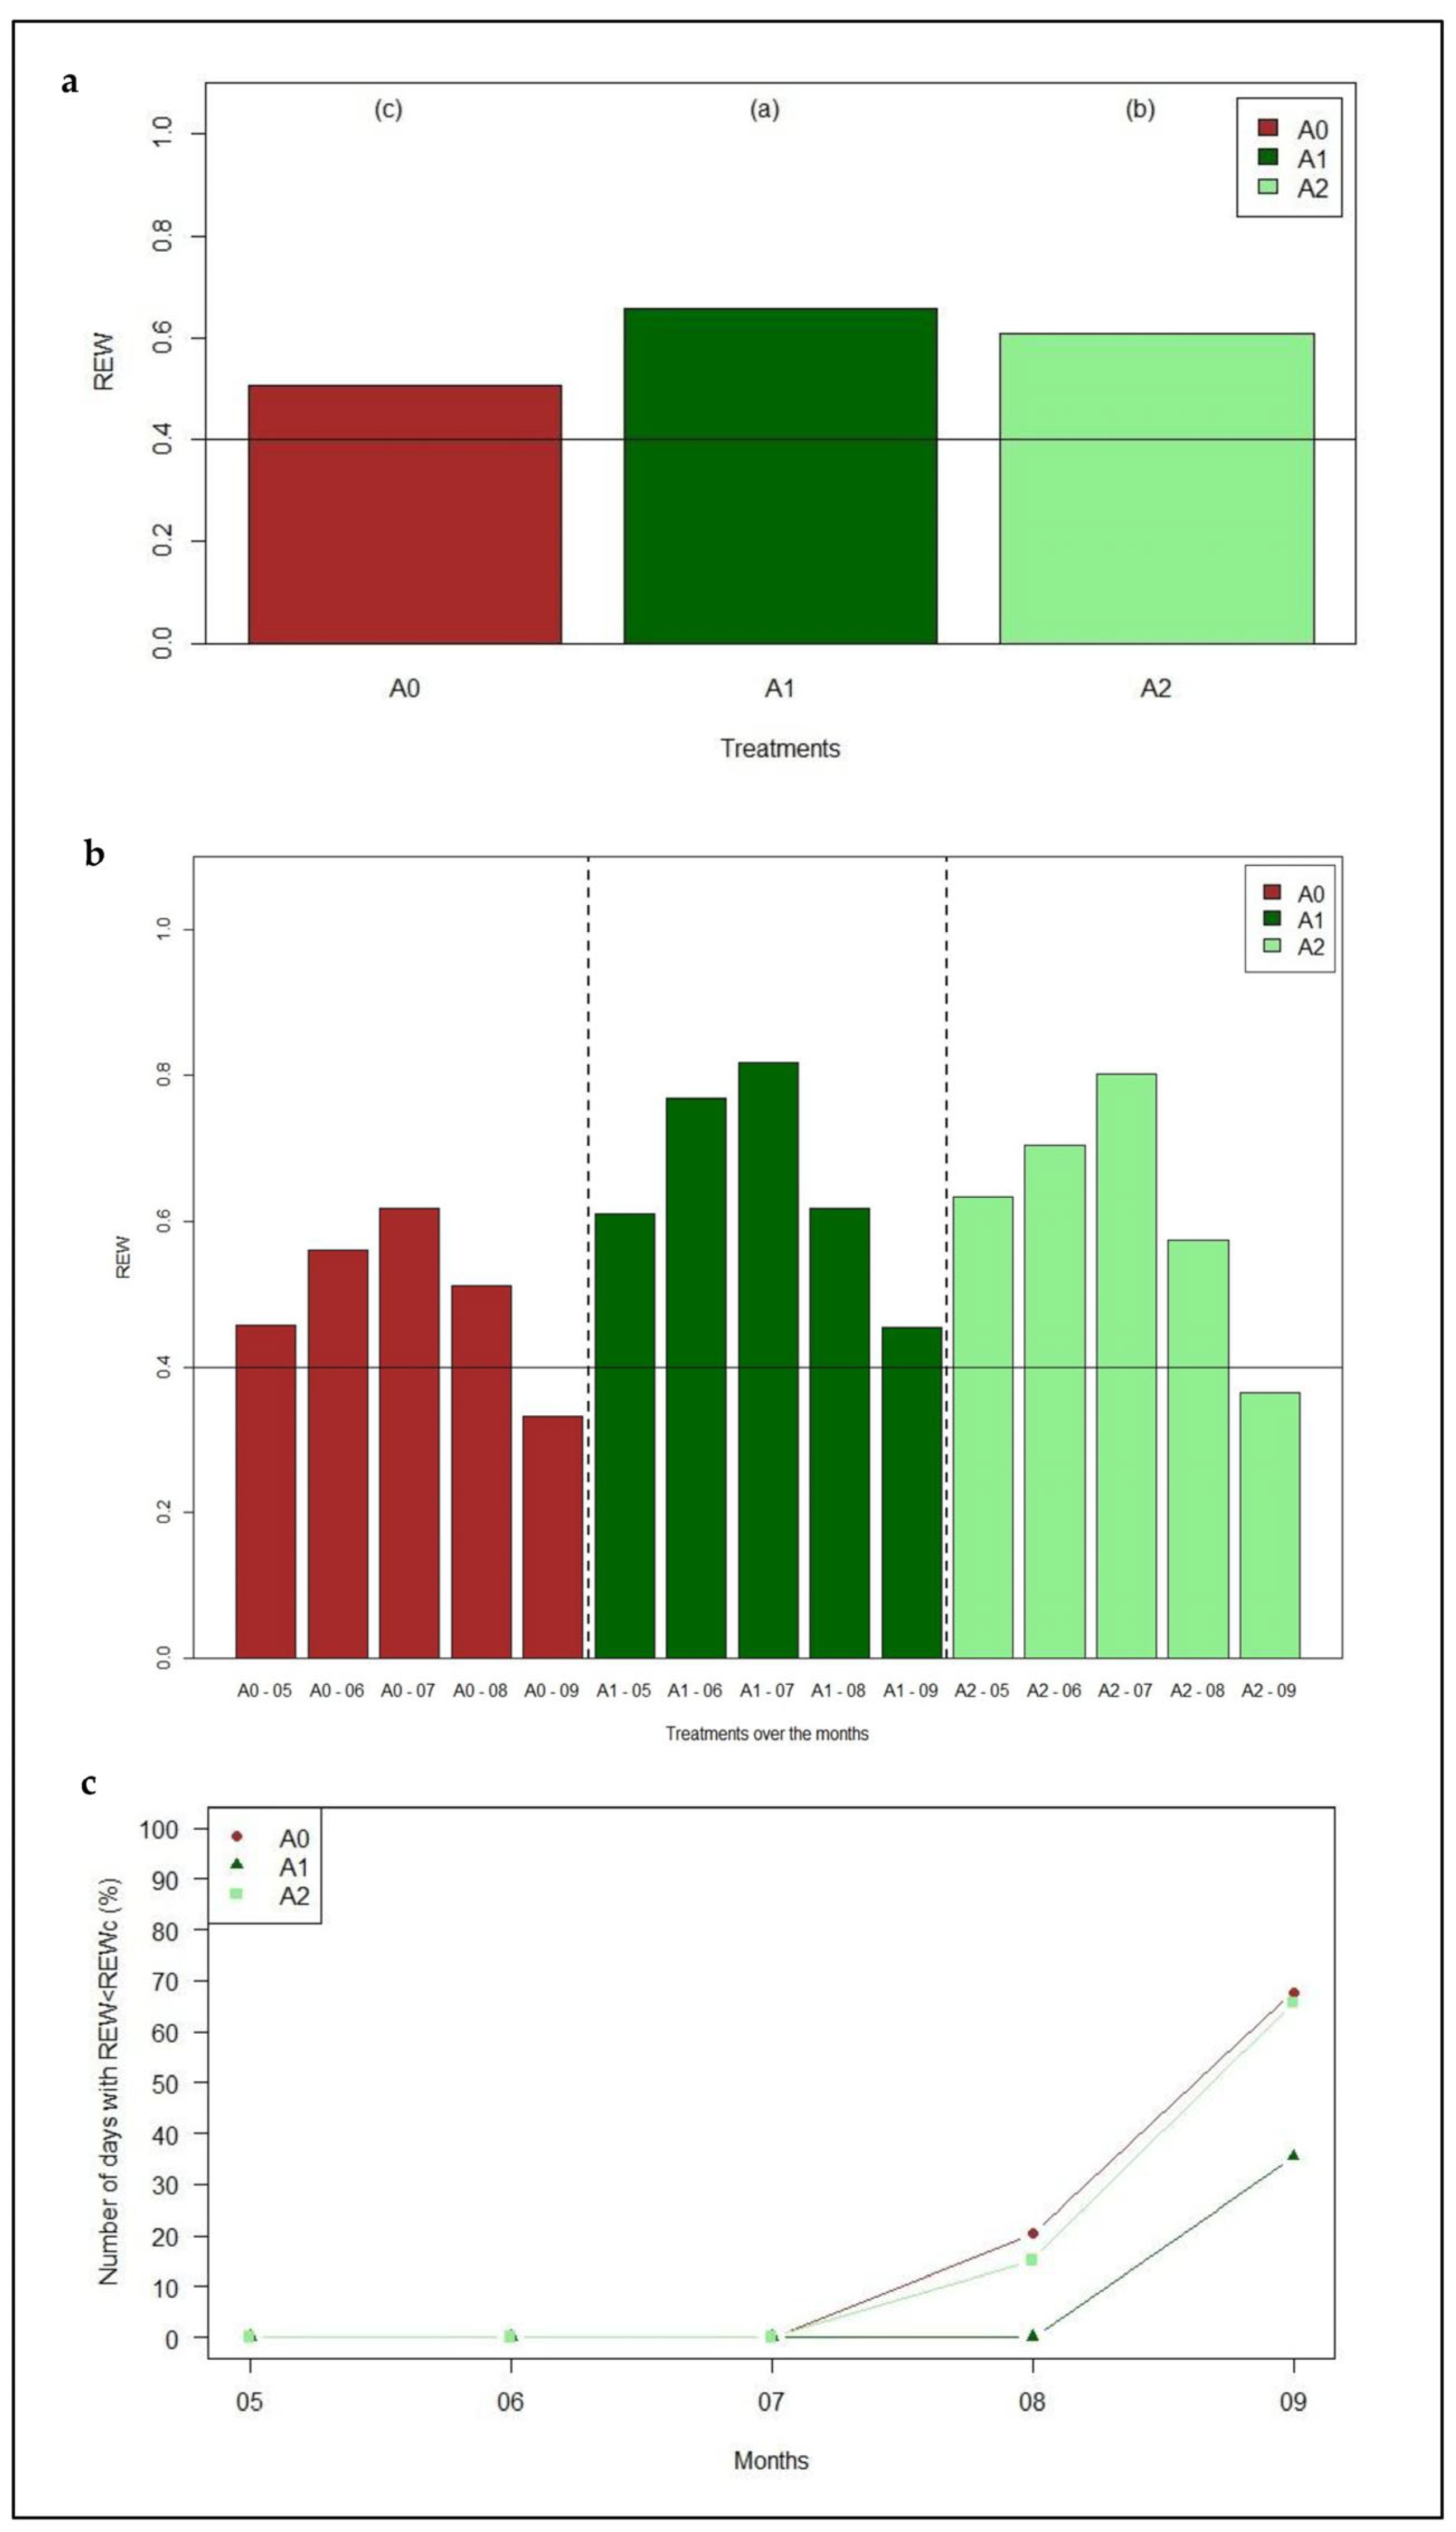
3.1.2. Relative Extractable Water

Considering the threshold of drought stress index is 0.4 [77,78], the seasonal REW values for A0 were close to the threshold (Figure 3a), which could indicate a risk of soil water stress. The two treatments that have benefited from the ACM (either complete dosage, A1; or half dosage, A2) had REW values far from the critical stress threshold during the whole peach tree growing season (see Figure 3a). The statistical analysis (Tukey’s HSD) showed that REW for A1 (0.66) and A2 (0.61) were significantly different from A0 (0.50). At the seasonal level, the mean REW values showed that irrigation planned to avoid any water stress in the soil (irrigation performed by returning 100% of the ET0) was effective and that the use of soil conditioner improved the soil water condition in direct proportion to the quantity.
The analysis of the REW values on a monthly scale (Figure 3b) reveals that the peach tree stand suffers soil water stress (particularly when the regular water supply is interrupted, e.g., in September) if the crop does not benefit from the ACM. The risk of soil stress does not occur when the soil receives a complete dose of soil amendment (A1) and only rises at the end of the cycle, i.e., in September (Figure 3b), in the case of a reduced supply of soil amendment (A2). The monthly analysis of the REW values indicates that soil water stress occurs in September in the treatments that did not receive amendment and in the treatment that had half a dose of amendment.
The average maximum and minimum values of REW were 0.72 and 0.22 for A0, 1.00 and 0.35 for A1, and 1.00 and 0.28 for A2, respectively. In particular, REW for A0 goes below the 0.4 threshold on 20% of the days in August and 68% of the days in September (Figure 3c), according to [47]. The A2 treatment experiences water stress on 16% of the days in August and 67% in September (Figure 3c); and soil water stress did not occur on any day except for in September (35% of the days in the month) in treatment A1. It was possible to better understand the contribution of soil amendment treatments, compared to A0: a full-dose organic matter supply, as in A1, guarantees better soil water retention such that no water stress is generated on any (or almost any) of the days of the season.

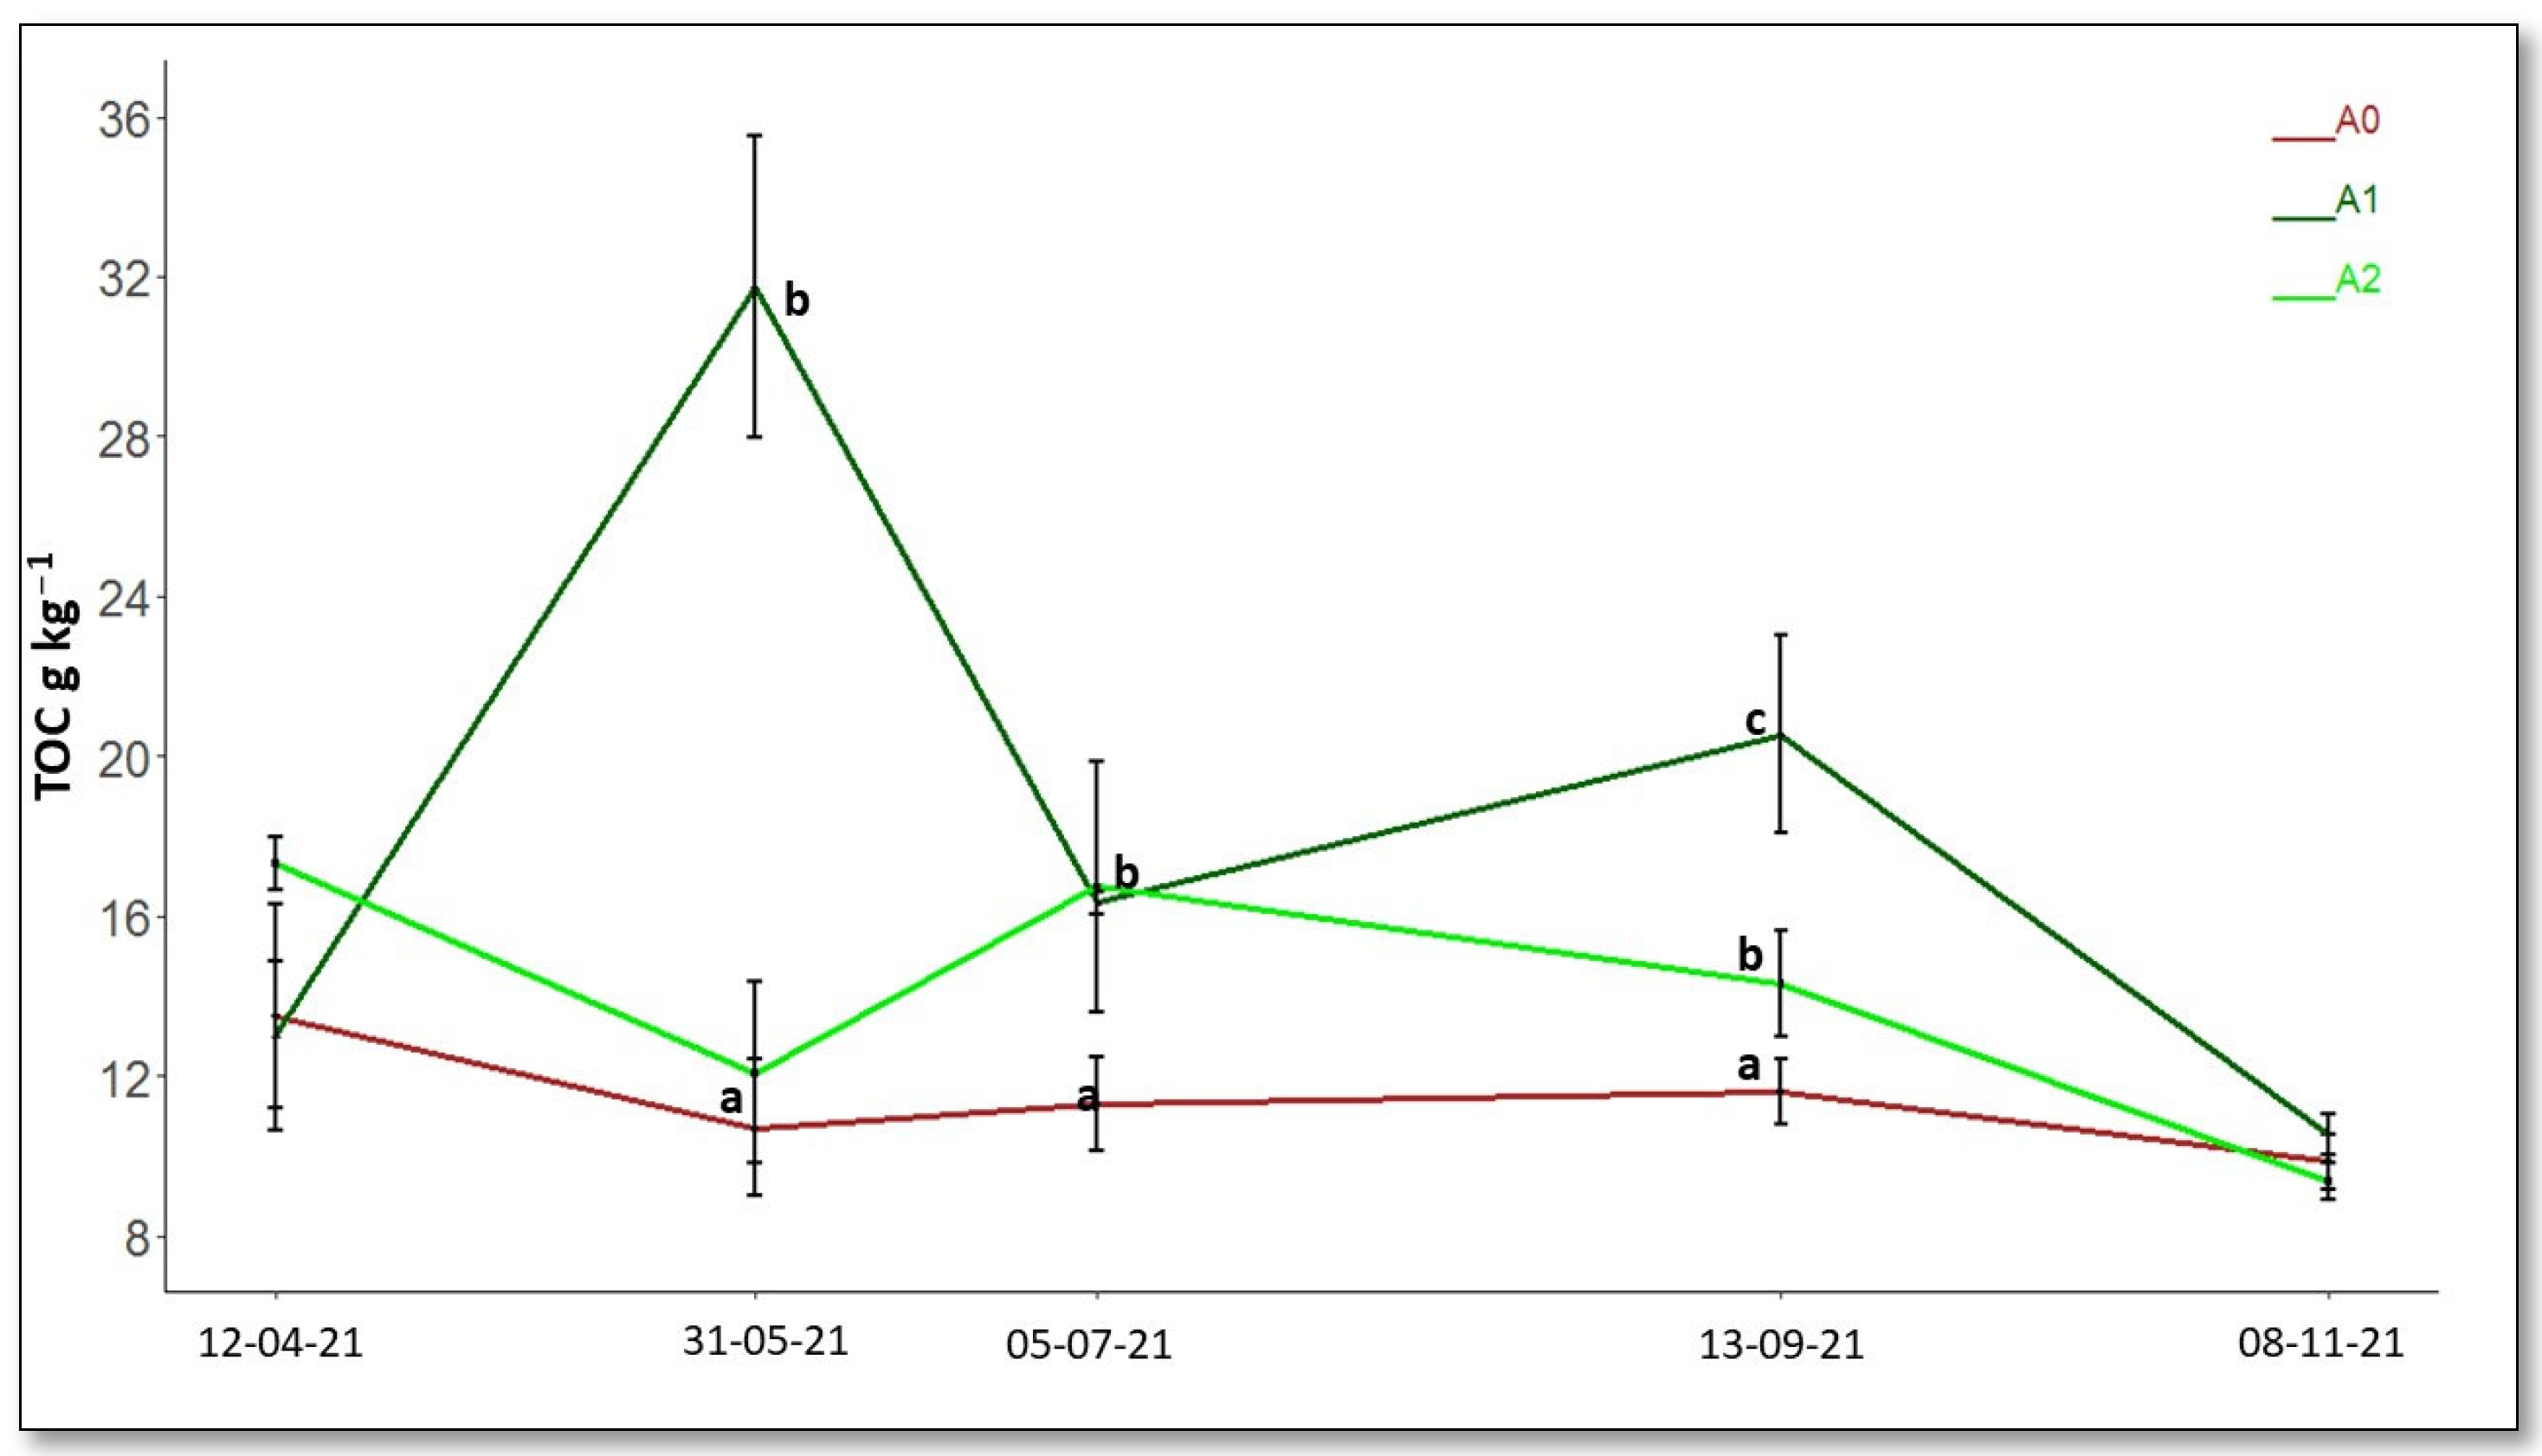
3.2. Total Organic Carbon

The TOC measurements in Figure 4 show how the total amount of organic carbon in the soil varies during the 2021 growing season. At the beginning of the season on 12 April, when the amendment had not been applied, all the samples measured the same amount of TOC in the soil. After amendment supply, the TOC levels in the soil of the three treatments changed considerably, especially in A1, while remaining relatively constant in the control (A0). The trend of TOC in A2, although higher than in A0 throughout the season, always remained lower than the treatment with A1. Note that on the 11th of November, all three treatments showed the same amount of TOC in the soil. The TOC variations measured in different periods, even beyond the growing season, have shown how the amendment increases the total amount of carbon in the soil relative to the greater amount of water in the soil [47]. The peak recorded in A1 on 31 May, as reported by Batiot et al. [79], is probably due to the high amount of rainfall [80], which caused a higher TOC concentration to be recorded. However, the TOC value for A1 showed a downward trend, probably due to lower soil moisture availability [81]. Furthermore, it can be seen that in the last measurement taken in November, the TOC in the three treatments is almost identical, probably also due to the low temperatures, as reported in a study by Lepistö et al. [82].

3.3. Plant Water Monitoring

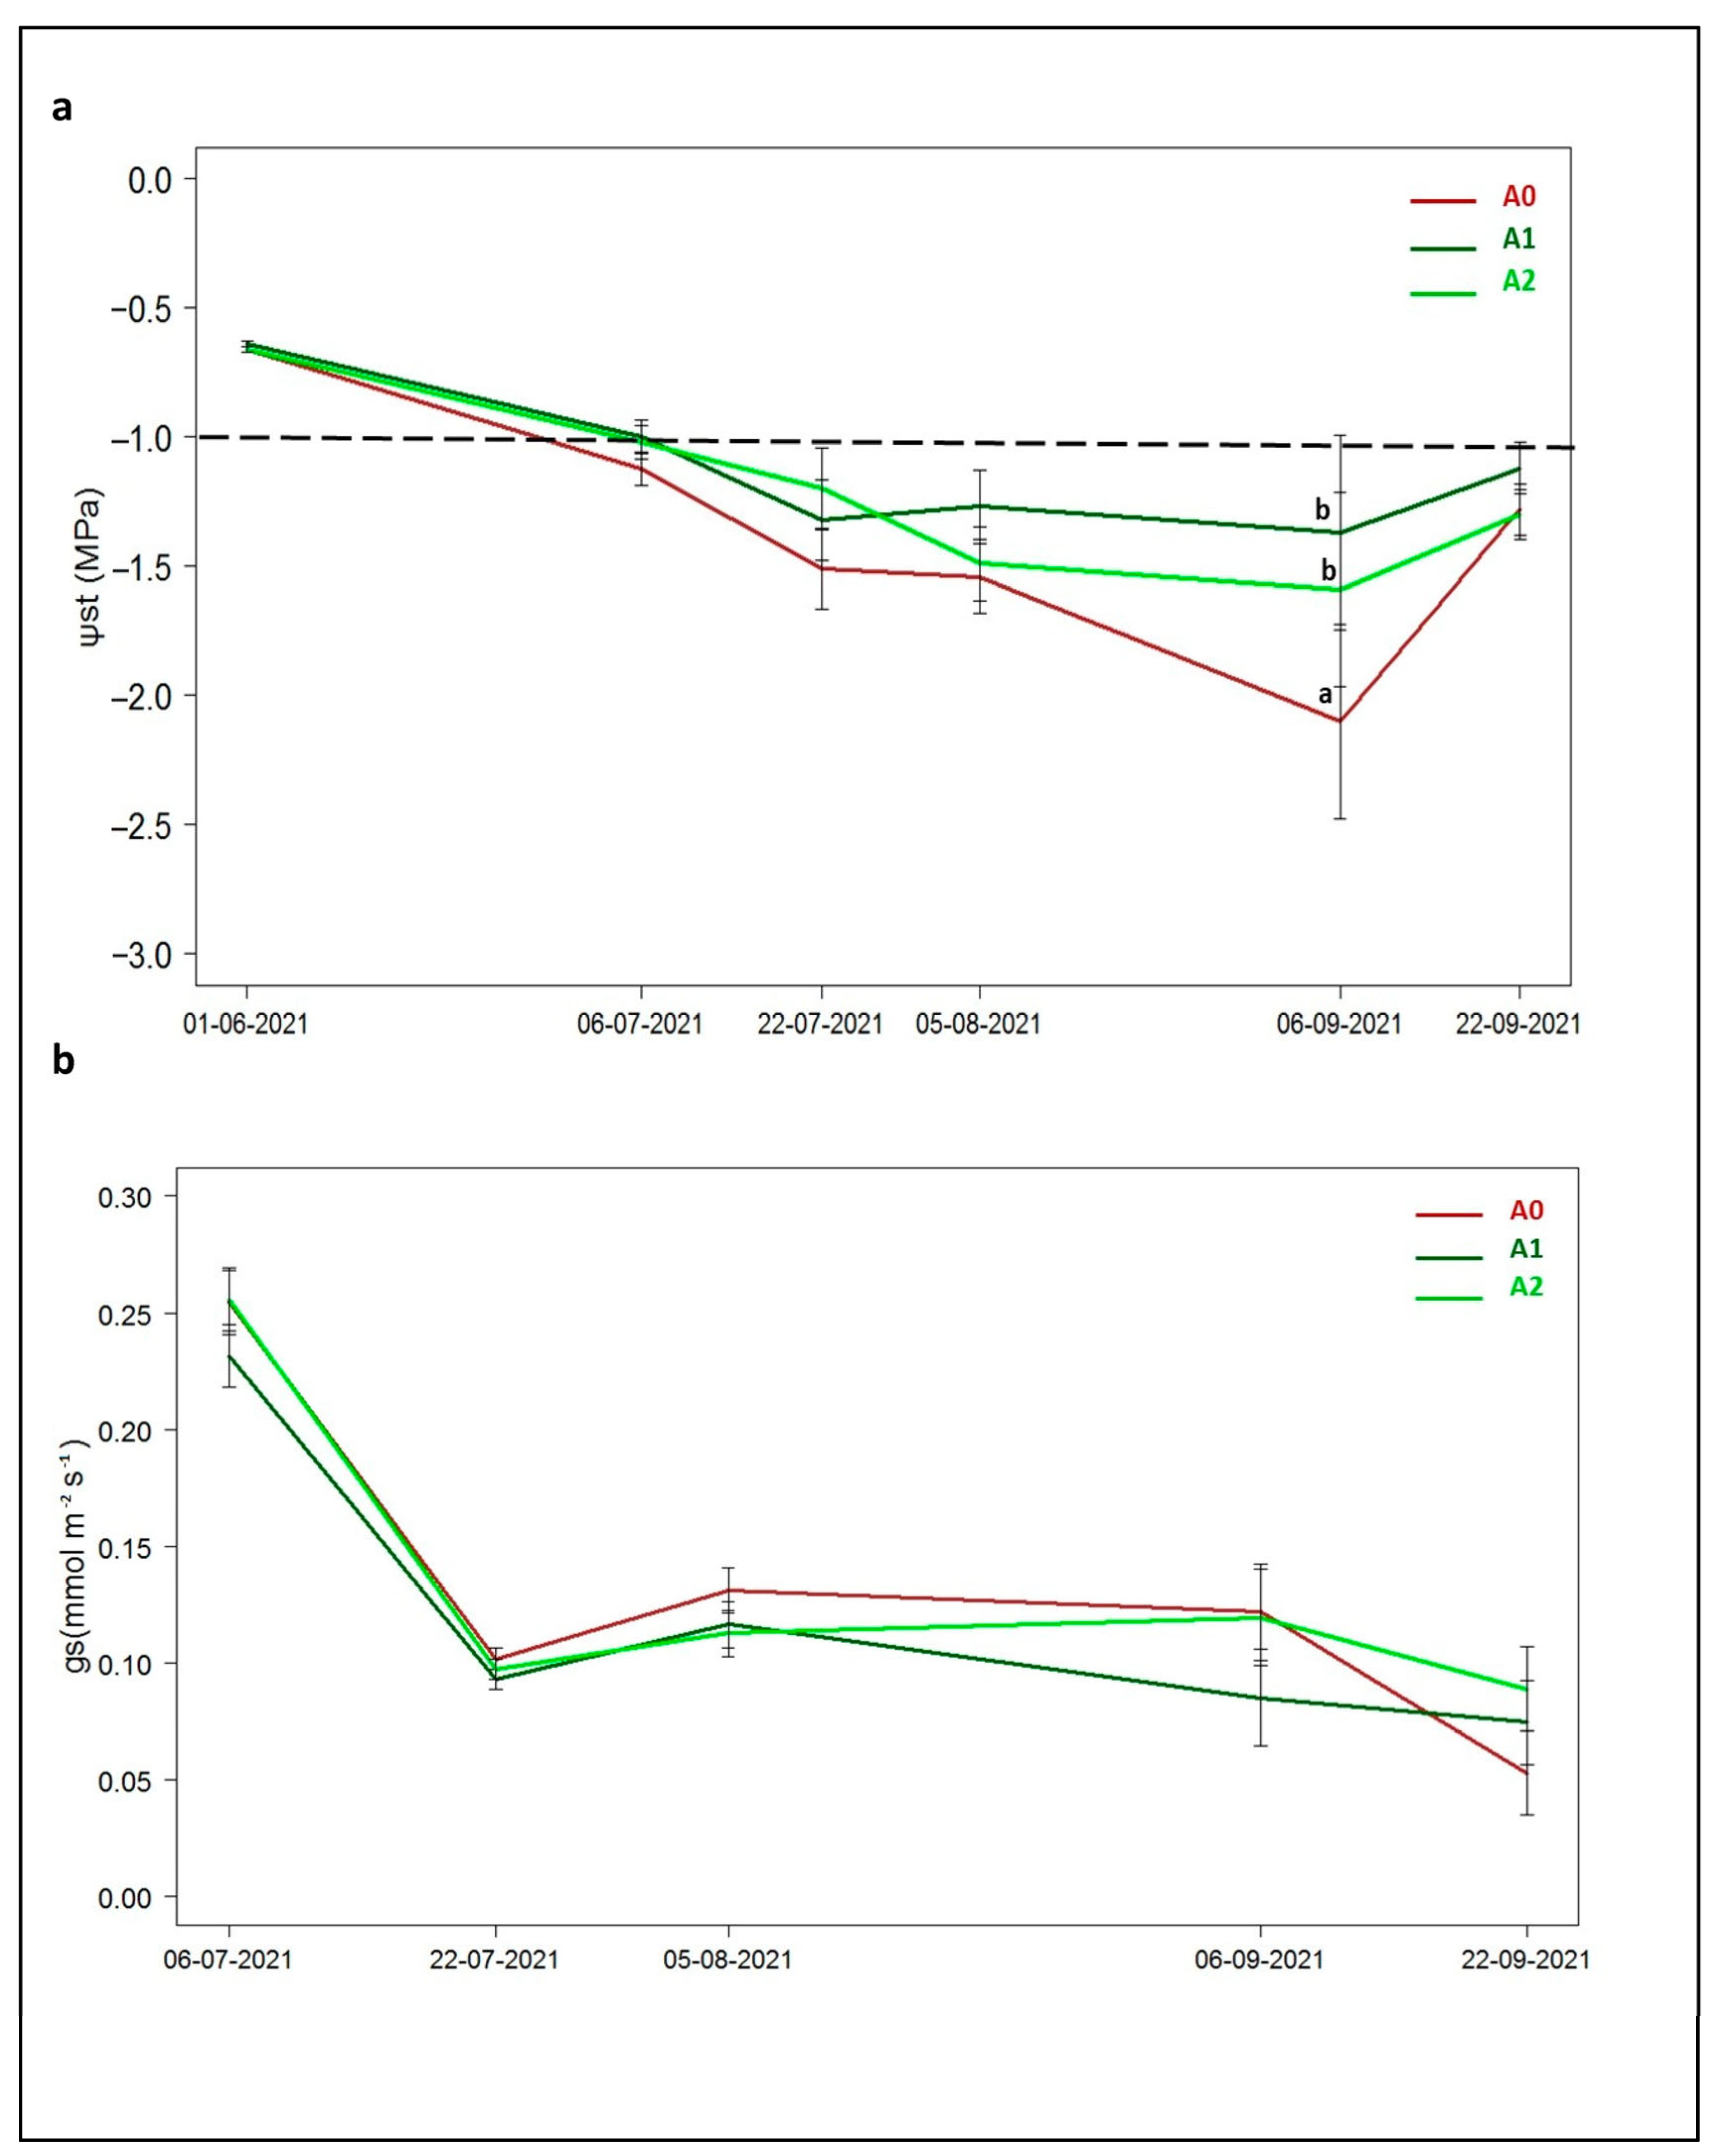
3.3.1. Stem Water Potentials and Stomatal Conductance

Figure 5a shows the evolution of the stem water potential during the peach growing season. The trends of SWC described in Section 3.1.1 are in agreement with the patterns of stem water potential. During the whole crop cycle, the highest stem potential values were observed in treatment A1, where the soil amendment was supplied in a complete dose. The lowest potential values were measured in the treatment without soil amendment.
The differences in stem water potential values between the treatments were not significant (Figure 5a) along the season, except on 9 September, when Ψst was equal to −1.37, −1.59, and −2.10 MPa for A1, A2, and A0, respectively. According to Rahmati et al. [78], a value of Ψst equal to −1.5 MPa could be considered as the threshold for peach water stress. According to these results, risks of water stress should arise at the beginning of September in treatment A0. The pressure chamber technique [83,84] measures leaf potential, i.e., expresses the force with which water is retained by leaves. This measurement makes it possible to assess the water status of the plant, to identify when the plant enters a water stress condition [85].
The stem water potential values confirm what was also observed for REW. Only in September were the stem water potential values measured in the treatment without modification statistically lower than those measured in the two treatments with modification.
The conductance values over time, shown in Figure 5b, did not statistically differ among the three treatments. The highest conductance values were measured at the beginning of the cycle from the first fully developed leaves.
The irrigation schedule set out by the experiment protocol ensured the stomatal opening and, as a consequence, the gas exchanges during the whole vegetative period of the peach tree. In our study, data on stem water potential and stomatal conductance (Figure 5a,b) showed no significant differences between treatments except at certain times; this is because stomata opening is not only determined by stem water potential, but also by PAR levels, evapotranspiration demand, and CO2 concentration within the sub-stomatal chambers [86]. Stomatal behavior is also influenced by agronomic treatments [87], but these are seldom revealed in field trials [88].

3.3.2. Sensitivity of Plant Water Status Indicators

Figure 6a shows the relationship between REW and Ψst when the values of the different treatments during the season are combined. A good exponential increase of Ψst was obtained as REW increases, with maximum levels of REW at values above −1.00 MPa (r2 = +0.47). A similar exponential relationship was observed between REW and gs, with the latter reaching a plateau of around 1.3 mmol m−2 s−1 (Figure 6b; r2 = +0.49). These two relationships seem to be in agreement, as reported by Alcaras et al. [89]. The correlation between stem water potential and REW was significant (Figure 6a). Regardless of the experimental treatment, the relationship confirms that in peach trees, the stem water potential follows an exponential function of the relative extractable water (REW) [89]. Since the scheduling irrigation was carried out in full irrigation conditions (100% ET0), the stomatal conductance seems to show no significant differences among the treatments studied, probably because the amendment resulted in an improved situation compared to the control treatment, which well exceeded the stress threshold of −1.50 MPa only in September. In a previous study [51], in moderate and severe water stress conditions (about 50% of the full irrigation), the xylematic potential results were not completely informative regarding plant water stress in late-ripening peach cultivars, and therefore should be used with caution as a plant water indicator; instead, the stomatal conductance could be a useful index.
In Figure 6c, the correlation between Ψst and gs is reported and compared to previous figures, a lower correlation is noted (R2 = +0.38). In addition, the gs measurements fall for all treatments in a range of 0.07 (mmol m−2 s−1) to 0.12 (mmol m−2 s−1), with Ψst from −1.5 (MPa) to −1.1 (MPa). It should be added that the measurements carried out on 1 June in all three treatments show a higher stomatal conductance compared to other days, which is linked to a higher value of stem water potential equal to about −0.66, −0.64, and −0.66, respectively, in A0, A1, and A2. These differences were found between the different dates between Ψst, and gs, according to Ahumada et al. [90], can be influenced by agronomic factors and climatic conditions.
Figure 6b,c shows the relationship between the measurement of stomatal conductance with REW and stem water potential. The relationship confirms that irrespective of the experimental treatment, conductance in peach trees follows the REW, and the stem water potential, according to an exponential function and a quadratic function, is poor but significant (p > 0.05). Stomatal conductance is a direct function of the stem water potential [66] and is indirectly related to the soil water status.

3.4. Fruit and Shoot Growth

The AGR values for fruit (Figure 7a) show an increasing trend in July until reaching a plateau and then decreasing at the beginning of August. The season’s fruit growth rate in A0 was lower than A1 and A2, except on 5 August, when the shoots reached their maximum length (Figure 7b). Shoots grow quickly from May to 5 August, showing differences between the treatments (Figure 7b). The fruits’ volume shows a slow increase at the beginning, when the shoots are very active, then it increases considerably until the harvest, when there is no more competition with shoots (Figure 7c). The presence of soil amendment influences the three measured morphological parameters: AGR, shoot length, and fruit volume. Without soil amendment, growth rates are lower. Although the effect of the two soil amendment amounts is not significant for fruit growth, treatments A1 and A2 showed higher growth rates than A0 before harvest. In our study, we also noticed how the fruit growth rate and shoot length are influenced by the application of the amendment [91]. As reported by Nair and Ngouajio [92], the fruit growth measured during the season seems, in the smallest part, to be influenced by the application of the amendment because the growth of fruit is also influenced by different climate factors. The results discussed so far show that the addition of amendment does indeed affect the amount of water in the soil. This improvement in soil water content is also observed at the plant level when analyzing the behavior of stem water potential over time (and less clearly with stomatal conductance). The stem water potential indicates the improved hydration status of the plant tissue when adding amendment to the soil. Consequently, the analysis of fruit and shoot growth indicates greater growth in treatments with greater soil water availability, i.e., where amendment has been added to the soil.

4. Conclusions

This study shows that the addition of ACM to the soil at the beginning of the irrigation season increases the daily soil water content with the use of both complete (A1) and half (A2) dosages, with a slightly better performance for A1 in terms of soil water content. These results were better clarified by the use of the REW water stress index. The increase in soil water content led to an increase in the values of Ψs (stem water potential) above or near the water stress threshold (−1.5 MPa). Moreover, an improvement in the total organic carbon in the soil with the amendment supply was measured. The correlation between stem water potential and REW was significant. In late-ripening peach cultivars with conservative behavior, it is important to consider the right index when detecting the plant water status. In fact, in conditions of slight water stress, the stem water potential has confirmed reliability as a plant-based index. However, it is advisable to combine it with stomatal conductance in conditions of moderate and severe water stress. Further analyses are necessary to investigate the relationship between stomatal conductance and soil water storage. Improvements in soil water content also influence the plant with respect to increased fruit and shoot growth. Considering that the dose of the amendment did not affect the variability in soil and water parameters and plant performance in general, it would be desirable to use the halved dose to reduce management costs. Additional studies should deepen the soil amendment–soil–plant relationship, following annual applications, to highlight the medium-to-long-term effects of the amendment on soil water storage and the improved crop production. Providing sustainable methods by which to retain as much water as possible within the soil, while limiting its evaporation as much as possible, will be essential.

Author Contributions

Conceptualization, R.M.F. and P.C.; methodology, P.C.; software, O.C. and M.R.B.; validation, L.G. and A.F.M.; formal analysis, R.M.F. and P.C.; investigation, A.F.M.; resources, G.D.C.; data curation, O.C. and M.R.B.; writing—original draft preparation, O.C., M.R.B., and G.D.C.; writing—review and editing, R.M.F., P.C., and L.G.; visualization, L.G. and A.F.M.; supervision, R.M.F. and P.C.; project administration, P.C.; funding acquisition, P.C. All authors have read and agreed to the published version of the manuscript.

Funding

This study was supported by the project: “Water4AgriFood, Miglioramento delle produzioni agroalimentari mediterranee in condizioni di carenza di risorse idriche”, PNR 2015–2020”, Area Agrifood, funded by MIUR, PON ARS01_00825 “Ricerca e Innovazione” 2014–2020.

Data Availability Statement

Data available on request due to restrictions privacy. The data presented in this study are available on request from the corresponding author.

Acknowledgments

Special thanks to M. Mastrorilli for his contribution to this work and for inspiring us with his passion for scientific research.

Conflicts of Interest

The authors declare that there are no known competing financial interests or personal relationships that could have appeared to influence the work reported in this paper.

References

  1. Bleu, U. UNEP/MAP-Plan Bleu: State of the Environment and Development in the Mediterranean. Athens 2009. Available online: https://mcc.jrc.ec.europa.eu/documents/201607121602.pdf (accessed on 24 April 2023).
  2. Change, Intergovernmental Panel on Climate. Ipcc. Clim. Change 2014. Available online: https://www.ipcc.ch/site/assets/uploads/2018/02/SYR_AR5_FINAL_full.pdf (accessed on 24 April 2023).
  3. Madsen, H.; Lawrence, D.; Lang, M.; Martinkova, M.; Kjeldsen, T. Review of trend analysis and climate change projections of extreme precipitation and floods in Europe. J. Hydrol. 2014, 519, 3634–3650. [Google Scholar] [CrossRef]
  4. Fiori, E.; Comellas, A.; Molini, L.; Rebora, N.; Siccardi, F.; Gochis, D.; Tanelli, S.; Parodi, A. Analysis and hindcast simulations of an extreme rainfall event in the Mediterranean area: The Genoa 2011 case. Atmos. Res. 2014, 138, 13–29. [Google Scholar] [CrossRef]
  5. Fahad, S.; Hussain, S.; Saud, S.; Tanveer, M.; Bajwa, A.A.; Hassan, S.; Shah, A.N.; Ullah, A.; Wu, C.; Khan, F.A. A biochar application protects rice pollen from high-temperature stress. Plant Physiol. Biochem. 2015, 96, 281–287. [Google Scholar] [CrossRef]
  6. Trenberth, K.E. Atmospheric moisture residence times and cycling: Implications for rainfall rates and climate change. Clim. Chang. 1998, 39, 667–694. [Google Scholar] [CrossRef]
  7. Findell, K.L.; Eltahir, E.A. An analysis of the soil moisture-rainfall feedback, based on direct observations from Illinois. Water Resour. Res. 1997, 33, 725–735. [Google Scholar] [CrossRef]
  8. Wallace, J. Increasing agricultural water use efficiency to meet future food production. Agric. Ecosyst. Environ. 2000, 82, 105–119. [Google Scholar] [CrossRef]
  9. Wang, S.; Wang, H.; Hafeez, M.B.; Zhang, Q.; Yu, Q.; Wang, R.; Wang, X.; Li, J. No-tillage and subsoiling increased maize yields and soil water storage under varied rainfall distribution: A 9-year site-specific study in a semi-arid environment. Field Crops Res. 2020, 255, 107867. [Google Scholar] [CrossRef]
  10. Masri, Z.; Ryan, J. Soil organic matter and related physical properties in a Mediterranean wheat-based rotation trial. Soil Tillage Res. 2006, 87, 146–154. [Google Scholar] [CrossRef]
  11. Stocker, T.F. Climate Change 2013: The Physical Science Basis: Summary for Policymakers, a Report of Working Group I of the IPCC, Technical Summary, a Report Accepted by Working Group I of the IPCC But Not Approved in Detail and Frequently Asked Questions: Part of the Working Group I Contribution to the Fifth Assessment Report of the Intergovernmental Panel on Climate Change; Intergovernmental Panel on Climate Change: Geneva, Switzerland, 2013. [Google Scholar]
  12. González-Hidalgo, J.C.; Peña-Monné, J.L.; de Luis, M. A review of daily soil erosion in Western Mediterranean areas. Catena 2007, 71, 193–199. [Google Scholar] [CrossRef]
  13. Philandras, C.; Nastos, P.; Kapsomenakis, J.; Douvis, K.; Tselioudis, G.; Zerefos, C. Long term precipitation trends and variability within the Mediterranean region. Nat. Hazards Earth Syst. Sci. 2011, 11, 3235–3250. [Google Scholar] [CrossRef]
  14. Sumner, G.; Romero, R.; Homar, V.; Ramis, C.; Alonso, S.; Zorita, E. An estimate of the effects of climate change on the rainfall of Mediterranean Spain by the late twenty first century. Clim. Dyn. 2003, 20, 789–805. [Google Scholar] [CrossRef]
  15. Bermúdez, F.L.; Díaz, M.A.R. Génesis y consecuencias erosivas de las lluvias de alta intensidad en la región mediterránea. Cuad. Investig. Geográfica/Geogr. Res. Lett. 1992, 18, 7–28. [Google Scholar] [CrossRef]
  16. Poesen, J.W.; Hooke, J.M. Erosion, flooding and channel management in Mediterranean environments of southern Europe. Prog. Phys. Geogr. 1997, 21, 157–199. [Google Scholar] [CrossRef]
  17. Zittis, G.; Bruggeman, A.; Lelieveld, J. Revisiting future extreme precipitation trends in the Mediterranean. Weather Clim. Extrem. 2021, 34, 100380. [Google Scholar] [CrossRef]
  18. Tramblay, Y.; Koutroulis, A.; Samaniego, L.; Vicente-Serrano, S.M.; Volaire, F.; Boone, A.; Le Page, M.; Llasat, M.C.; Albergel, C.; Burak, S. Challenges for drought assessment in the Mediterranean region under future climate scenarios. Earth-Sci. Rev. 2020, 210, 103348. [Google Scholar] [CrossRef]
  19. Rashid, A.; Ryan, J. Micronutrient constraints to crop production in soils with Mediterranean-type characteristics: A review. J. Plant Nutr. 2004, 27, 959–975. [Google Scholar] [CrossRef]
  20. Brownrigg, S.; McLaughlin, M.J.; McBeath, T.; Vadakattu, G. Effect of acidifying amendments on P availability in calcareous soils. Nutr. Cycl. Agroecosyst. 2022, 124, 247–262. [Google Scholar] [CrossRef]
  21. Umer, M.I.; Rajab, S.M.; Ismail, H.K. Effect of CaCO3 form on soil inherent quality properties of calcareous soils. In Proceedings of the Materials Science Forum; Trans Tech Publications Ltd.: Stafa-Zurich, Switzerland, 2020; pp. 459–467. [Google Scholar]
  22. Mosley, L.; Biswas, T.; Cook, F.; Marschner, P.; Palmer, D.; Shand, P.; Yuan, C.; Fitzpatrick, R. Prolonged recovery of acid sulfate soils with sulfuric materials following severe drought: Causes and implications. Geoderma 2017, 308, 312–320. [Google Scholar] [CrossRef]
  23. Bar-Ness, E.; Hadar, Y.; Chen, Y.; Romheld, V.; Marschner, H. Short-term effects of rhizosphere microorganisms on Fe uptake from microbial siderophores by maize and oat. Plant Physiol. 1992, 100, 451–456. [Google Scholar] [CrossRef] [PubMed]
  24. Geng, S.; Yan, D.; Zhang, T.; Weng, B.; Zhang, Z.; Qin, T. Effects of drought stress on agriculture soil. Nat. Hazards 2015, 75, 1997–2011. [Google Scholar] [CrossRef]
  25. Fernández, J.M.; Plaza, C.; García-Gil, J.C.; Polo, A. Biochemical properties and barley yield in a semiarid Mediterranean soil amended with two kinds of sewage sludge. Appl. Soil Ecol. 2009, 42, 18–24. [Google Scholar] [CrossRef]
  26. Campi, P.; Gaeta, L.; Mastrorilli, M.; Losciale, P. Innovative soil management and micro-climate modulation for saving water in peach orchards. Front. Plant Sci. 2020, 11, 1052. [Google Scholar] [CrossRef]
  27. Guzha, A. Effects of tillage on soil microrelief, surface depression storage and soil water storage. Soil Tillage Res. 2004, 76, 105–114. [Google Scholar] [CrossRef]
  28. Aboudrare, A.; Debaeke, P.; Bouaziz, A.; Chekli, H. Effects of soil tillage and fallow management on soil water storage and sunflower production in a semi-arid Mediterranean climate. Agric. Water Manag. 2006, 83, 183–196. [Google Scholar] [CrossRef]
  29. Zhang, S.; Li, P.; Yang, X.; Wang, Z.; Chen, X. Effects of tillage and plastic mulch on soil water, growth and yield of spring-sown maize. Soil Tillage Res. 2011, 112, 92–97. [Google Scholar] [CrossRef]
  30. Rawls, W.; Nemes, A.; Pachepsky, Y. Effect of soil organic carbon on soil hydraulic properties. Dev. Soil Sci. 2004, 30, 95–114. [Google Scholar]
  31. Wagner, S.; Cattle, S.R.; Scholten, T. Soil-aggregate formation as influenced by clay content and organic-matter amendment. J. Plant Nutr. Soil Sci. 2007, 170, 173–180. [Google Scholar] [CrossRef]
  32. Dos Santos, I.; Bettiol, W. Effect of sewage sludge on the rot and seedling damping-off of bean plants caused by Sclerotium rolfsii. Crop Prot. 2003, 22, 1093–1097. [Google Scholar] [CrossRef]
  33. Montemurro, F.; Fiore, A.; Campanelli, G.; Ciaccia, C.; Ferri, D.; Maiorana, M.; Diacono, M. Yield and performance and soil properties of organically fertilized fodder crops. J. Plant Nutr. 2015, 38, 1558–1572. [Google Scholar] [CrossRef]
  34. Tisdell, S.E.; Breslin, V.T. Characterization and Leaching of Elements from Municipal Solid Waste Compost; American Society of Agronomy, Crop Science Society of America, and Soil Science Society of America: Madison, WI, USA, 1995; Volume 24, No. 5; pp. 827–833. [Google Scholar]
  35. Pérez, D.V.; Alcantara, S.; Ribeiro, C.C.; Pereira, R.; Fontes, G.C.d.; Wasserman, M.; Venezuela, T.C.; Meneguelli, N.d.A.; De Macedo, J.; Barradas, C.A.A. Composted municipal waste effects on chemical properties of a Brazilian soil. Bioresour. Technol. 2007, 98, 525–533. [Google Scholar] [CrossRef] [PubMed]
  36. Pigozzo, A.T.J.; Lenzi, E.; Luca Junior, J.d.; Scapim, C.A.; Costa, A.C.S.d. Transition metal rates in latosol twice treated with sewage sludge. Braz. Arch. Biol. Technol. 2006, 49, 515–526. [Google Scholar] [CrossRef]
  37. Achiba, W.B.; Gabteni, N.; Lakhdar, A.; Du Laing, G.; Verloo, M.; Jedidi, N.; Gallali, T. Effects of 5-year application of municipal solid waste compost on the distribution and mobility of heavy metals in a Tunisian calcareous soil. Agric. Ecosyst. Environ. 2009, 130, 156–163. [Google Scholar] [CrossRef]
  38. Lal, R. Soil organic matter and water retention. Agron. J. 2020, 112, 3265–3277. [Google Scholar] [CrossRef]
  39. Jong, R.d.; Campbell, C.; Nicholaichuk, W. Water retention equations and their relationship to soil organic matter and particle size distribution for disturbed samples. Can. J. Soil Sci. 1983, 63, 291–302. [Google Scholar] [CrossRef]
  40. Ellerbrock, R.; Gerke, H.; Bachmann, J.; Goebel, M.-O.J. Composition of organic matter fractions for explaining wettability of three forest soils. Soil Sci. Soc. Am. J. 2005, 69, 57–66. [Google Scholar] [CrossRef]
  41. Bronick, C.J.; Lal, R. Soil structure and management: A review. Geoderma 2005, 124, 3–22. [Google Scholar] [CrossRef]
  42. Liu, M.; Han, G.; Zhang, Q. Effects of soil aggregate stability on soil organic carbon and nitrogen under land use change in an erodible region in Southwest China. Int. J. Environ. Res. Public Health 2019, 16, 3809. [Google Scholar] [CrossRef]
  43. Karami, A.; Homaee, M.; Afzalinia, S.; Ruhipour, H.; Basirat, S. Organic resource management: Impacts on soil aggregate stability and other soil physico-chemical properties. Agric. Ecosyst. Environ. 2012, 148, 22–28. [Google Scholar] [CrossRef]
  44. Libohova, Z.; Seybold, C.; Wysocki, D.; Wills, S.; Schoeneberger, P.; Williams, C.; Lindbo, D.; Stott, D.; Owens, P.R. Reevaluating the effects of soil organic matter and other properties on available water-holding capacity using the National Cooperative Soil Survey Characterization Database. J. Soil Water Conserv. 2018, 73, 411–421. [Google Scholar] [CrossRef]
  45. Taban, M.; Movahedi Naeini, S. Effect of aquasorb and organic compost amendments on soil water retention and evaporation with different evaporation potentials and soil textures. Commun. Soil Sci. Plant Anal. 2006, 37, 2031–2055. [Google Scholar] [CrossRef]
  46. Azlan, A.; Aweng, E.; Ibrahim, C. The correlation between total organic carbon (TOC), organic matter and water content in soil collected from different land use of Kota Bharu, Kelantan. Aust. J. Basic Appl. Sci. 2011, 5, 915–922. [Google Scholar]
  47. Díaz-Zorita, M.; Buschiazzo, D.E.; Peinemann, N. Soil organic matter and wheat productivity in the semiarid Argentine Pampas. Agron. J. 1999, 91, 276–279. [Google Scholar] [CrossRef]
  48. Balogh, J.; Pintér, K.; Fóti, S.; Cserhalmi, D.; Papp, M.; Nagy, Z. Dependence of soil respiration on soil moisture, clay content, soil organic matter, and CO2 uptake in dry grasslands. Soil Biol. Biochem. 2011, 43, 1006–1013. [Google Scholar] [CrossRef]
  49. Zhang, Y.J.; Meinzer, F.C.; Qi, J.H.; Goldstein, G.; Cao, K.F. Midday stomatal conductance is more related to stem rather than leaf water status in subtropical deciduous and evergreen broadleaf trees. Plant Cell Environ. 2013, 36, 149–158. [Google Scholar] [CrossRef]
  50. Naor, A. Midday stem water potential as a plant water stress indicator for irrigation scheduling in fruit trees. In Proceedings of the III International Symposium on Irrigation of Horticultural Crops 537, Lisbon, Portugal, 28 June–2 July 1999; pp. 447–454. [Google Scholar]
  51. Gaeta, L.; Amendolagine, A.; Di Gennaro, D.; Navarro, A.; Tarricone, L.; Campi, P.; Stellacci, A.; Losciale, P. Managing orchard floor for saving water in a late ripening peach cultivar: A preliminary result. In Proceedings of the IX International Peach Symposium 1304, Bucureşti, Romania, 2–6 July 2017; pp. 207–214. [Google Scholar]
  52. Lordan, J.; Pascual, M.; Fonseca, F.; Villar, J.; Rufat, J. Use of rice husk to enhance peach tree performance in soils with limiting physical properties. Soil Tillage Res. 2013, 129, 19–22. [Google Scholar] [CrossRef]
  53. Baldi, E.; Toselli, M.; Marcolini, G.; Marangoni, B. Effect of mineral and organic fertilization on soil chemical, biological and physical fertility in a commercial peach orchard. In Proceedings of the V International Symposium on Mineral Nutrition of Fruit Plants 721, Talca, Chile, 16–21 January 2005; pp. 55–62. [Google Scholar]
  54. Celano, G.; Dumontet, S.; Xiloyannis, C.; Nuzzo, V.; Dichio, B. Responses of peach-orchard system to green manuring and mineral fertilisation. In Proceedings of the III International Symposium on Mineral Nutrition of Deciduous Fruit Trees 448, Zaragoza, Spain, 27 May 1996; pp. 289–296. [Google Scholar]
  55. Montanaro, G.; Dichio, B.; Bati, C.B.; Xiloyannis, C. Soil management affects carbon dynamics and yield in a Mediterranean peach orchard. Agric. Ecosyst. Environ. 2012, 161, 46–54. [Google Scholar] [CrossRef]
  56. Cheng, Y.; Xie, W.; Huang, R.; Yan, X.; Wang, S. Extremely high N2O but unexpectedly low NO emissions from a highly organic and chemical fertilized peach orchard system in China. Agric. Ecosyst. Environ. 2017, 246, 202–209. [Google Scholar] [CrossRef]
  57. Xiao, Y.; Peng, Y.; Peng, F.; Zhang, Y.; Yu, W.; Sun, M.; Gao, X. Effects of concentrated application of soil conditioners on soil–air permeability and absorption of nitrogen by young peach trees. Soil Sci. Plant Nutr. 2018, 64, 423–432. [Google Scholar] [CrossRef]
  58. Campi, P.; Palumbo, A.; Mastrorilli, M. Effects of tree windbreak on microclimate and wheat productivity in a Mediterranean environment. Eur. J. Agron. 2009, 30, 220–227. [Google Scholar] [CrossRef]
  59. Katerji, N.; Mastrorilli, M.; Rana, G. Water use efficiency of crops cultivated in the Mediterranean region: Review and analysis. Eur. J. Agron. 2008, 28, 493–507. [Google Scholar] [CrossRef]
  60. Soil Conservation Service, US Department of Agriculture. Soil Taxonomy: A Basic System of Soil Classification for Making and Interpreting Soil Surveys; Soil Conservation Service, US Department of Agriculture: Washington, DC, USA, 1975.
  61. Allen, R.G.; Pereira, L.S.; Raes, D.; Smith, M. Crop evapotranspiration-Guidelines for computing crop water requirements-FAO Irrigation and drainage paper 56. Fao Rome 1998, 300, D05109. [Google Scholar]
  62. Mastrorilli, M.; Katerji, N.; Rana, G.; Nouna, B.B. Daily actual evapotranspiration measured with TDR technique in Mediterranean conditions. Agric. For. Meteorol. 1998, 90, 81–89. [Google Scholar] [CrossRef]
  63. Granier, A.; Breda, N.; Biron, P.; Villette, S. A lumped water balance model to evaluate duration and intensity of drought constraints in forest stands. Ecol. Model. 1999, 116, 269–283. [Google Scholar] [CrossRef]
  64. Granier, A.; Loustau, D.; Bréda, N. A generic model of forest canopy conductance dependent on climate, soil water availability and leaf area index. Ann. For. Sci. 2000, 57, 755–765. [Google Scholar] [CrossRef]
  65. Zhang, R.; Wang, D.; Sun, H.; Wei, C.; Wang, L. Comparison of transpiration of differently aged apple orchards on the Loess Plateau of China at multiple temporal scales. Hydrol. Sci. J. 2021, 66, 979–990. [Google Scholar] [CrossRef]
  66. Tognetti, R.; Giovannelli, A.; Lavini, A.; Morelli, G.; Fragnito, F.; d’Andria, R. Assessing environmental controls over conductances through the soil–plant–atmosphere continuum in an experimental olive tree plantation of southern Italy. Agric. For. Meteorol. 2009, 149, 1229–1243. [Google Scholar] [CrossRef]
  67. Ferrara, R.M.; Mazza, G.; Muschitiello, C.; Castellini, M.; Stellacci, A.M.; Navarro, A.; Lagomarsino, A.; Vitti, C.; Rossi, R.; Rana, G. Short-term effects of conversion to no-tillage on respiration and chemical-physical properties of the soil: A case study in a wheat cropping system in semi-dry environment. Ital. J. Agrometeorol 2017, 1, 47–58. [Google Scholar]
  68. Ferrara, R.M.; Campi, P.; Muschitiello, C.; Leogrande, R.; Vittorio Vonella, A.; Ventrella, D.; Rana, G. Soil respiration during three cropping cycles of durum wheat under different tillage conditions in a Mediterranean environment. Soil Use Manag. 2022, 38, 1547–1563. [Google Scholar] [CrossRef]
  69. Vitti, C.; Stellacci, A.M.; Leogrande, R.; Mastrangelo, M.; Cazzato, E.; Ventrella, D. Assessment of organic carbon in soils: A comparison between the Springer–Klee wet digestion and the dry combustion methods in Mediterranean soils (Southern Italy). Catena 2016, 137, 113–119. [Google Scholar] [CrossRef]
  70. Naor, A.; Klein, I.; Doron, I. Stem water potential and apple size. J. Am. Soc. Hortic. Sci. 1995, 120, 577–582. [Google Scholar] [CrossRef]
  71. Liu, Q.; Piao, S.; Janssens, I.A.; Fu, Y.; Peng, S.; Lian, X.; Ciais, P.; Myneni, R.B.; Peñuelas, J.; Wang, T. Extension of the growing season increases vegetation exposure to frost. Nat. Commun. 2018, 9, 426. [Google Scholar] [CrossRef]
  72. Jones, H.G.; Serraj, R.; Loveys, B.R.; Xiong, L.; Wheaton, A.; Price, A.H. Thermal infrared imaging of crop canopies for the remote diagnosis and quantification of plant responses to water stress in the field. Funct. Plant Biol. 2009, 36, 978–989. [Google Scholar] [CrossRef] [PubMed]
  73. Aragüés, R.; Medina, E.; Martínez-Cob, A.; Faci, J. Effects of deficit irrigation strategies on soil salinization and sodification in a semiarid drip-irrigated peach orchard. Agric. Water Manag. 2014, 142, 1–9. [Google Scholar] [CrossRef]
  74. Ruiz-Sanchez, M.C.; Domingo, R.; Castel, J.R. Deficit irrigation in fruit trees and vines in Spain. A review. Span. J. Agric. Res. 2010, 8, S5–S20. [Google Scholar] [CrossRef]
  75. Pedrero, F.; Camposeo, S.; Pace, B.; Cefola, M.; Vivaldi, G.A. Use of reclaimed wastewater on fruit quality of nectarine in Southern Italy. Agric. Water Manag. 2018, 203, 186–192. [Google Scholar] [CrossRef]
  76. Rolbiecki, S.; Piszczek, P. Effect of the forecast climate change on the peach tree water requirements in the Bydgoszcz region. Infrastrukt. I Ekol. Teren. Wiej. 2016, IV/3, 1499–1508. [Google Scholar]
  77. Sadras, V.; Milroy, S. Soil-water thresholds for the responses of leaf expansion and gas exchange: A review. Field Crops Res. 1996, 47, 253–266. [Google Scholar] [CrossRef]
  78. Rahmati, M.; Davarynejad, G.H.; Génard, M.; Bannayan, M.; Azizi, M.; Vercambre, G. Peach water relations, gas exchange, growth and shoot mortality under water deficit in semi-arid weather conditions. PLoS ONE 2015, 10, e0120246. [Google Scholar] [CrossRef]
  79. Batiot, C.; Liñán, C.; Andreo, B.; Emblanch, C.; Carrasco, F.; Blavoux, B. Use of Total Organic Carbon (TOC) as tracer of diffuse infiltration in a dolomitic karstic system: The Nerja Cave (Andalusia, southern Spain). Geophys. Res. Lett. 2003, 30. [Google Scholar] [CrossRef]
  80. Volk, C.; Wood, L.; Johnson, B.; Robinson, J.; Zhu, H.W.; Kaplan, L. Monitoring dissolved organic carbon in surface and drinking waters. J. Environ. Monit. 2002, 4, 43–47. [Google Scholar] [CrossRef] [PubMed]
  81. Yang, C.; Yang, L.; Ouyang, Z. Organic carbon and its fractions in paddy soil as affected by different nutrient and water regimes. Geoderma 2005, 124, 133–142. [Google Scholar] [CrossRef]
  82. Lepistö, A.; Räike, A.; Sallantaus, T.; Finér, L. Increases in organic carbon and nitrogen concentrations in boreal forested catchments—Changes driven by climate and deposition. Sci. Total Environ. 2021, 780, 146627. [Google Scholar] [CrossRef] [PubMed]
  83. Scholander, P.F.; Hammel, H.; Hemmingsen, E.; Bradstreet, E. Hydrostatic pressure and osmotic potential in leaves of mangroves and some other plants. Proc. Natl. Acad. Sci. USA 1964, 52, 119–125. [Google Scholar] [CrossRef]
  84. Scholander, P.; Hammel, H.T.; Bradstreet, E.D.; Henningson, E.A. Sap Pressure in Vascular Plants. Science 1965, 148, 339–346. [Google Scholar] [CrossRef] [PubMed]
  85. Turner, N.C. Measurement of plant water status by the pressure chamber technique. Irrig. Sci. 1988, 9, 289–308. [Google Scholar] [CrossRef]
  86. Barillot, R.; Frak, E.; Combes, D.; Durand, J.-L.; Escobar-Gutiérrez, A.J. What determines the complex kinetics of stomatal conductance under blueless PAR in Festuca arundinacea? Subsequent effects on leaf transpiration. J. Exp. Bot. 2010, 61, 2795–2806. [Google Scholar] [CrossRef]
  87. Chadha, A.; Florentine, S.K.; Chauhan, B.S.; Long, B.; Jayasundera, M. Influence of soil moisture regimes on growth, photosynthetic capacity, leaf biochemistry and reproductive capabilities of the invasive agronomic weed; Lactuca serriola. PLoS ONE 2019, 14, e0218191. [Google Scholar] [CrossRef]
  88. Yu, C.-L.; Hui, D.; Deng, Q.; Wang, J.; Reddy, K.C.; Dennis, S. Responses of corn physiology and yield to six agricultural practices over three years in middle Tennessee. Sci. Rep. 2016, 6, 1–9. [Google Scholar] [CrossRef]
  89. Alcaras, L.M.A.; Rousseaux, M.C.; Searles, P.S. Responses of several soil and plant indicators to post-harvest regulated deficit irrigation in olive trees and their potential for irrigation scheduling. Agric. Water Manag. 2016, 171, 10–20. [Google Scholar] [CrossRef]
  90. Ahumada-Orellana, L.; Ortega-Farías, S.; Poblete-Echeverría, C.; Searles, P.S. Estimation of stomatal conductance and stem water potential threshold values for water stress in olive trees (cv. Arbequina). Irrig. Sci. 2019, 37, 461–467. [Google Scholar] [CrossRef]
  91. Papafilippaki, A.; Paranychianakis, N.; Nikolaidis, N.P. Effects of soil type and municipal solid waste compost as soil amendment on Cichorium spinosum (spiny chicory) growth. Sci. Hortic. 2015, 195, 195–205. [Google Scholar] [CrossRef]
  92. Nair, A.; Ngouajio, M. Integrating rowcovers and soil amendments for organic cucumber production: Implications on crop growth, yield, and microclimate. HortScience 2010, 45, 566–574. [Google Scholar] [CrossRef]
Figure 1. (a) Daily air temperature values (average, minimum, and maximum) and total precipitation; (b) daily values of global radiation (Rg) and vapor pressure deficit (VPD).
Water 15 01708 g001
Figure 2. (a) Soil moisture values in the three treatments; (b) soil water content averaged on the peach tree growing season. Different letters indicate a significant difference (p-value < 0.05). A0 = control; A1 = complete dosage of soil amendment; A2 = half dosage of soil amendment; WP = wilting point, FC = field capacity.
Water 15 01708 g002
Figure 3. (a) Seasonal relative extractable water (REW) during the peach tree growing season. Different letters indicate a significant difference (p-value < 0.05); (b) REW values at monthly scale; (c) number of days with REW < critical REW value (REWc = 0.4). A0 = control; A1 = complete dosage of soil amendment; A2 = half dosage of soil amendment.
Water 15 01708 g003
Figure 4. Total organic carbon (TOC) during the investigated season. Different letters indicate a significant difference (p-value < 0.05). A0 = control; A1 = complete dosage of soil amendment; A2 = half dosage of soil amendment.
Water 15 01708 g004
Figure 5. (a) Stem midday water potential (Ψst): different letters indicate a significant difference (p-value < 0.05); (b) stomal conductance (gs) during the investigated season. There was no significant difference between the treatments (p-value < 0.05). A0 = control; A1 = complete dosage of soil amendment; A2 = half dosage of soil amendment.
Water 15 01708 g005
Figure 6. (a) Relationship between stem water potential and REW; (b) relationship between stomatal conductance (gs) and stem water potential (Ψst); (c) relationship between REW and stomatal conductance. A0 = control; A1 = complete dosage of soil amendment; A2 = half dosage of soil amendment.
Water 15 01708 g006
Figure 7. (a) Absolute growth rate (AGR) of fruits (cm3 d−1); (b) growth of shoots (cm d−1); (c) growth of fruit volume (cm3). Different letters indicate a significant difference (p-value < 0.05). A0 = control; A1 = complete dosage of soil amendment; A2 = half dosage of soil amendment.
Water 15 01708 g007
Table 1. Physical–chemical properties of the soil collected at the experimental site.
ParameterAverage±sd
Sand (g 100 g−1)210.6
Silt (g 100 g−1)372.9
Clay (g 100 g−1)423.6
E.C. (dS m−1)0.60.05
Field Capacity (m3 m−3)0.360.03
Wilting Point (m3 m−3)0.220.02
SOC (g kg−1)141.1
Total N (g kg−1)1.50.2
Available P (mg kg−1)713.1
Exchangeable K (mg kg−1)54061
Table 2. D.Lgs n. 75/2010 “Reorganization and revision of the regulations of fertilizers”.
Type of Amendment Component Preparation Method Requirements and Minimum Titer in Useful Elements and/or SubstancesOther Requirements and Useful Substances to ClarifyNotes
ACMProduct obtained through a controlled process of transformation and stabilization of organic waste which may consist of the organic fraction of municipal solid waste from separate collection from animal waste including livestock slurry, waste from agro-industrial activities and untreated wood and natural textile processing, sewage and sludge, as well as the matrices provided for green composted soil amendment.Maximum moisture: 50%
pH: 6.5 to 8.5
Organic C on dry matter minimum: 20%
C humic and fulvic on dry matter minimum: 7%.
Organic nitrogen on dry matter: >80% of total nitrogen
C/N maximum: 25
Moisture
pH
Organic C on dry
C humic and fulvic on dry
Organic nitrogen on dry
C/N
Salt content
The following parameters of biological nature are also set:
− Salmonella: absence in 25g is sample as is;
− Escherichia coli in 1g of sample as is;
Germination index (30% dilution) must be ≥ 60%;
− Thallium: less than 2 mg kg−l on dry weight (only for soil conditioners with algae).
Maximum heavy metal contents (expressed as mg/kg dry matter): Cd 0.7; Cu 70; Ni 25; Pb 45; Zn 200; Hg 0.4; Cr (total) 70; Cr (VI) 0.
Recommendations for the use of ACM in arboriculture is on average from maximum 25 t ha−1 to minimum 1.5 t ha−1
Table 3. Determined values of ACM, Fertileva srl, Evainfruit: Amendmented Mixed.
Source-Determined Values: Product Complying with the D.Lgs n. 75/2010
Moisture (%)31.80
pH (unit)7.66
Organic carbon [C] (% DM)35.90
Humic and fulvic carbon (% DM)12.40
Organic nitrogen [N] (% DM)2.60
Carbon/Nitrogen ratio [C/N]13
Copper [Cu] (mg/kg DM)57.8
Zinc [Zn] (mg/kg DM)142
Salt content (meq/100 g)22.40
Disclaimer/Publisher’s Note: The statements, opinions and data contained in all publications are solely those of the individual author(s) and contributor(s) and not of MDPI and/or the editor(s). MDPI and/or the editor(s) disclaim responsibility for any injury to people or property resulting from any ideas, methods, instructions or products referred to in the content.

