


Investigation on the Hydrogeochemical Characteristics and Controlling Mechanisms of Groundwater in the Coastal Aquifer

1
College of Environment Science and Engineering, Tongji University, Shanghai 200092, China
2
Appraisal Center for Environment & Engineering, Ministry of Ecology and Environment, Beijing 100041, China
*
Author to whom correspondence should be addressed.
Water 2023, 15(9), 1710; https://doi.org/10.3390/w15091710
Submission received: 19 February 2023
/
Revised: 29 March 2023
/
Accepted: 4 April 2023
/
Published: 27 April 2023
(This article belongs to the Topic Hydrosphere under the Driving of Human Activity and Climate Change: Status, Evolution and Strategies)
Abstract
:Groundwater contamination in coastal areas has attracted widespread attention. However, studies on the hydrogeochemical characteristics and controlling mechanisms in coastal aquifers are still lacking. In this study, 71 sets of groundwater samples were collected during the dry and wet seasons in a coastal city, Shandong Province. Correlation and principal component analyses were used to identify pollution sources. Meanwhile, Piper diagrams, Gibbs plots, ion ratios, and saturation indices were employed to investigate the hydrogeochemical controlling mechanisms. The results revealed that pollution components included Na+, NH4+, Cl−, SO42−, NO3−, NO2−, Pb, As, Se, TDS, TH, F−, and Mn. Pollution compositions in the study area were primarily derived from natural processes and anthropogenic activities. The contamination of nitrogen resulted primarily from agricultural activities. The exceedance of SO42− was mainly due to the leaching of waste by rainfall. High Na+, Cl−, and F− were related to sea intrusion. Pb and Se might have been caused by anthropogenic activities. The exceedance of As was caused by anthropogenic inputs and natural factors. The poor seepage conditions and anoxic conditions promoted the enrichment of Mn. The concentration of most components in the dry season was larger than that in the wet season. There were no significant differences in water chemistry type during the wet season and dry season. Groundwater chemical compositions were dominated by the dissolution of halite, gypsum, and anhydrite, as well as the cation exchange reaction. The influence of seawater intrusion on groundwater was not serious.
1. Introduction
Groundwater is significant resource for industrial utilization, agricultural irrigation, and domestic drinking in the world [1,2,3]. However, the quality of groundwater is under serious threat, including agricultural activities, heavy-metal contamination, and seawater intrusion [4,5,6]. Groundwater quality is suffering deterioration in urban areas, especially in coastal regions [7]. Once an aquifer system is severely polluted, it is challenging to remediate it to the initial environment [8,9,10]. With approximately 40% of the world’s population living within 100 km of a coastal area, freshwater deposited in coastal aquifers has been an important resource to support the development of coastal areas, providing drinking water for almost one billion people in coastal areas worldwide [11,12]. Due to the high intensity of human activities, water pollution, eutrophication, and seawater intrusion in coastal areas are becoming increasingly serious, threatening human health [13,14,15]. Many coastal areas, including the Netherlands, Italy, and China’s Jiaodong Peninsula are suffering from a serious lack of water [16,17,18,19]. Therefore, a comprehensive knowledge of the hydrogeochemical processes in the coastal aquifer is critical for these valuable water resources.
Seawater intrusion is considered to be a widespread environmental hazard that affects groundwater in many coastal areas [20,21]. Even 1% mixing of seawater will make groundwater undrinkable and cause a series of problems, including soil salinization and ecosystem degradation [11]. In coastal areas, it is important to study groundwater chemistry due to the different degrees of mixing interaction between seawater and groundwater [22,23]. The hydrogeochemical processes happening in groundwater systems and the interactions with the media influence the quality of groundwater [24]. Moreover, analysis of groundwater chemical characteristics can trace the origin and evolution of groundwater [25]. The primary processes influencing the hydrogeochemistry and groundwater quality are water–rock interactions, particularly dissolution and weathering processes, carbonate balance, oxidation–reduction, and adsorption–desorption, in addition to human activities [22,26]. Therefore, prevention of groundwater pollution in coastal aquifers necessitates understanding the processes of geochemical evolution and dynamics of flow systems [27].
Several studies have been implemented to investigate the hydrogeochemical characteristics of coastal areas and the effects of seawater intrusion. Multivariate statistical analyses and clustering methods, including principal component analysis (PCA), factor analysis (FA), and hierarchical cluster analysis (HCA), have been employed to investigate the groundwater quality and pollution source [28,29,30,31,32,33]. Meanwhile, Isotopic methods are also often an important tool for studying seawater intrusion and groundwater evolution [16,27,34]. Hydrogen and oxygen isotopes can reveal the cause of groundwater salinization and the source of recharge. Strontium is widely used to study groundwater–rock interactions, mixing processes, and the discharge of seawater to groundwater. Furthermore, Piper diagrams, Gibbs plots, ion ratios, and saturation indices play a significant role in studying the hydrogeochemical controlling mechanisms [35,36,37,38,39,40]. In addition, numerical simulation methods can be used to evaluate the exchange of groundwater with seawater and the transport characteristics of nutrients [41,42,43,44]. Water quality indices (WQIs), machine learning, and the partial least squares regression model (PLSR) are typically used to evaluate the pollution level in groundwater [45,46,47].
Groundwater in the coastal cities adjacent to the Yellow Sea are at risk of seawater intrusion. Considering the uses of groundwater, it can be potentially contaminated by anthropogenic factors. The contamination of coastal aquifers involves complex hydrogeochemical processes which control the groundwater environment in different ways. Therefore, it is desirable to identify the pollution source and investigate the controlling processes of water chemistry. Although scholars have reported the influence scope of seawater intrusion, the hydrogeochemistry and controlling mechanisms of groundwater in the dry and wet seasons are still poorly characterized. The objectives of this work were to (1) identify the pollution source in the study area, (2) investigate the hydrogeochemical characteristics and controlling mechanisms of groundwater, and (3) determine the spatiotemporal variation of groundwater hydrochemistry.
2. Study Area
The study area was located in Shandong Province (Figure 1), with geographical coordinates of 119°19′14″ to 119°39′38″ E longitude and 35°18′05″ to 35°36′27″ N latitude. The general topography of the study area is high in the northwest, sloping slightly to the southeast, with mostly coastal plains in the east and south. The study area is located in the central part of the Qinling–Dabie–Sulu orogenic belt, and the exposed strata include the Paleozoic Jingshan Group and the Cenozoic Quaternary (Table S1); a regional fracture structure is present, mostly in the northeast direction. At the same time, magmatic rocks are widely distributed in the study area (Figure S1).
The climate of the study area is temperate maritime monsoon climate. The average humidity is about 72%. The mean annual temperature is about 12 °C, and the mean annual rainfall reaches 826.8 mm. The mean annual evaporation reaches 1299.0 mm. The water system in the study area features the Yellow Sea in the southeast, and the water system is dendritic in shape. The river is mainly recharged from natural precipitation, and the river flows into the Yellow Sea from west to east. According to the conditions of groundwater deposit, groundwater can be classified into four types: loose rock-like pore water, clastic rock-like fracture water, carbonate karst water, and bedrock fracture water. Near the coastal area, the groundwater type is primarily loose rock pore water and bedrock fracture water. Groundwater is recharged through atmospheric precipitation, river infiltration, and irrigation infiltration. On the whole, the hydraulic gradient of the groundwater is small, and the groundwater flows from northwest to southeast, before finally flowing into the Yellow Sea (Figures S3 and S4). Groundwater is discharged through artificial exploitation, evaporation, and runoff.
3. Materials and Methods
3.1. Samples Collection and Analysis
In order to investigate the hydrogeochemistry of the study area during the dry season and wet season, we collected 71 sets of groundwater samples in April and July 2022. The distributions of the sampling wells are shown in Figure 1. A peristaltic pump (AML919) was used to collect groundwater samples. Then, the samples were filtered through 0.45 µm membrane into polypropylene bottles. Samples for total Fe and Mn analysis were acidified using a nitric acid reagent. In the field, all samples were stored in a thermostat with ice packs. Samples were stored in a refrigerator after transport to the laboratory. The major anions were analyzed by ion chromatography (ICS-2000). Cations were determined by inductively coupled plasma mass spectrometry (ICP-5000). Sample testing was completed at the Eighth Geological Brigade of Shandong Province Geology and Mining Bureau. The sample collection, storage and test methods were in strict compliance with the standards of the Ministry of Natural Resources of China. A quality assurance (QA)/quality control (QC) program was established to guarantee the precision of the measurements. Parallel samples were utilized to control the accuracy of the test. The charge balance error was guaranteed to be within 5%.
3.2. Saturation Index
The saturation index (SI) is significant for assessing the equilibrium and reactivity between minerals and groundwater [48]. The ratio of the activity product to solubility product is employed to evaluate the hydrogeochemical state and reaction in groundwater. A saturation index larger than 0 means that the mineral is supersaturated and will precipitate. A saturation index less than 0 indicates that the mineral is unsaturated and will dissolve. In this work, PHREEQC version 2.8 was applied to determine the SI value of different minerals.
where IAP represents the ratio of activity product, and LP represents the solubility product.
3.3. Multivariate Statistical Analyses
The groundwater controlling mechanism can be determined using graphical and multivariate statistical methods, such as Piper plots, Gibbs plots, and ion ratios. Multivariate statistical methods play an important role in identifying pollution sources, such as correlation analysis and PCA, using GIS and Origin.
4. Results and Discussion
4.1. Groundwater Chemistry Characteristics
Statistical descriptions of the hydrogeochemical data in the dry and wet seasons are shown in the Table 1. Each component exhibited different concentration variations. The range of pH from 7.24 to 8.52 in the dry season and the range of pH from 7.69 to 8.89 in the wet season indicated that the groundwater was predominantly alkaline. The value of TDS ranged from 209.22 mg/L to 8880.98 mg/L, with a mean of 675.87 mg/L, in the dry season, and ranged from 161.32 mg/L to 4064.75 mg/L, with a mean of 571.49 mg/L, in the wet season, indicating that the seasonal variation of TDS was significant. For most components except NO2−, Ni, Se, F−, and Fe, the mean concentration in the dry season was larger than that in the wet season. The mean concentration of major ions during the dry season was in the order Na+ > Ca2+ > Mg2+ > K+ and HCO3− > Cl− > SO42− > NO3−. The sequence changed to Ca2+ > Na+ > Mg2+ > K+ and HCO3− > Cl− > SO42− > NO3− during the wet season. The results of CV showed that Na+, K+, Mg2+, NH4+, Cl−, NO3−, NO2−, Pb, As, Br, TDS, and Mn were sensitive to environmental and anthropogenic activities in the dry season. The spatial distribution of Na+, K+, NH4+, Cl−, NO3−, NO2−, Pb, As, Br, and Mn was highly heterogeneous.
4.2. Source Identification of Pollution Components
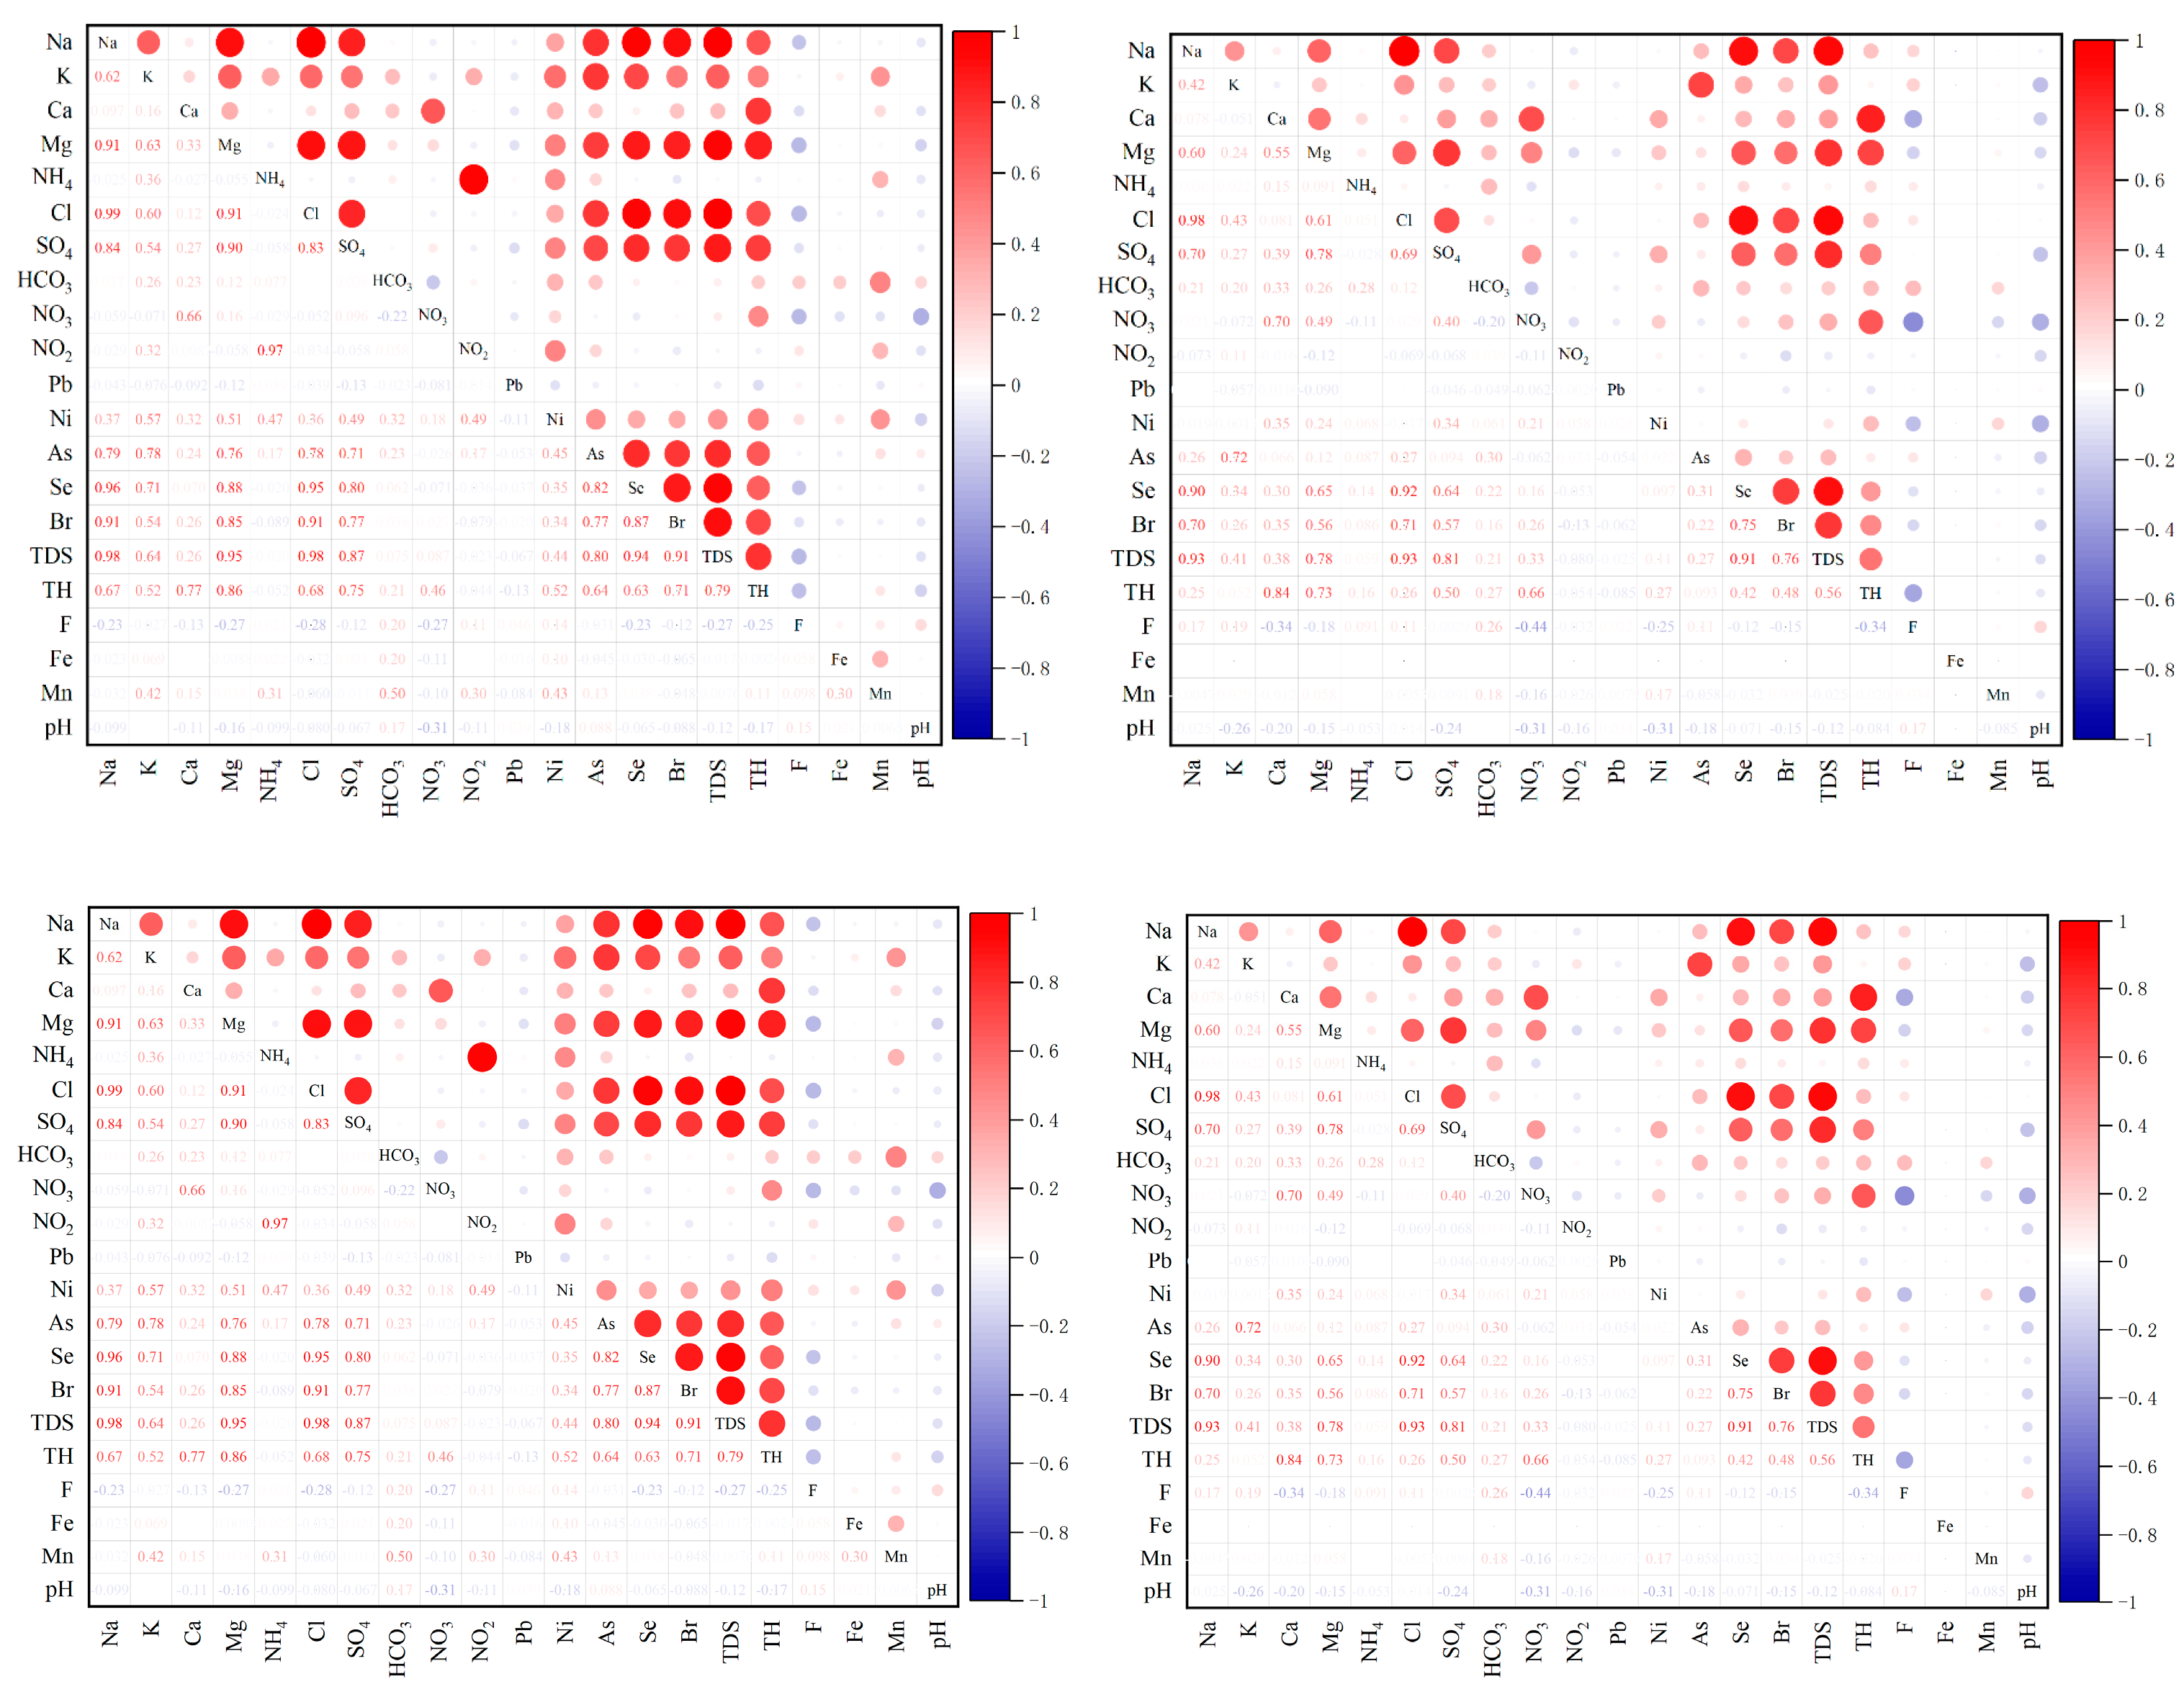
According to Class III groundwater quality standards, the contamination components included Na+, NH4+, Cl−, SO42−, NO3−, NO2−, Pb, As, Se, TDS, TH, F−, and Mn in groundwater. In order to identify the source for each pollution composition, the correlation coefficients between the components were plotted in the dry season and in the wet season (Figure 2). In the dry season, there was strong positive correlation between Na+ and Mg2+, Cl−, SO42−, Se, Br, and TDS. There was strong positive correlation between NH4+ and NO2−. Meanwhile, Cl− showed strong positive correlation with SO42−, Se, Br, and TDS. There was a significant correlation between NO3− and Ca2+. As, Se, and TDS showed strong positive correlation. Moreover, there was significant correlation between As and Na+, K+, Mg2+, Cl−, and SO42−. However, there was no correlation between Pb and other components.
In the wet season, the correlation of the different components showed some changes with the dry season. There was strong positive correlation between Na+ and Cl−, Se, and TDS. There was a significant correlation between NO3− and Ca2+, TH. Likewise, there was no correlation between Pb and other components. As and K+ showed a significant correlation. In the dry season, the concentration of Ni exhibited significant differences between dry season (concentration < 0.05 mg/L) and wet season (concentration > 0.05 mg/L). It could be seen that Ni exhibited a low correlation with Ca2+ and SO42−.
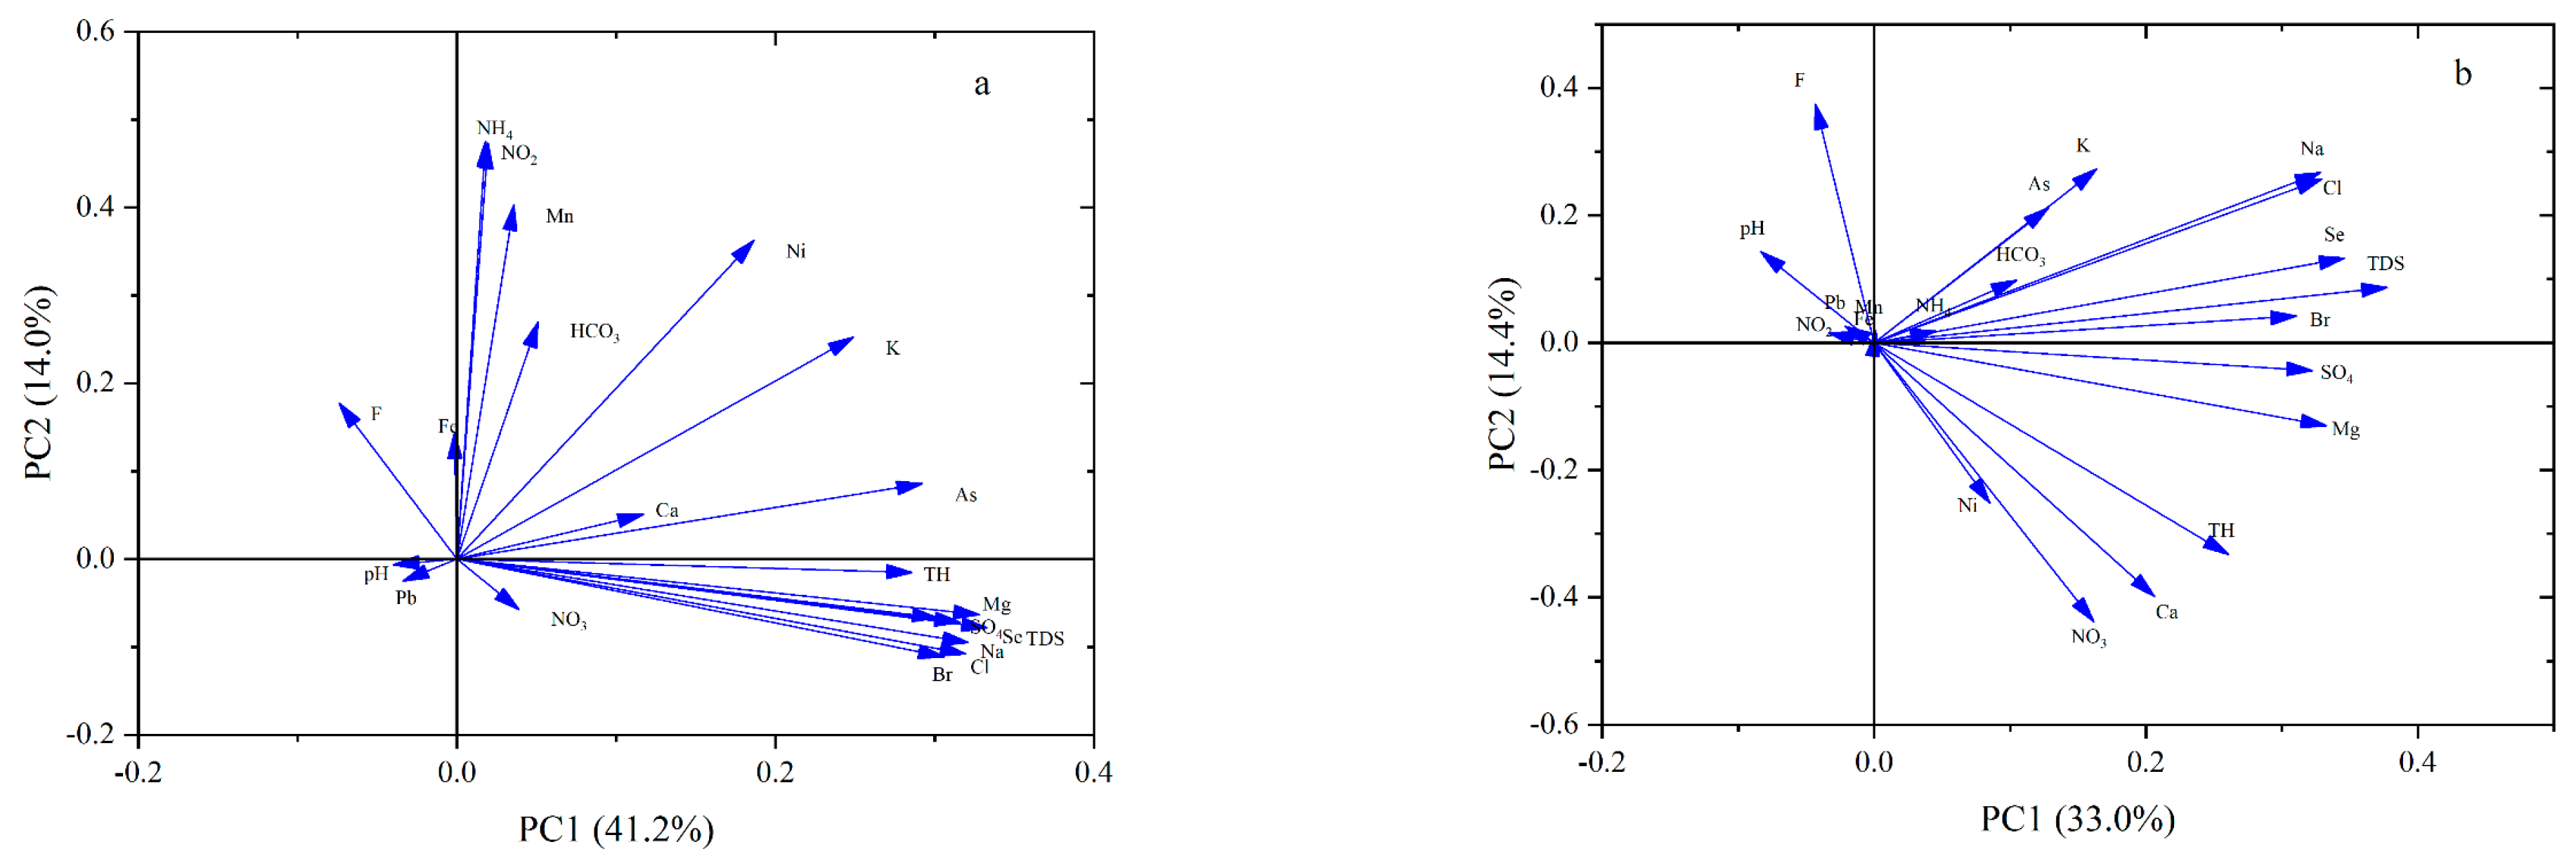
Correlation analysis and principal component analysis were utilized to identify sources of pollution components in groundwater. The variance contribution of PC1 reached 41.2% in the dry season (Figure 3). The variance contribution of PC1 reached 33.0% in the wet season. Four principal constituents were extracted for dry season and wet season, contributing to 73% and 63.6% of total variance, respectively.
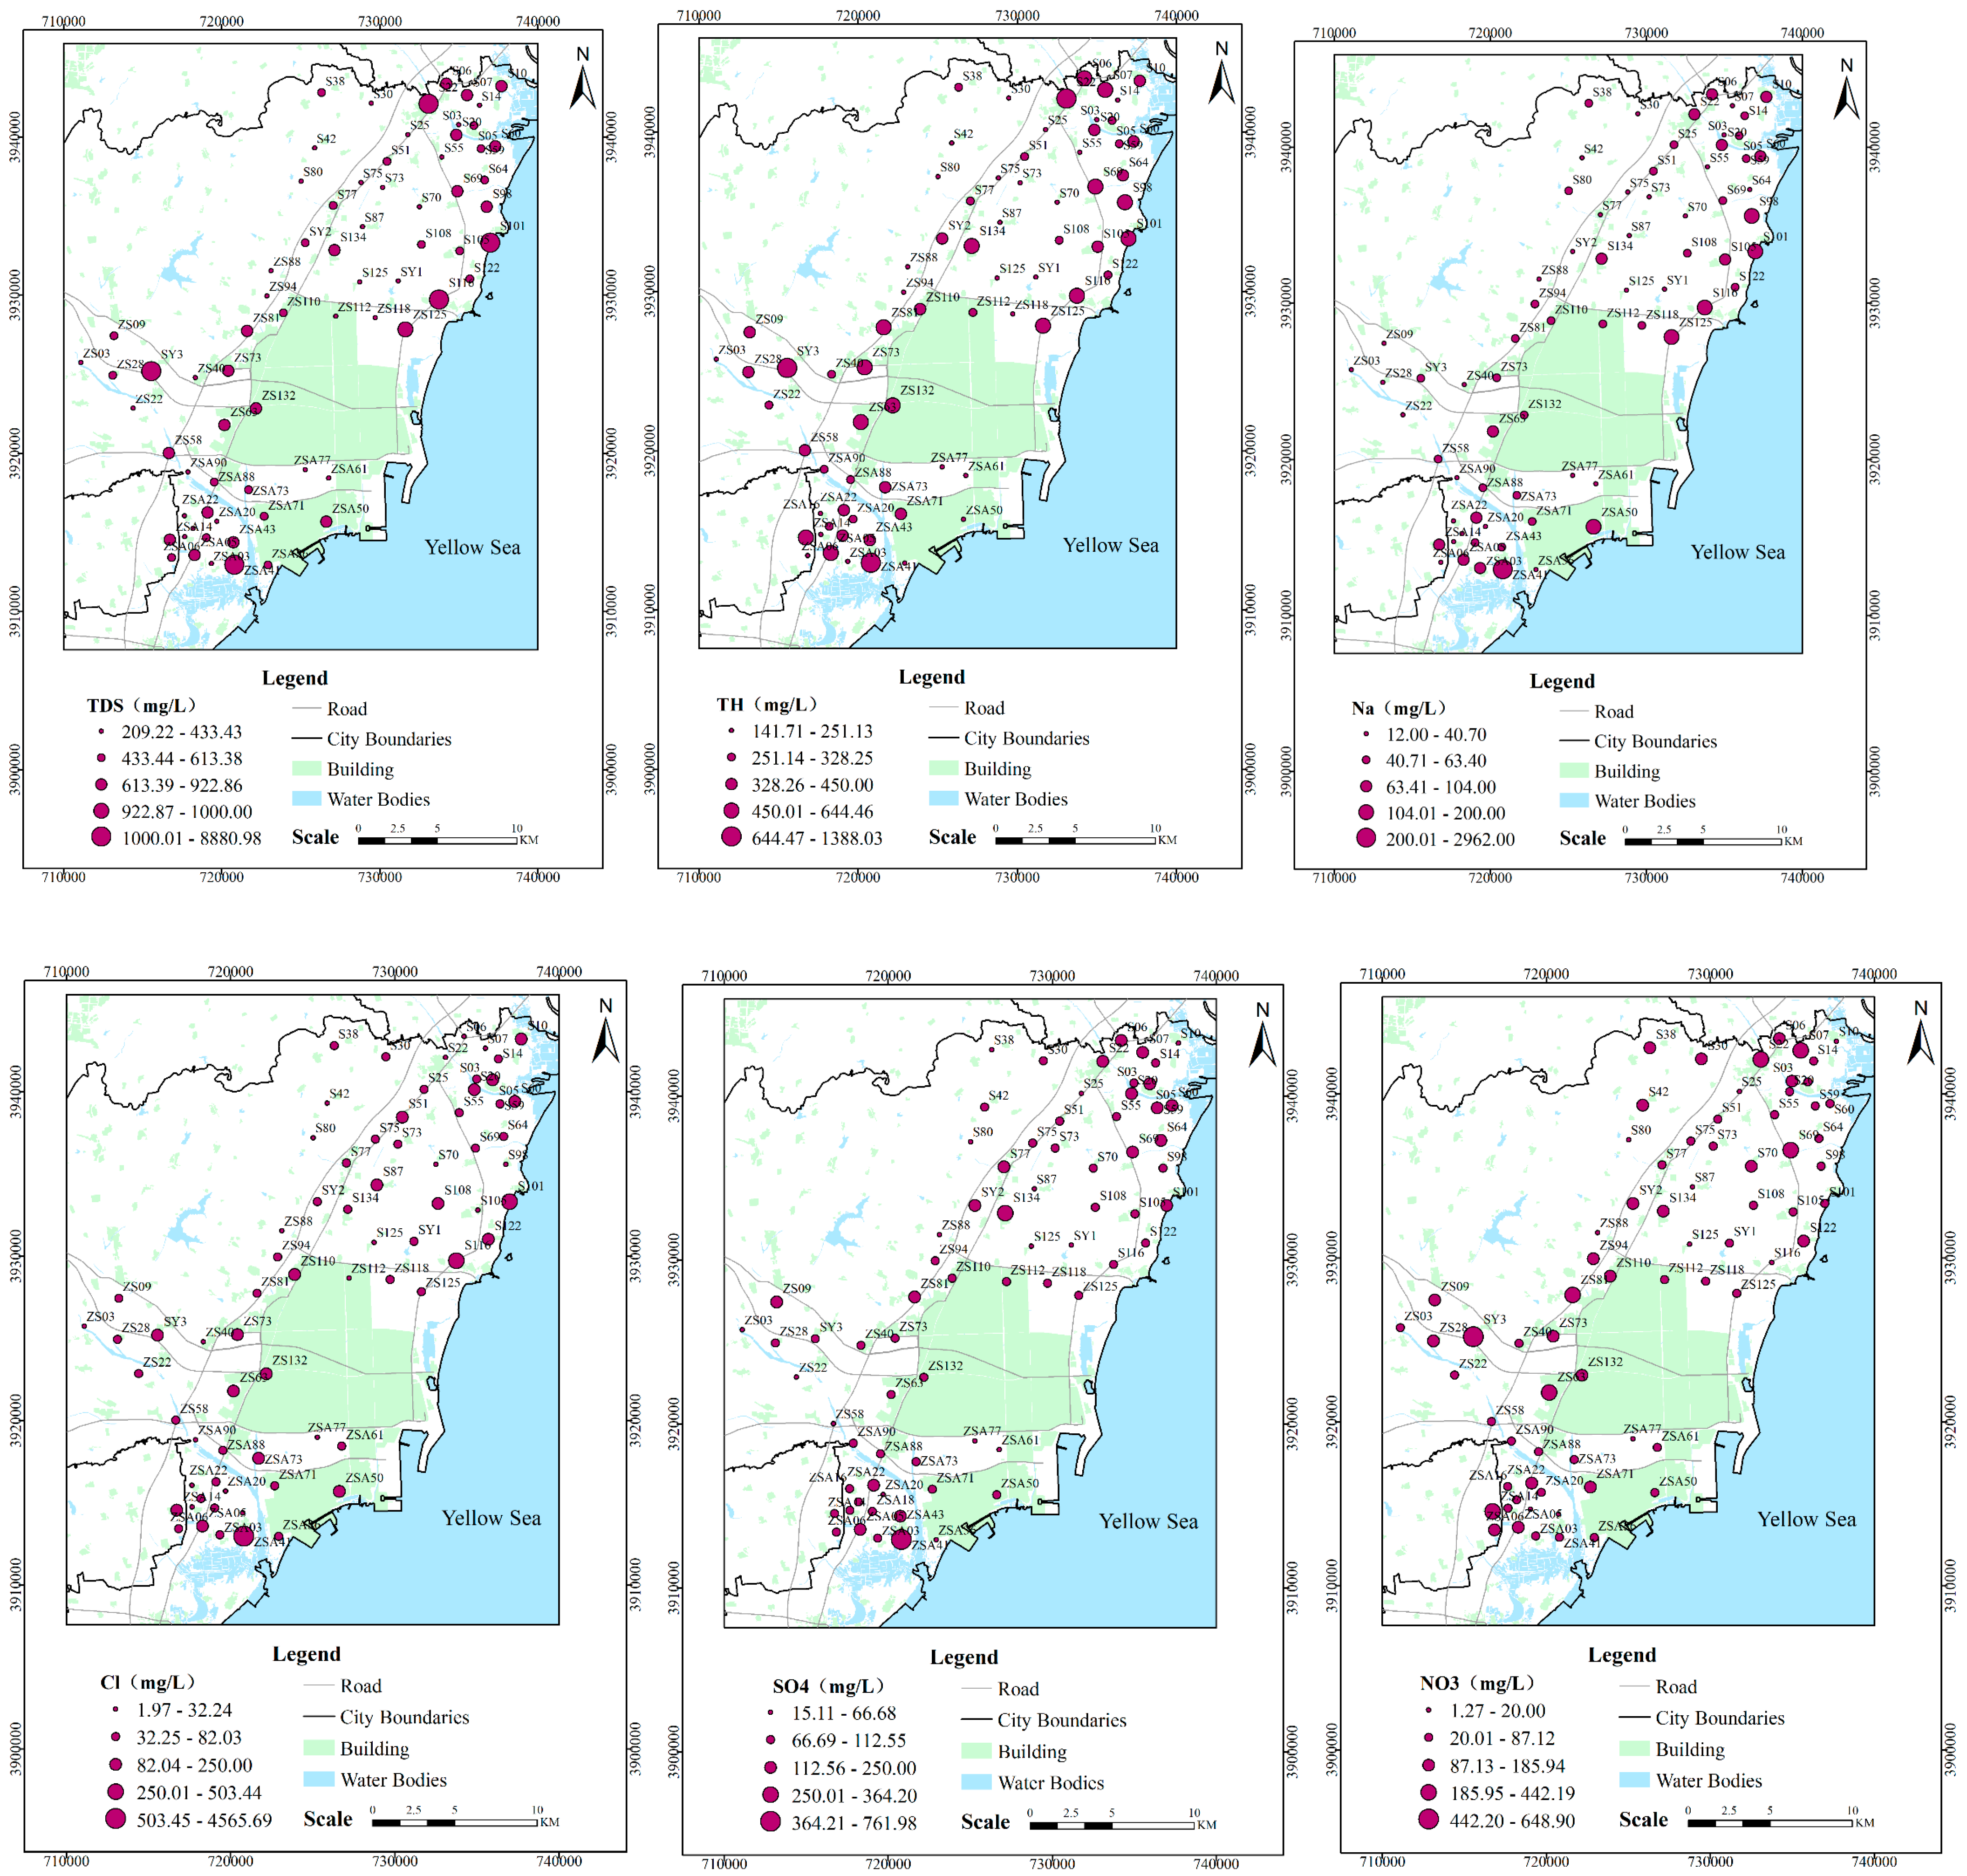
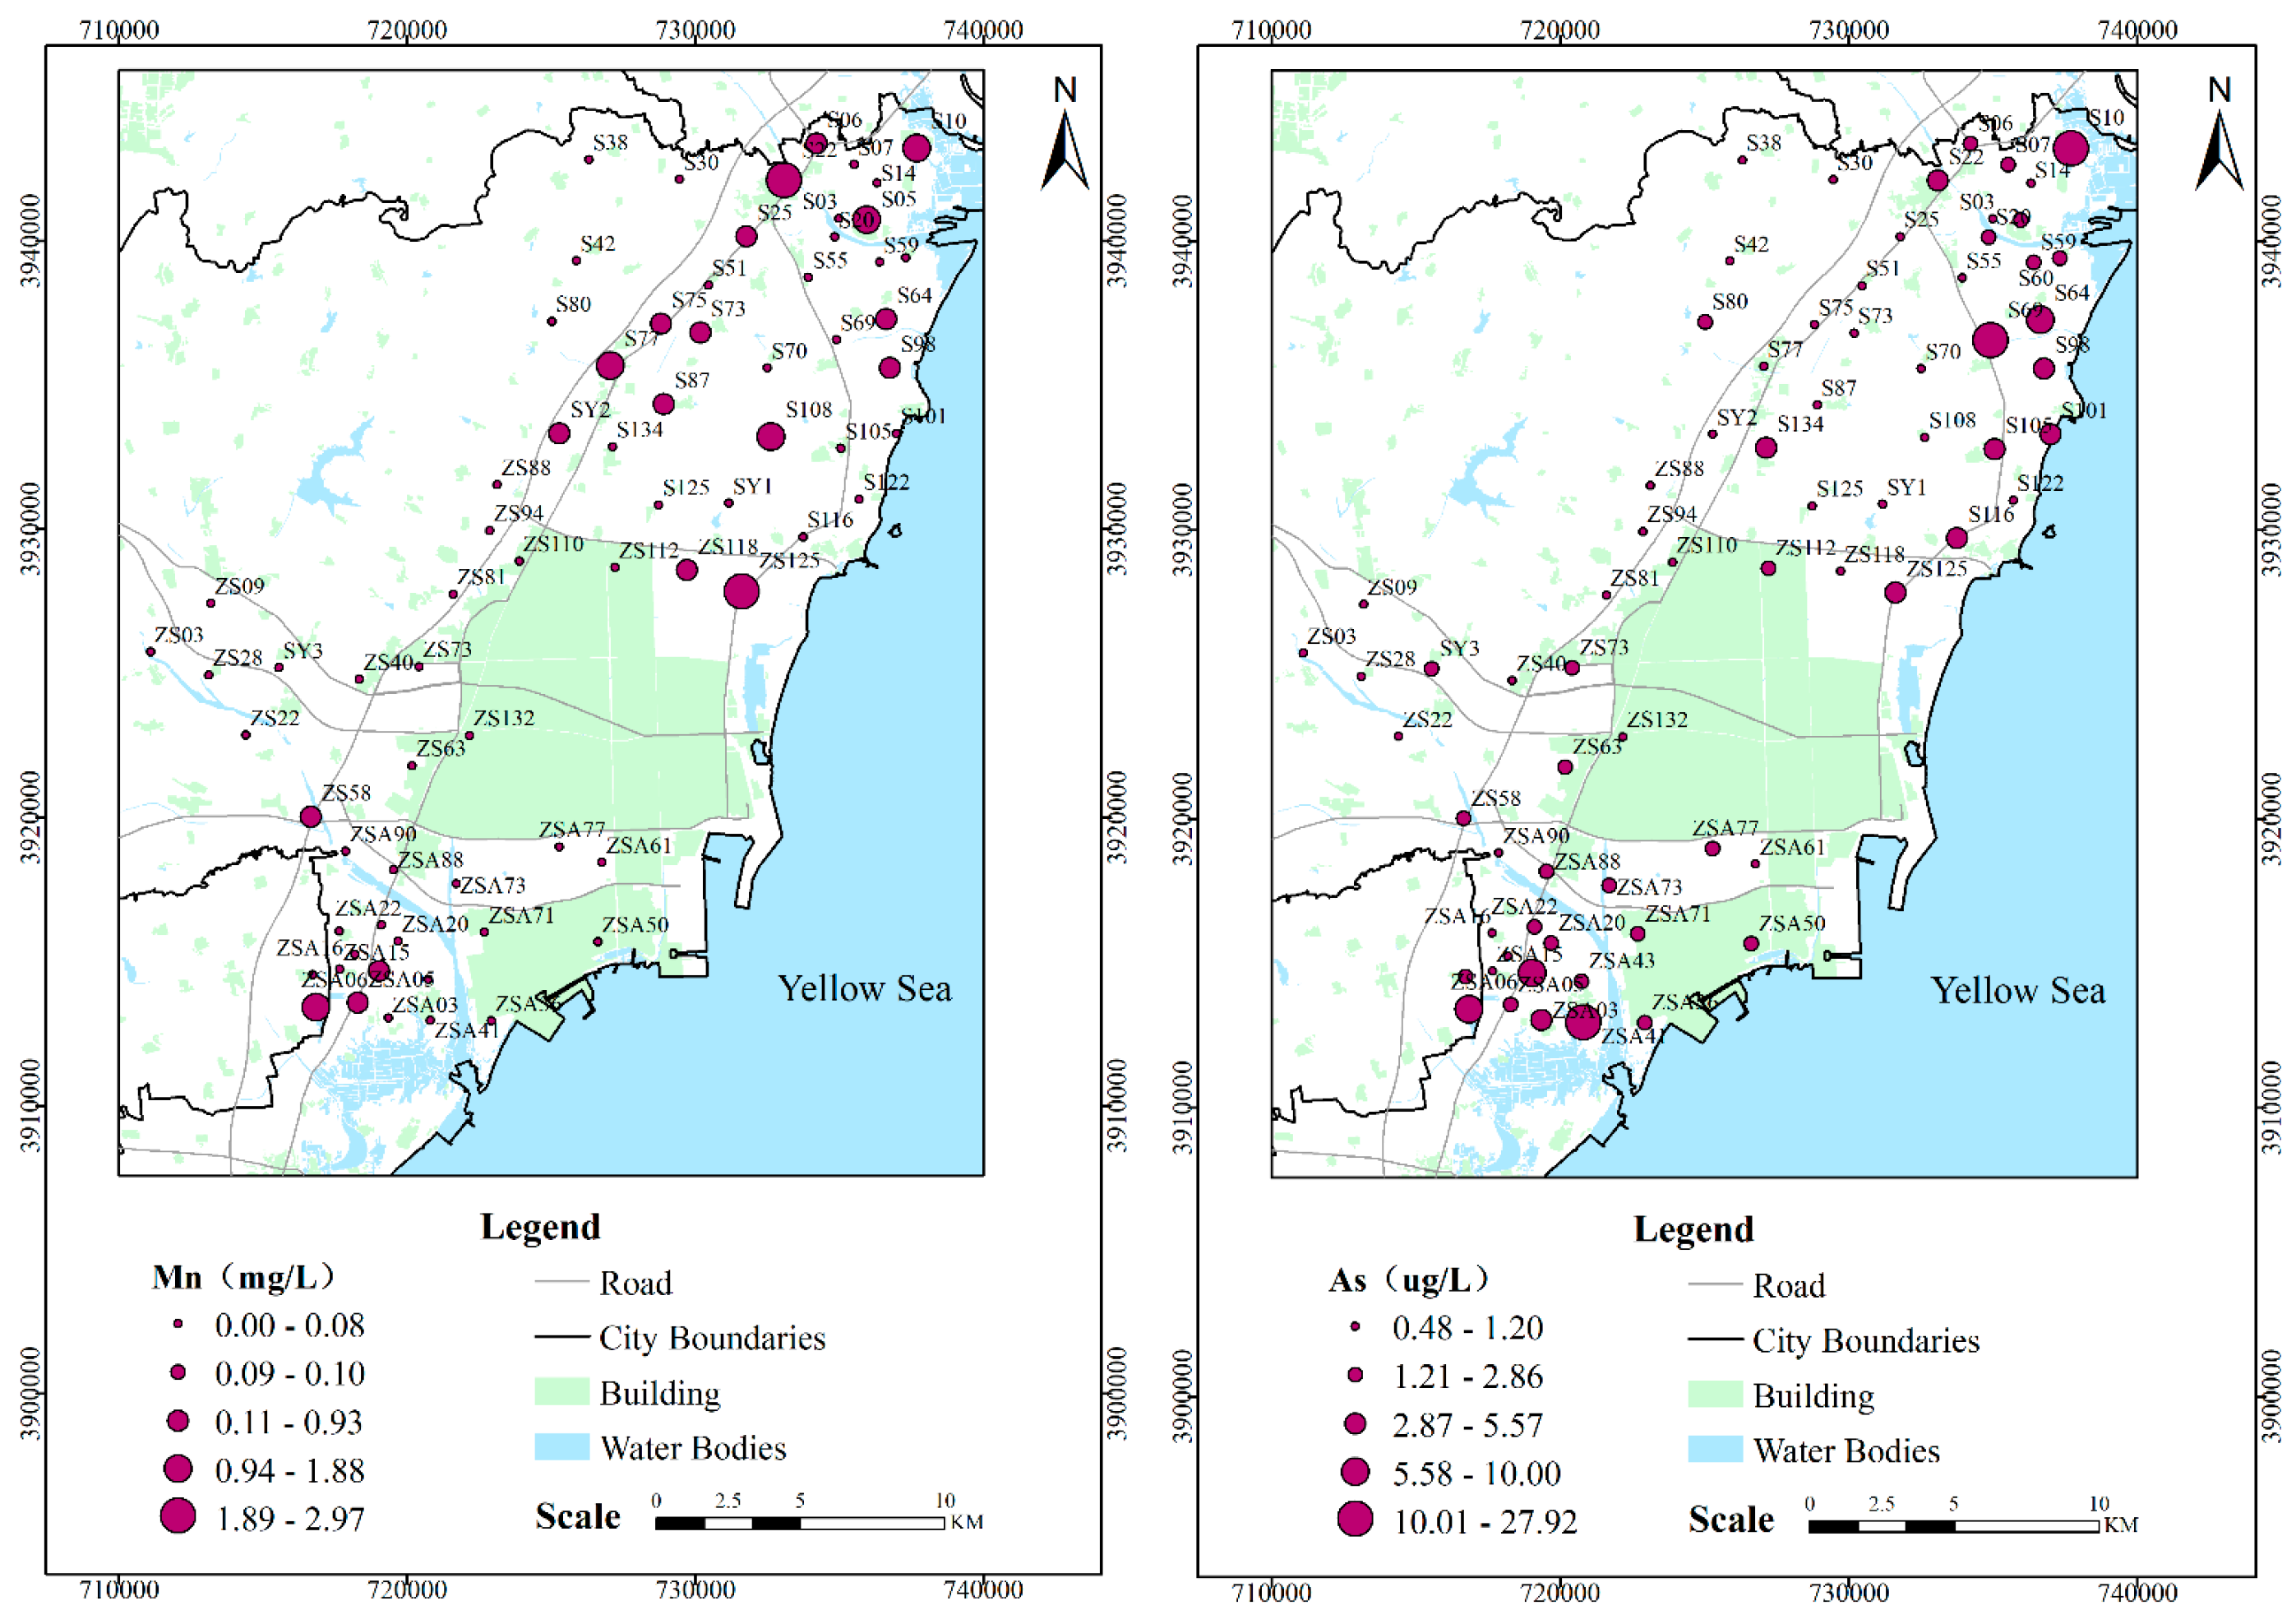
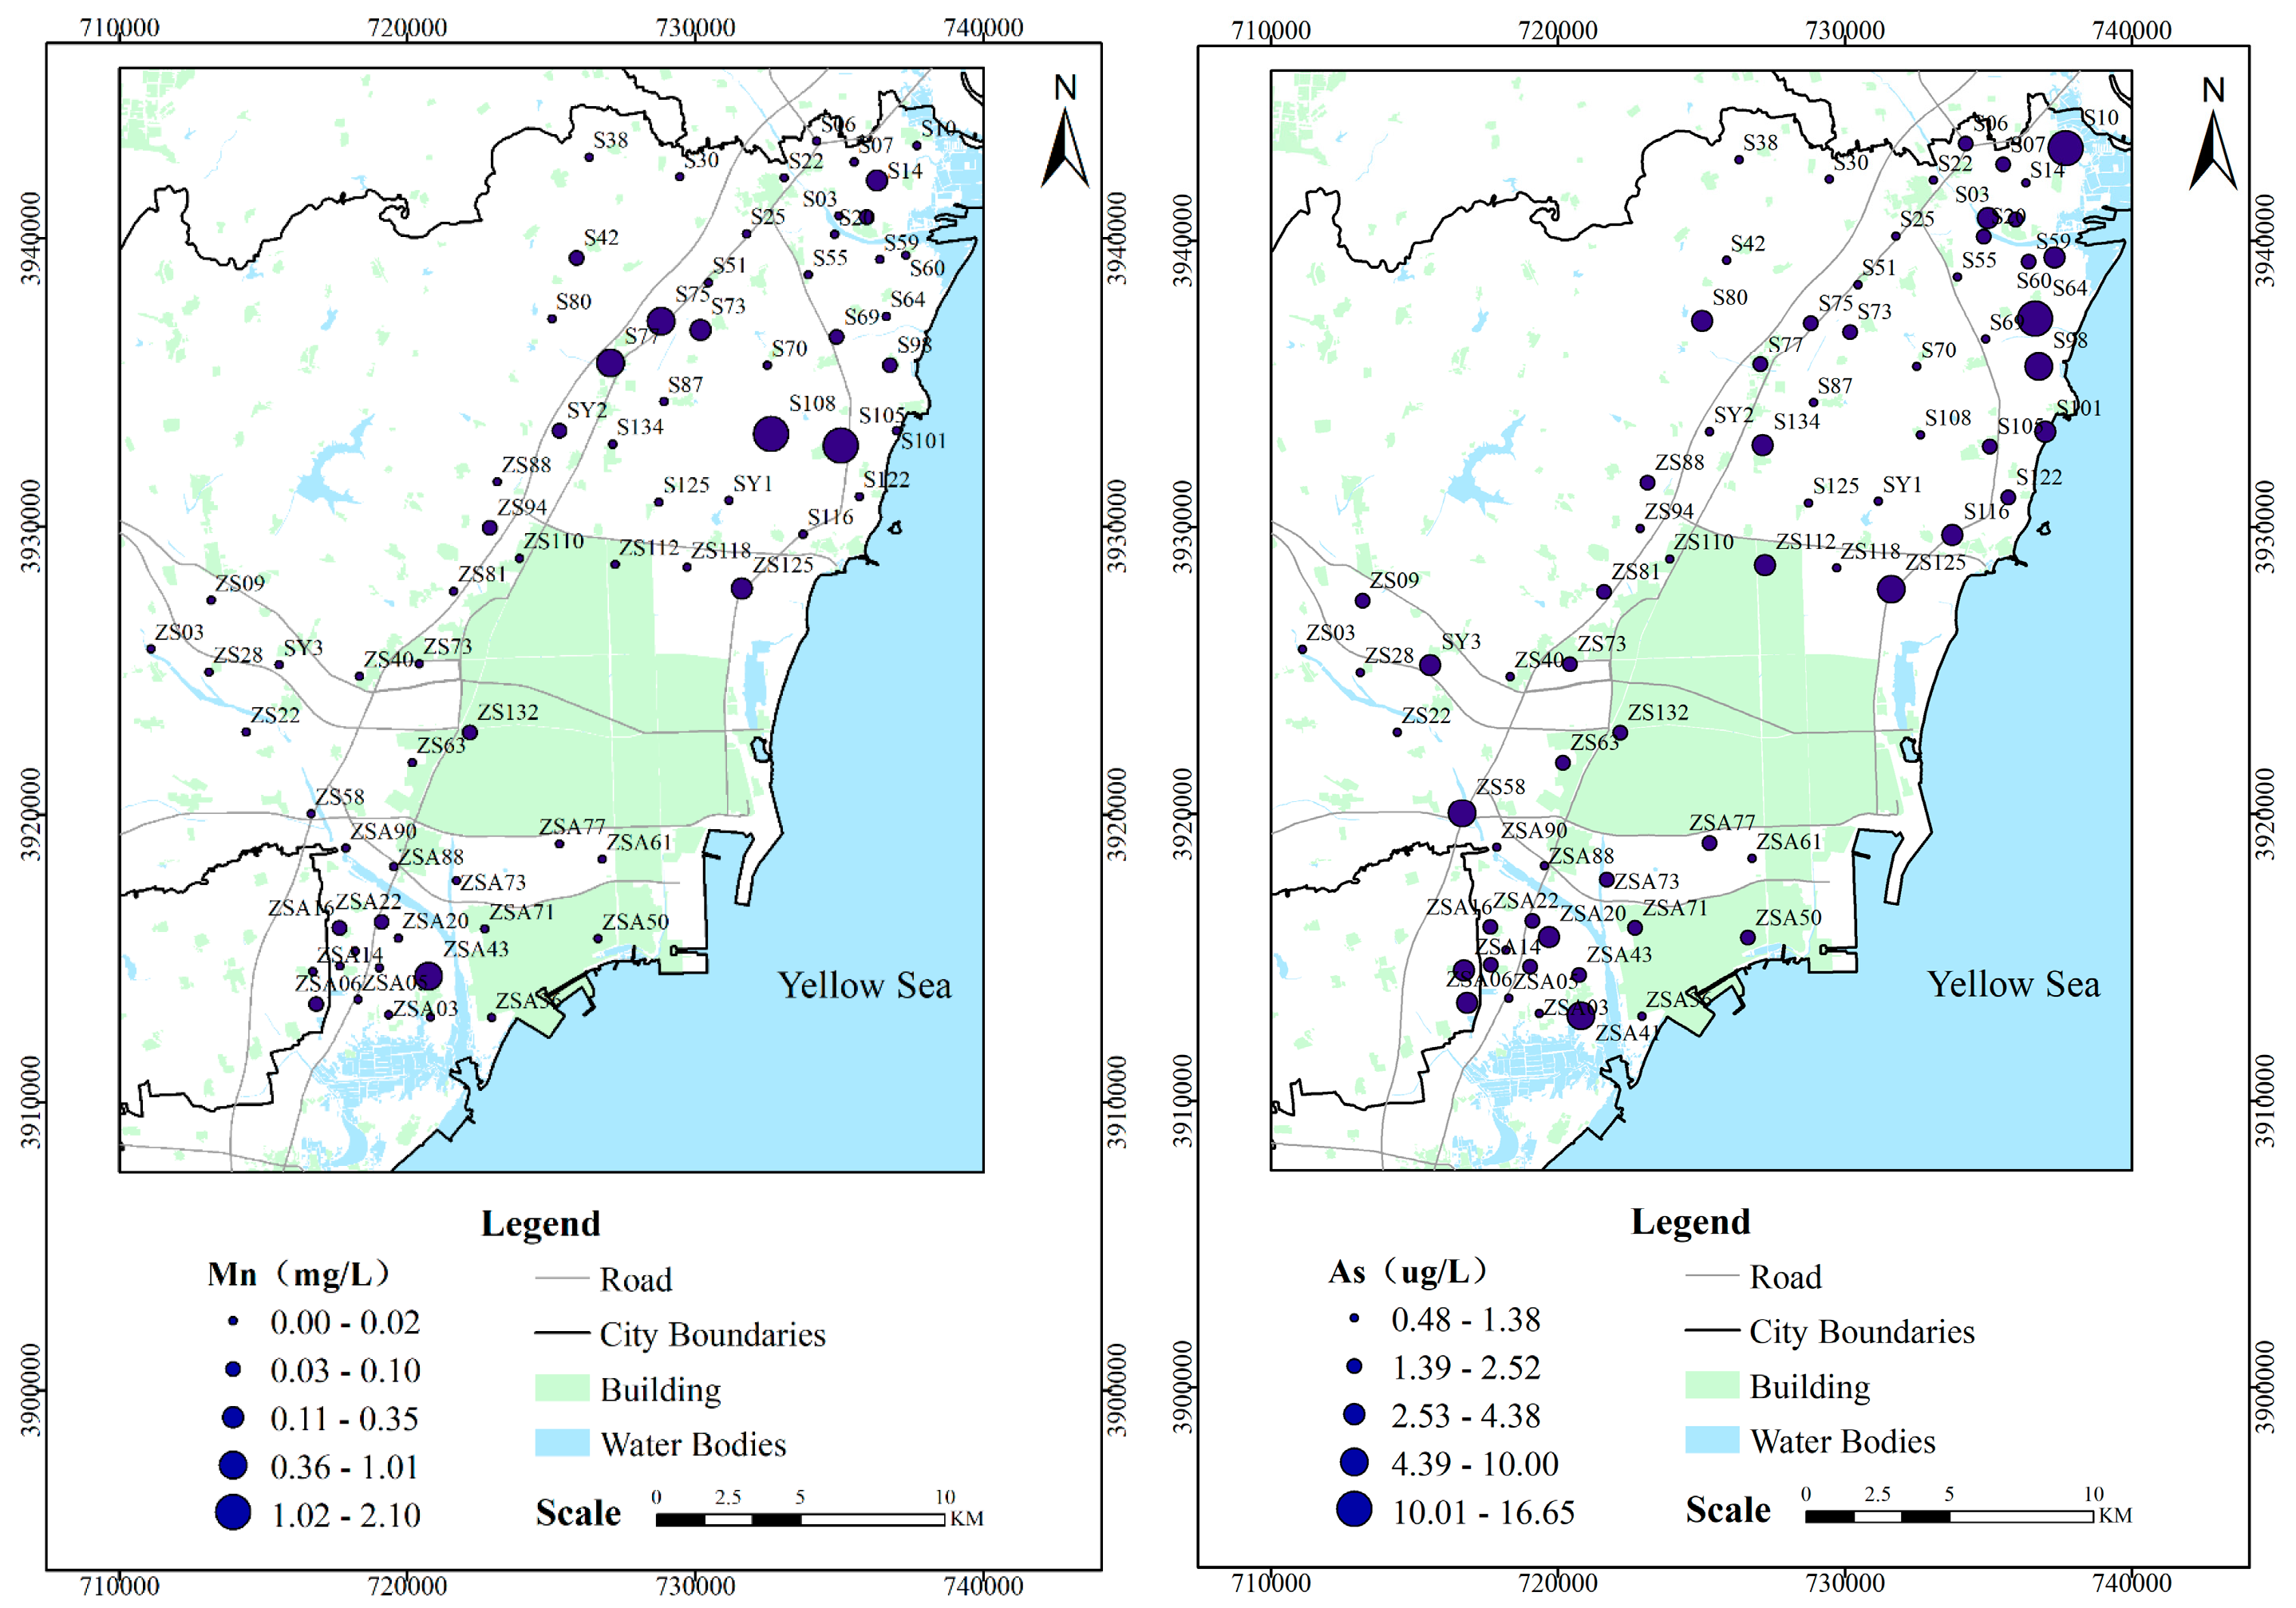
The strong positive relationships among these components supported these same sources. In the dry season, according to the distribution characteristics of Na+ and Cl−, it could be seen that the high concentration of Na+ and Cl− was mainly distributed along the Yellow Sea (Figure 4 and Figure 5), but the concentration of Na+ at only one sampling point (ZSA41) exceeded the standard for Class III groundwater. The correlation coefficient between Na+ and Cl−, Se, and TDS reached more than 95%, indicating that these components came from same pollution source. Seawater intrusion could play a significant role in the contamination process. Consequently, aquifers close to the coastal zone are at risk of potential seawater intrusion. The SO42− exceeded the standard at sampling points S134 and ZSA41. The hydrogeological investigation revealed the presence of some solid wastes in the study area, and the components in the wastes could enter the groundwater under rainfall leaching. The sampling site (ZSA41) was distributed in an industrial agglomeration area, and the water table at this site was significantly lower than the surrounding water table; therefore, seawater intrusion was very serious. At the same time, the industrial activities led to the exceedance of SO42−. The concentration of As at two sampling sites (ZSA41 and S10) in the study area exceeded 10 ug/L. On one hand, the input of anthropogenic contaminants caused the exceedance of arsenic. On the other hand, the high pH promoted the desorption of As from the sediment into the groundwater at S10. The concentration of Se exceeded 10 ug/L at only one sampling site (ZSA41), which could have been the result of human activities. The correlation coefficient of TDS with Na+ and Cl− reached 98%, suggesting that seawater intrusion contributed to the increase in TDS. Furthermore, the correlation coefficient between TDS and SO42− reached 87%, indicating that anthropogenic pollution also contributed to the high TDS. Therefore, the pollution source of elements in PC1 were explained by sea intrusion and anthropogenic activities. Mn, NH4+, and NO2− exhibited high loadings in PC2. The seepage condition in the study area was poor, and the sediments were under a relatively hypoxic environment, which offered a beneficial condition for the enrichment of Mn. NH4+ and NO2− were mainly from anthropogenic input. Ca and NO3− exhibited high loadings in PC3. The exceedance rate of NO3− reached 86%, and the correlation with other pollution components was relatively weak. The discharge of sewage and the usage of fertilizers resulted in excessive NO3− concentration. The main source of Ca was the dissolution of gypsum and anhydrite. Therefore, components in PC3 were mainly derived from natural sources and anthropogenic input. HCO3− was the main component in PC4, and HCO3− came mainly from natural sources. The concentration of Pb exceeded 10 ug/L at only one sampling site (ZSA77), which could have been caused by human activities. According to the distribution characteristics of F−, the sampling points with a high concentration of F− were distributed near the sea, and the concentration at ZSA43, S98, and S69 exceeded the limit, suggesting that seawater intrusion played a significant role in the pollution process. The high TH was mainly contributed by Ca2+ and Mg2+. Meanwhile, the correlation coefficient with TDS reached 79%, indicating a similar source to TDS. Thus, groundwater in the study area was influenced by both natural processes and human activities in the dry season.
In the wet season, the components in PC1 were similar to those in the dry season, whereas the components in PC2, PC3, and PC4 were different from those in the dry period. F− exhibited high loading in PC2. As and K+ were the main components in PC3. NH4+ and HCO3− exhibited high loadings in PC4. For most of the pollution components, the concentration in the dry season was greater than that in the wet season, indicating that rainfall reduced the concentration of ions in groundwater.
4.3. Hydrogeochemical Facies
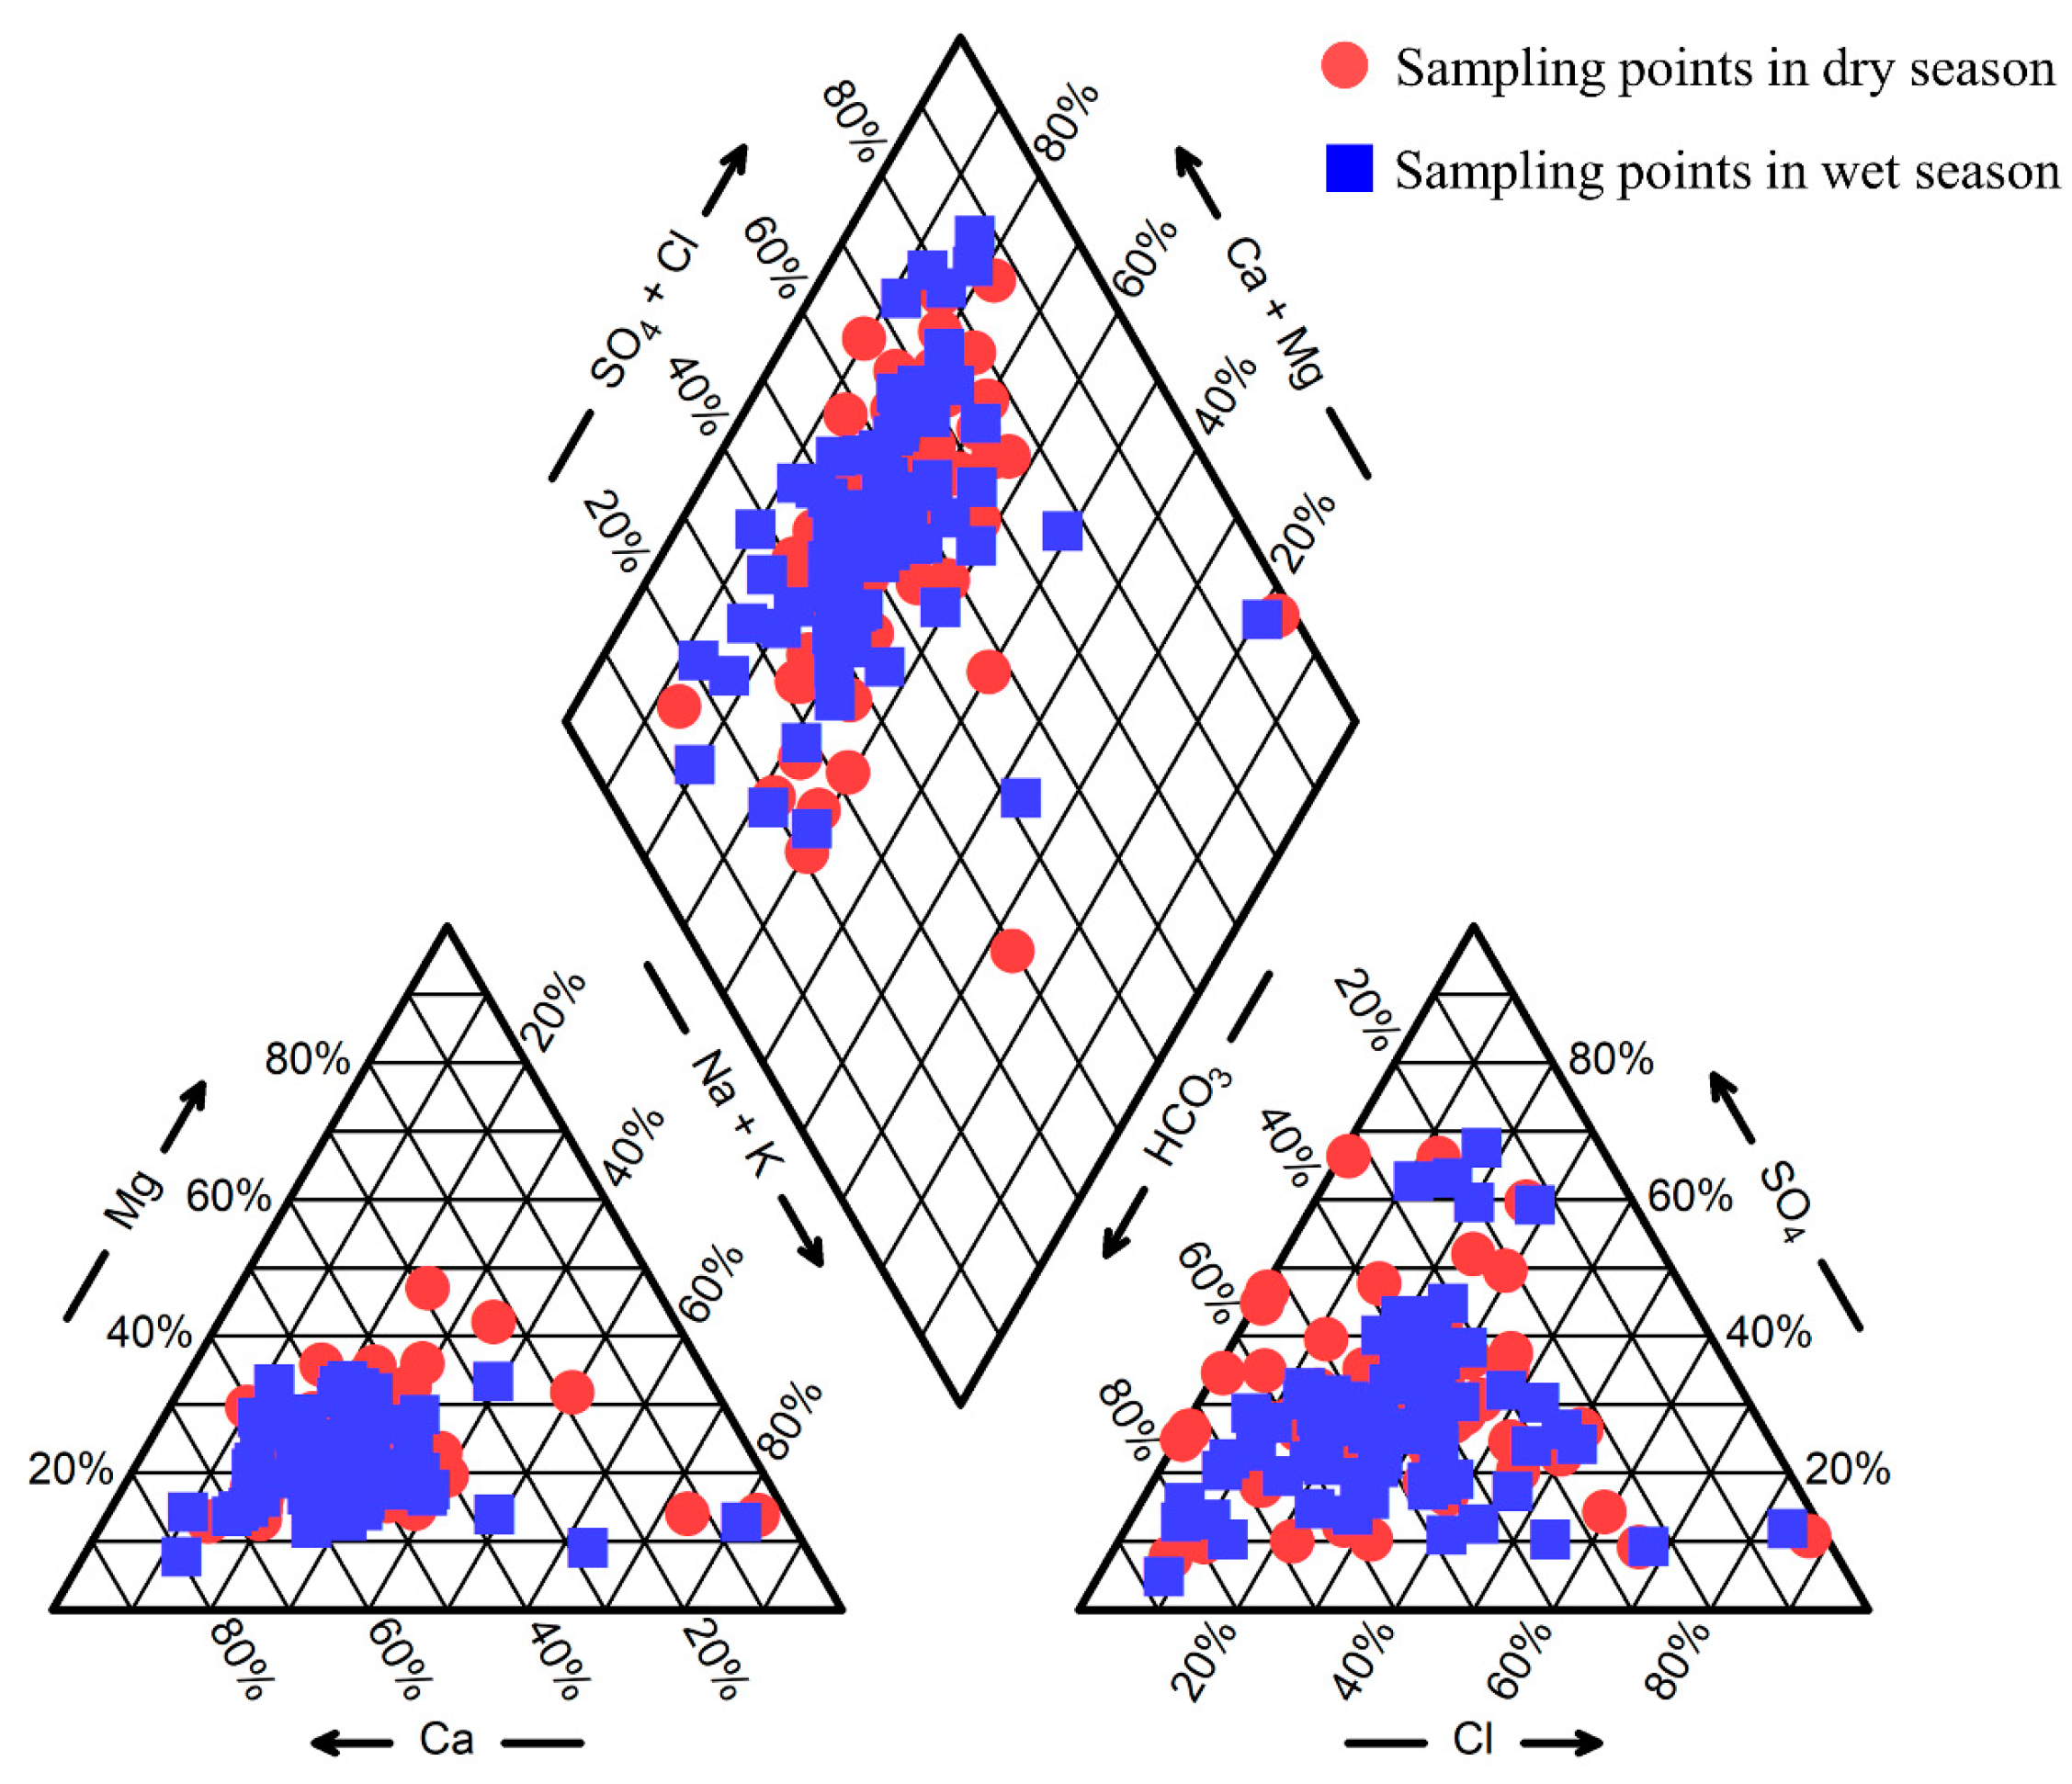
Piper diagrams can be employed to understand the chemical components of groundwater and to determine the hydrogeochemical facies [49]. All sampling points in the dry and wet seasons are plotted in Figure 6. Groundwater in the study area was mainly Ca–HCO3 type, Ca–Mg–Cl type, and Ca–Cl type, followed by Na–Cl type and Ca–Na–HCO3 type in the dry season. The hydrogeochemical facies in the wet season were similar to those in the dry season.
4.4. Mechanisms Controlling Groundwater Chemistry
Gibbs diagrams are built by drawing the ratio of Na+/(Na+ + Ca2+) and Cl−/(Cl− + HCO3−) to TDS and are extensively employed to identify hydrogeochemical processes such as precipitation, water–rock interactions, and evaporation [50]. If TDS is high and the ratio of Na+/(Na+ + Ca2+) or Cl−/(Cl− + HCO3−) is close to 1, the governing mechanism is an evaporation effect. If TDS is medium and the ratio of Na+/(Na+ + Ca2+) or Cl−/(Cl− + HCO3−) is less than 0.5, the governing mechanism is water–rock interaction. If TDS is low and the ratio of Na+/(Na+ + Ca2+) or Cl−/(Cl− + HCO3−) is close to 1, the controlling mechanism is a precipitation effect. As shown in Figure 7, most groundwater samples were distributed in the water–rock-dominant area, suggesting that water chemical components were mainly derived from the water–rock interaction in the region. One sample (ZSA41) was located in the evaporation-dominant area during the dry and wet seasons. The concentration of Na+ and Cl− at the sampling site far exceeded the Class III water standard. Therefore, it was not representative of natural interaction processes. This also reflected the impact of seawater intrusion on groundwater.
4.5. The Ratio of Major Ions
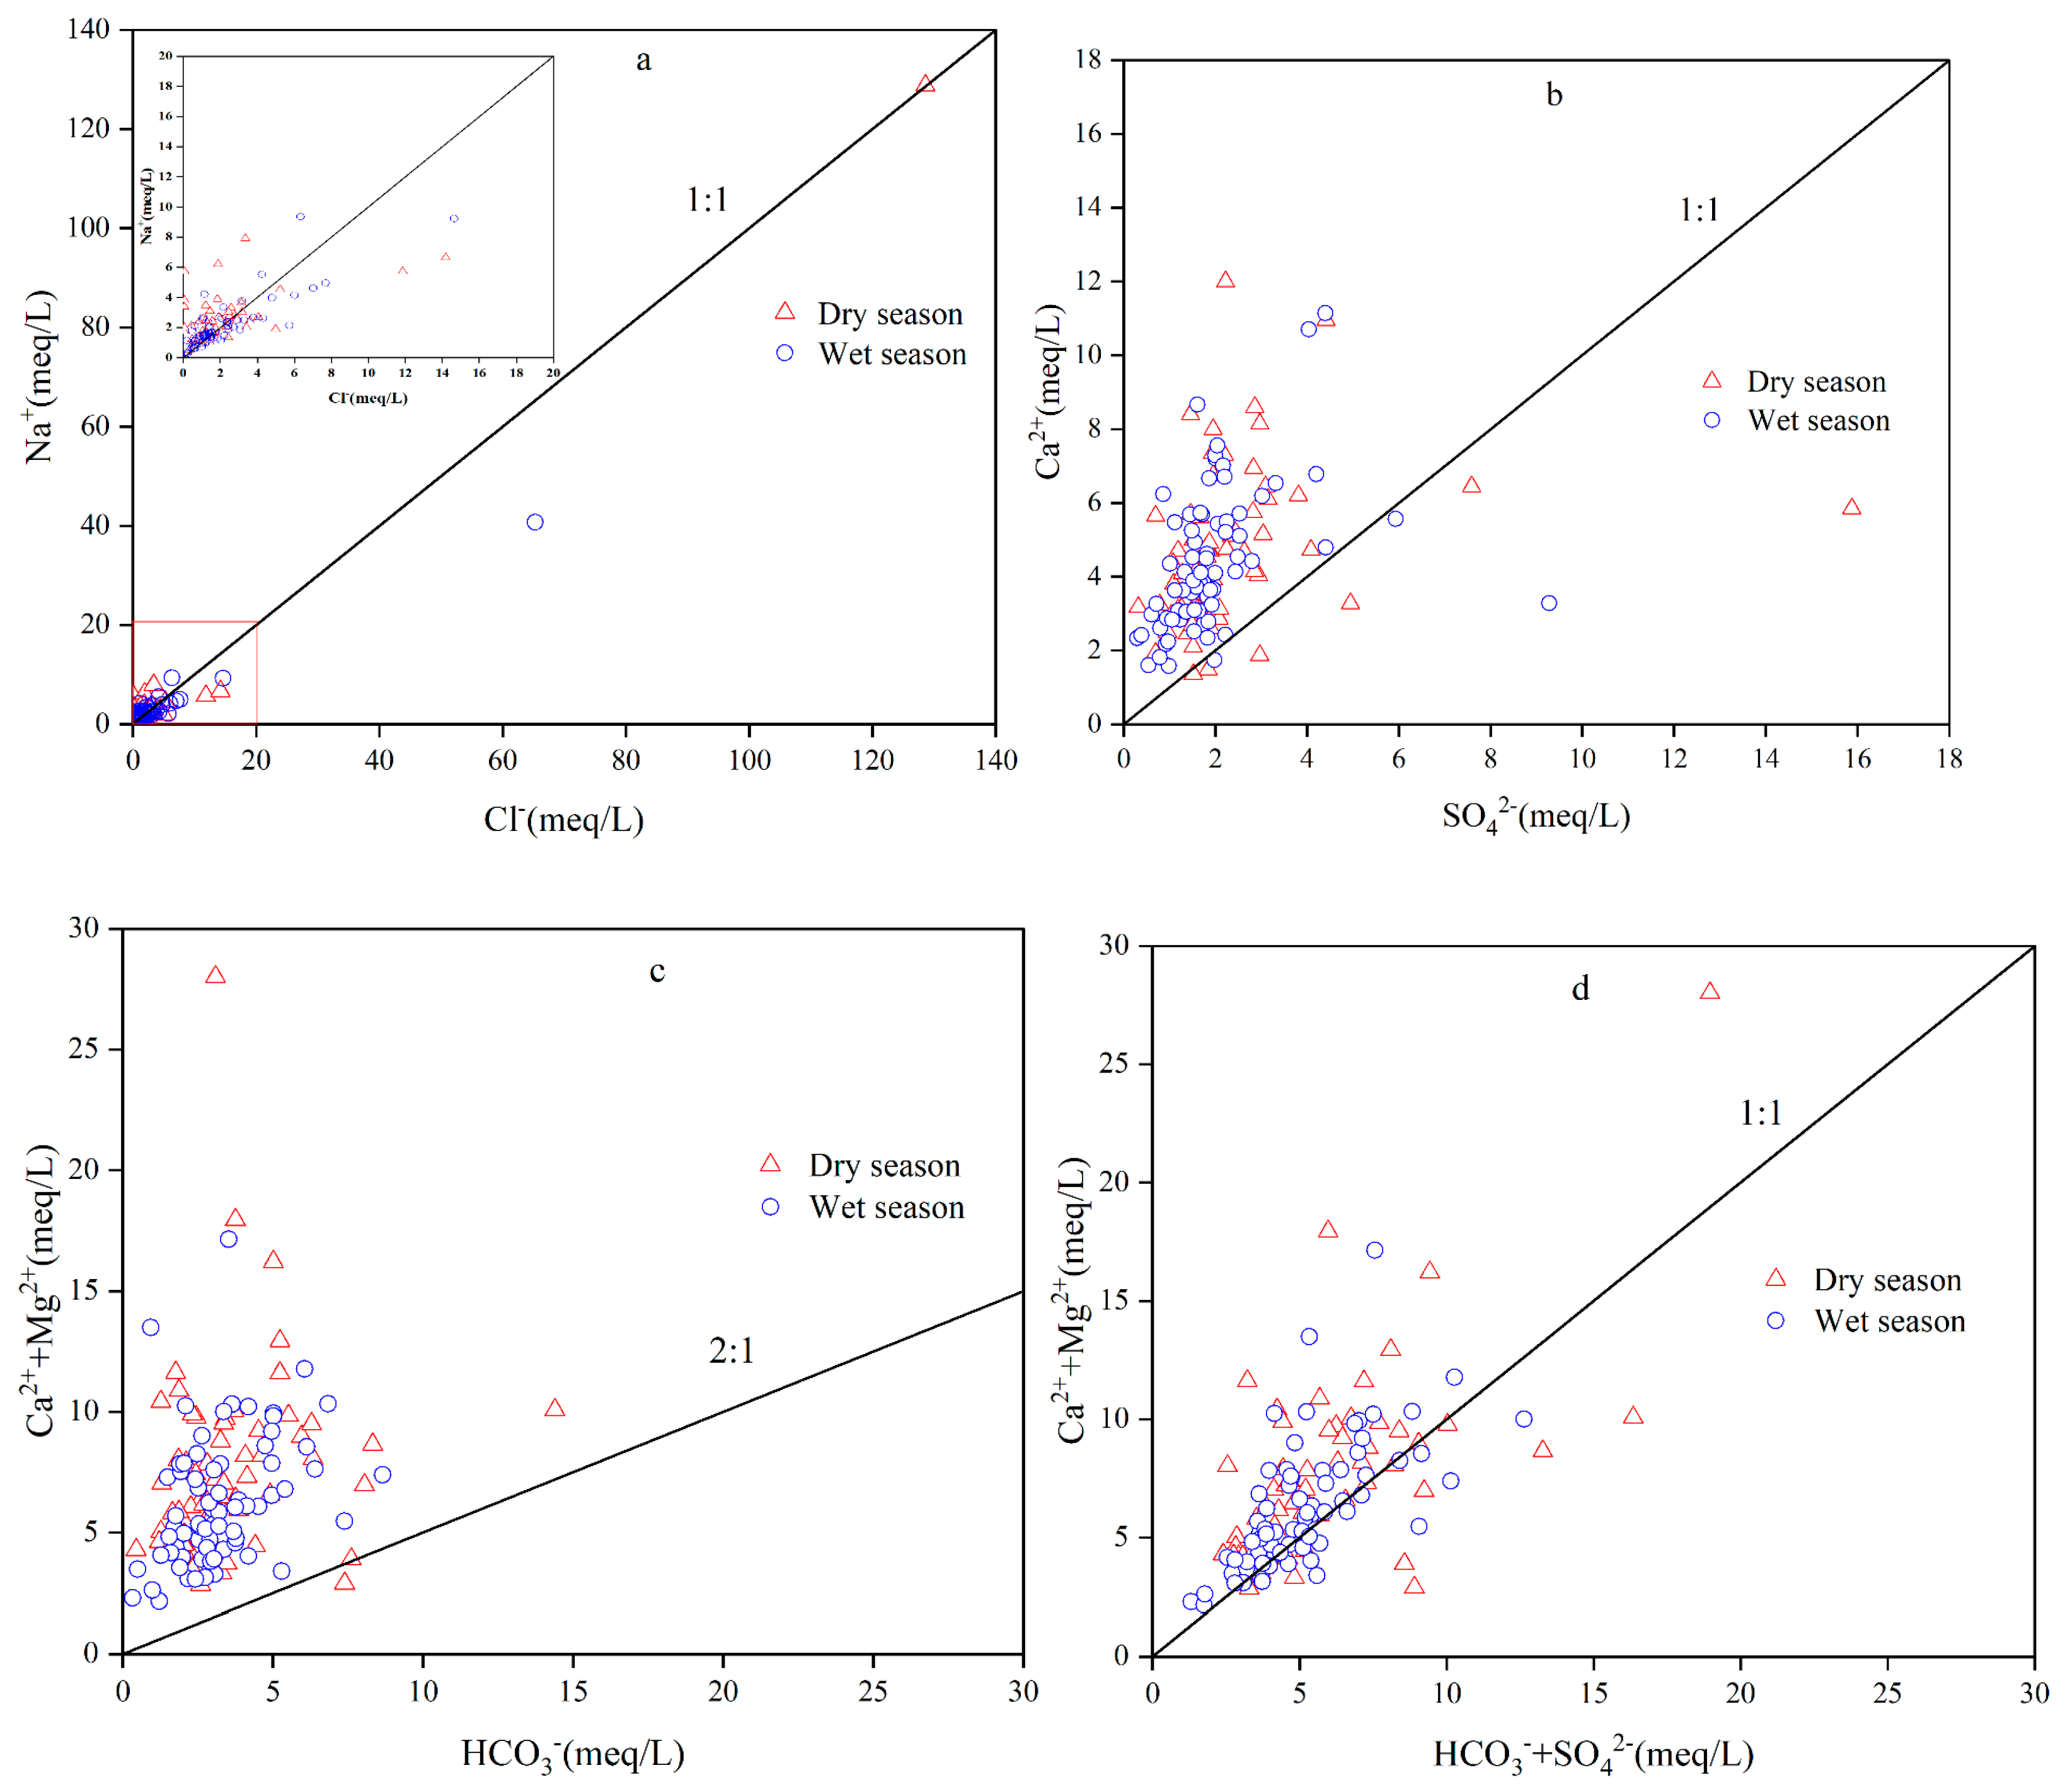
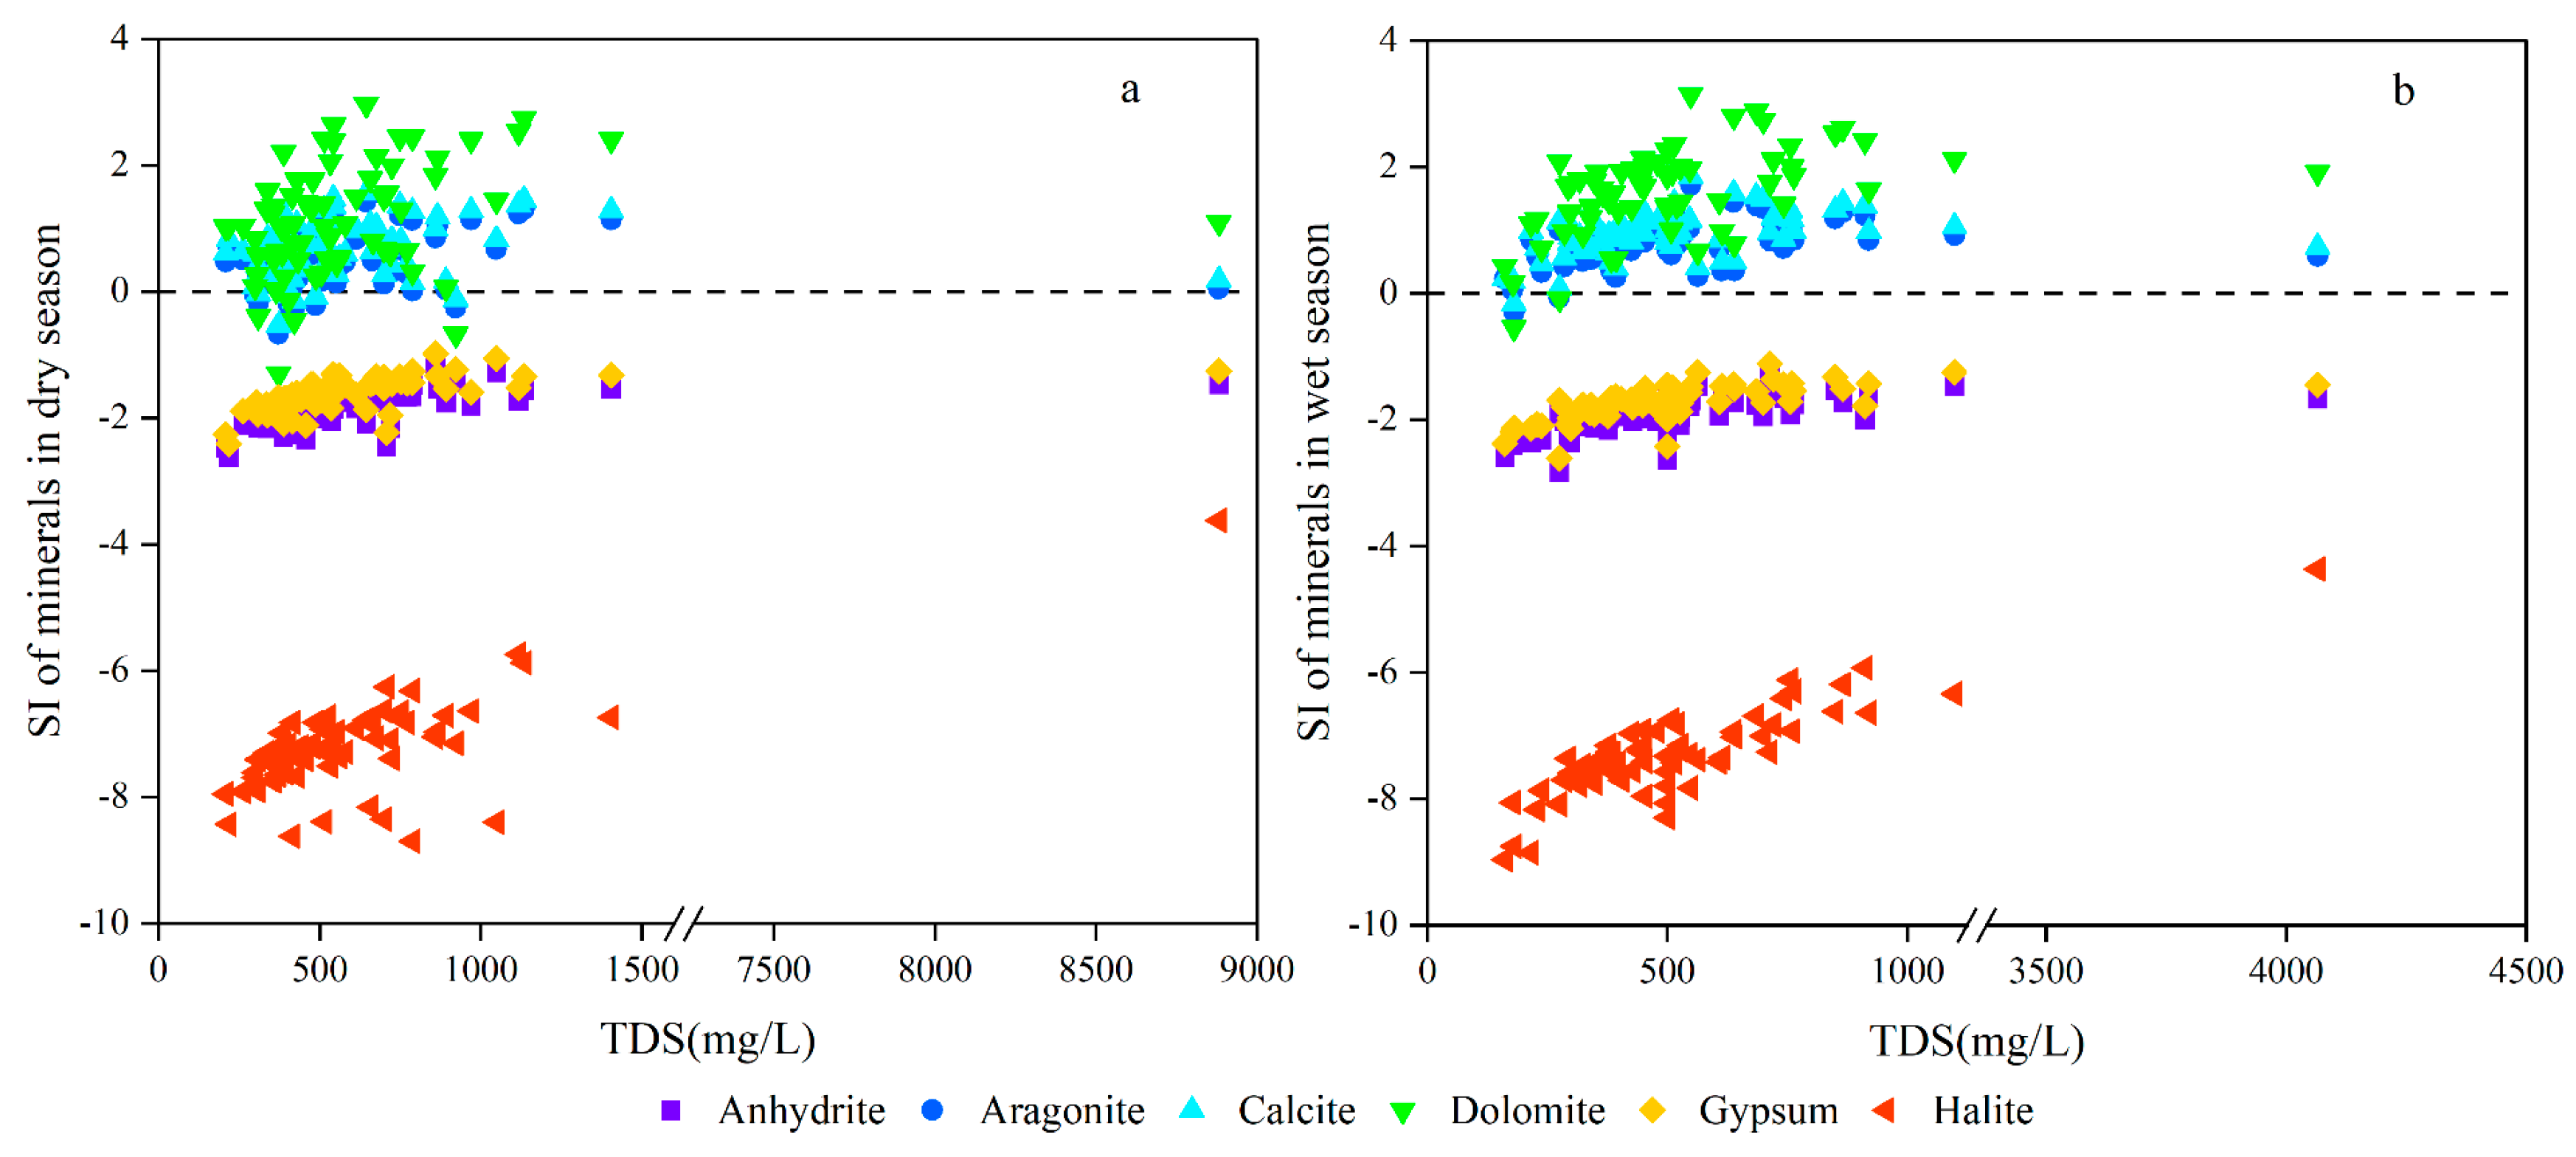
In order to investigate the details of water–rock interaction in the region, some ratio maps of major ions were performed. The relationships of Na+/Cl− for the dry season and wet season are displayed in Figure 8a. In general, if Na+ and Cl− are derived from the dissolution of halite, then the ratio of Na+/Cl− should be about equivalent to 1. If the ratio is larger than 1, then Na+ is primarily derived from silicate weathering. In this study, a ratio approximately equal to 1 was observed for most samples, indicating that the dissolution of halite was one of the sources of Na+ and Cl− during the dry and wet seasons. The saturation index showed that halite was always in the dissolved state.
The sources of Ca2+ and SO42− are commonly the dissolution of gypsum and anhydrite. Figure 8b displays that most of points were located around the 1:1 line. It could be concluded that the dissolution of gypsum and anhydrite was the main source of Ca2+ and SO42−. Some points were distributed above the Ca2+/SO42− ratio 1:1 line, suggesting that the dissolution of aragonite, calcite, and dolomite was a potential source of Ca2+ in groundwater. However, the SI of aragonite, calcite, and dolomite for most samples was higher than 0, implying that the contribution of aragonite, calcite, and dolomite to Ca2+ was limited. Therefore, the cation exchange process could have contributed to the increase in Ca2+.
The relationship between Ca2+ + Mg2+ and HCO3− can reflect the source of Ca2+ and Mg2+. In this study, the ratio of almost all samples was greater than 0.5, indicating the presence of extra sources of Ca2+ and Mg2+, with a lower contribution of carbonate dissolution to Ca2+ and Mg2+. This could be confirmed by the SI of aragonite, calcite, and dolomite (Figure 9).
The (Ca2+ + Mg2+)/(HCO3− + SO42−) relationship was plotted to characterize the mineralization processes. The plot showed that most points were distributed around the 1:1 line. As mentioned above, the contribution of carbonate dissolution was small; therefore, the dissolution of sulfate minerals was the primary source. Therefore, it could be concluded that the dissolution of gypsum and anhydrite was a significant source of major ions.
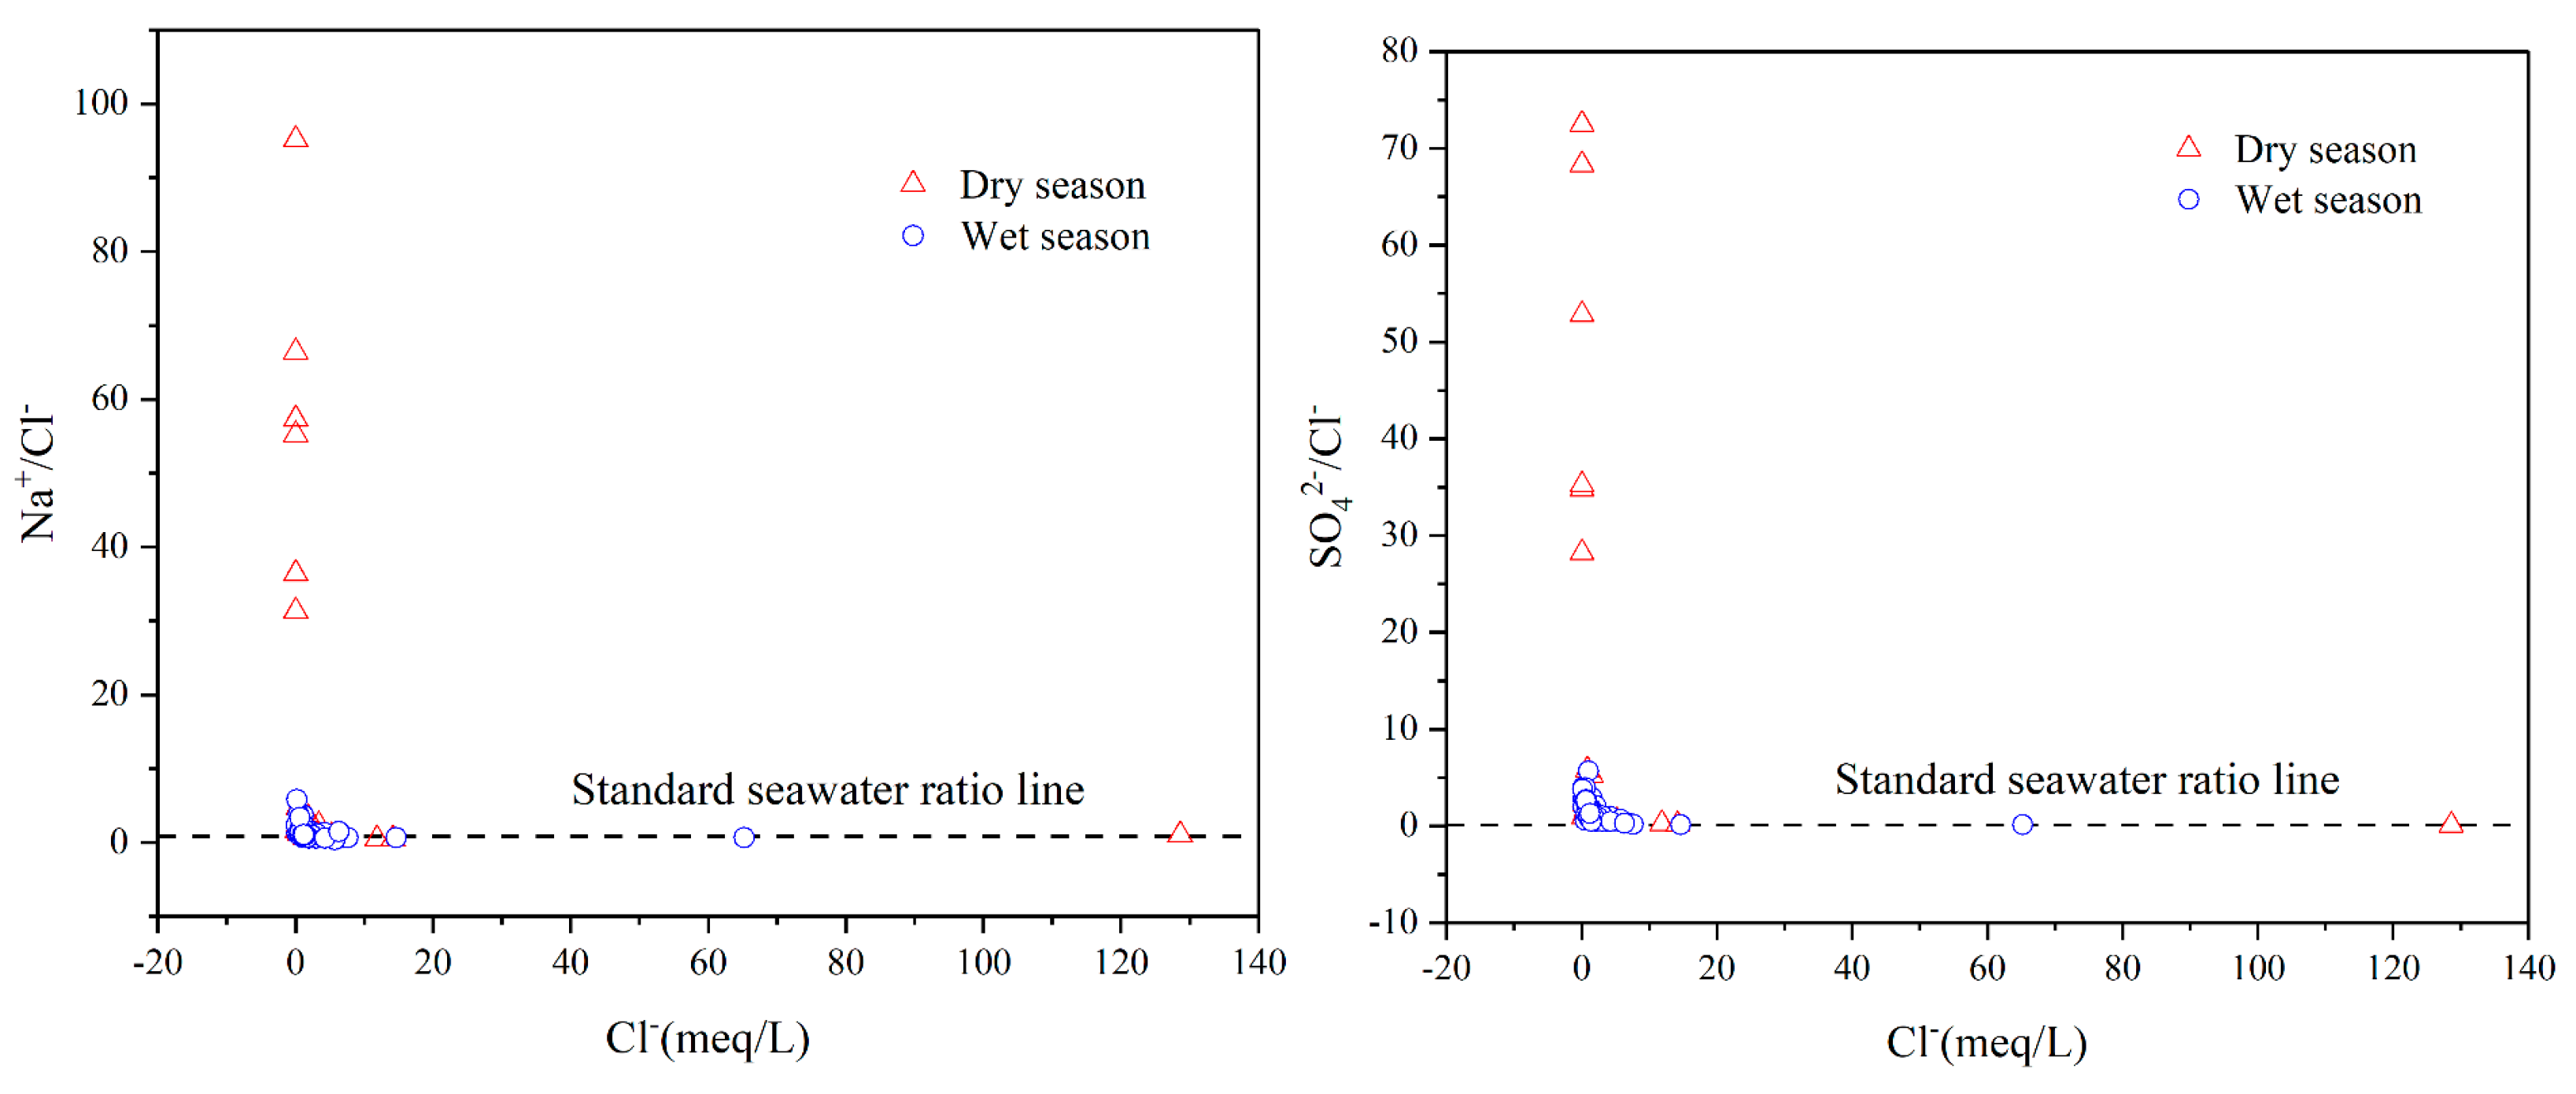
The (Na+/Cl−)/Cl− and (SO42−/Cl−)/Cl− ratios can be used to study the degree of mixing of groundwater with seawater and the dissolution of minerals (Figure 10). Most sampling points were located above the standard seawater ratio line (Na+/Cl− = 0.85), suggesting a contribution of mineral dissolution to the whole solute loading. Most sampling points were located above the standard seawater ratio line (Na+/Cl− = 0.11), showing some enrichment of sulfate.
4.6. Seawater Fraction in Groundwater
In order to better characterize the process of seawater mixing into groundwater, the contribution of seawater needs to be calculated. Since Cl− does not react with other ions or minerals, the contribution of seawater in groundwater can be evaluated by using Cl− as a tracer. The following formula is employed to calculate the proportion of seawater [7]:
where indicates the level of the sample, indicates the level of Cl− in seawater, and indicates the level of Cl− in freshwater.
The findings demonstrated that the contributions of seawater to groundwater were minimal. During the dry season, the contribution of seawater was greater than 1% at only three sampling sites: S101 (2.2%), S116 (2.6%), and ZSA41 (23.6%). The contribution of seawater to groundwater was less than 1% for the remaining sampling sites. During the wet season, the contribution of seawater was greater than 1% at seven sampling sites: S98 (2.7%), S101 (1.3%), S105 (1.1%), S116 (1.4%), SY3 (1.0%), ZSA41 (12.0%), and ZSA50 (1.2%). The contribution of seawater to groundwater was less than 1% for the remaining sampling sites. It could be concluded that the influence of seawater intrusion on groundwater was not serious.
5. Practical Implications and Perspectives
Groundwater contamination in coastal aquifers is a serious problem around the world. The pollution of coastal aquifers is not only from seawater intrusion, but usually includes pollution from human activities. Therefore, when managing groundwater in coastal aquifers, it is important to not only control groundwater extraction, but also to focus on pollution sources from human activities. Moreover, the pollution sources usually include natural processes and anthropogenic activities.
6. Conclusions
Groundwater contamination is a widespread problem in coastal aquifers. In this study, the sources of contaminants in the coastal zone were identified. Meanwhile, the control processes of hydrogeochemistry were discussed in detail. The below conclusions could be drawn.
Pollution components included Na+, NH4+, Cl−, SO42−, NO3−, NO2−, Pb, As, Se, TDS, TH, F−, and Mn. The groundwater quality was influenced by both natural processes and anthropogenic activities. Na+ and Cl− originated from the dissolution of halite and sea intrusion. Mg2+ and Ca2+ were derived from the dissolution of gypsum and anhydrite, as well as cation exchange processes. The discharge of sewage and the utilization of fertilizers led to the contamination of nitrogen in groundwater. The high SO42− was most likely due to the leaching of waste by rainfall. The exceedance of As was caused by anthropogenic inputs and natural factors. The poor seepage conditions and anoxic conditions provided a beneficial condition for the enrichment of Mn. High Pb and Se resulted from anthropogenic activities. The concentration of most components in the dry season was larger than that in the wet season. The seasonal variations were significant due to the influence of precipitation.
Groundwater chemistry was mainly Ca–HCO3 type, Ca–Mg–Cl type, and Ca–Cl type, followed by Na–Cl type and Ca–Na–HCO3 type in the dry season. The hydrogeochemical facies in the wet season were similar to those in the dry season. The groundwater chemistry was influenced by natural processes and anthropogenic activities.
The impact of seawater intrusion on groundwater was not serious. The high level of Na+ and Cl− at some points was the result of seawater intrusion caused by extensive groundwater exploitation.
In the future, numerical simulations of coastal aquifers will be carried out, which will make it possible both to calculate the exchange of groundwater with seawater and to analyze the migration processes of pollutants.
Supplementary Materials
The following supporting information can be downloaded at: https://www.mdpi.com/article/10.3390/w15091710/s1.
Author Contributions
Conceptualization, G.A. and R.F.; writing—original draft, G.A.; supervision, R.F., H.K., D.X. and J.L.; data analysis, G.A. and H.K. All authors read and agreed to the published version of the manuscript.
Funding
This research received no external funding.
Institutional Review Board Statement
No.
Informed Consent Statement
Informed consent was obtained from all subjects involved in the study.
Data Availability Statement
Data is unavailable.
Acknowledgments
The authors thank the reviewers for their comments.
Conflicts of Interest
The authors declare no conflict of interest.
References
- Kim, J.-H.; Kim, K.-H.; Thao, N.T.; Batsaikhan, B.; Yun, S.-T. Hydrochemical assessment of freshening saline groundwater using multiple end-members mixing modeling: A study of Red River delta aquifer, Vietnam. J. Hydrol. 2017, 549, 703–714. [Google Scholar] [CrossRef]
- Lee, K.-J.; Yun, S.-T.; Yu, S.; Kim, K.-H.; Lee, J.-H.; Lee, S.-H. The combined use of self-organizing map technique and fuzzy c-means clustering to evaluate urban groundwater quality in Seoul metropolitan city, South Korea. J. Hydrol. 2019, 569, 685–697. [Google Scholar] [CrossRef]
- Haselbeck, V.; Kordilla, J.; Krause, F.; Sauter, M. Self-organizing maps for the identification of groundwater salinity sources based on hydrochemical data. J. Hydrol. 2019, 576, 610–619. [Google Scholar] [CrossRef]
- Custodio, E. Coastal aquifers of Europe: An overview. Hydrogeol. J. 2010, 18, 269–280. [Google Scholar] [CrossRef]
- Qiao, W.; Guo, H.; He, C.; Shi, Q.; Xiu, W.; Zhao, B. Molecular Evidence of Arsenic Mobility Linked to Biodegradable Organic Matter. Environ. Sci. Technol. 2020, 54, 7280–7290. [Google Scholar] [CrossRef]
- Guo, H.; Zhou, Y.; Jia, Y.; Tang, X.; Li, X.; Shen, M.; Lu, H.; Han, S.; Wei, C.; Norra, S.; et al. Sulfur Cycling-Related Biogeochemical Processes of Arsenic Mobilization in the Western Hetao Basin, China: Evidence from Multiple Isotope Approaches. Environ. Sci. Technol. 2016, 50, 12650–12659. [Google Scholar] [CrossRef]
- Korrai, S.; Gangu, K.K.; Prasada Rao, P.V.V.; Jonnalagadda, S.B. A study on assessment of vulnerability of seawater intrusion to groundwater in coastal areas of Visakhapatnam, India. Environ. Dev. Sustain. 2021, 23, 5937–5955. [Google Scholar] [CrossRef]
- Chen, R.; Teng, Y.; Chen, H.; Hu, B.; Yue, W. Groundwater pollution and risk assessment based on source apportionment in a typical cold agricultural region in Northeastern China. Sci. Total Environ. 2019, 696, 133972. [Google Scholar] [CrossRef]
- Yang, Q.; Li, Z.; Lu, X.; Duan, Q.; Huang, L.; Bi, J. A review of soil heavy metal pollution from industrial and agricultural regions in China: Pollution and risk assessment. Sci. Total Environ. 2018, 642, 690–700. [Google Scholar] [CrossRef] [PubMed]
- Ran, H.; Guo, Z.; Yi, L.; Xiao, X.; Zhang, L.; Hu, Z.; Li, C.; Zhang, Y. Pollution characteristics and source identification of soil metal(loid)s at an abandoned arsenic-containing mine, China. J. Hazard. Mater. 2021, 413, 125382. [Google Scholar] [CrossRef]
- Chen, G.; Xiong, G.; Lin, J.; Xu, X.; Yu, H.; Liu, W.; Fu, T.; Su, Q.; Wang, Y.; Dai, Y.; et al. Elucidating the Pollution Sources and Groundwater Evolution in Typical Seawater Intrusion Areas Using Hydrochemical and Environmental Stable Isotope Technique: A Case Study for Shandong Province, China. Lithosphere 2021, 2021, 4227303. [Google Scholar] [CrossRef]
- de Graaf, I.E.M.; Gleeson, T.; van Beek, L.P.H.; Sutanudjaja, E.H.; Bierkens, M.F.P. Environmental flow limits to global groundwater pumping. Nature 2019, 574, 90–94. [Google Scholar] [CrossRef] [PubMed]
- Han, D.; Currell, M.J. Review of drivers and threats to coastal groundwater quality in China. Sci. Total Environ. 2022, 806, 150913. [Google Scholar] [CrossRef] [PubMed]
- Johnson, J.M.; Moore, L.J.; Ells, K.; Murray, A.B.; Adams, P.N.; MacKenzie Iii, R.A.; Jaeger, J.M. Recent shifts in coastline change and shoreline stabilization linked to storm climate change. Earth Surf. Process. Landf. 2015, 40, 569–585. [Google Scholar] [CrossRef]
- Ping, Y.; Xiao-yong, D.; Fei, G.; Mei-na, L.; Sheng-hua, L.; Jian-dong, Q.; Liang-yong, Z. Coastal erosion in Shandong of China: Status and protection challenges. China Geol. 2018, 1, 512–521. [Google Scholar] [CrossRef]
- Balasubramanian, M.; Sridhar, S.G.D.; Ayyamperumal, R.; Karuppannan, S.; Gopalakrishnan, G.; Chakraborty, M.; Huang, X. Isotopic signatures, hydrochemical and multivariate statistical analysis of seawater intrusion in the coastal aquifers of Chennai and Tiruvallur District, Tamil Nadu, India. Mar. Pollut. Bull. 2022, 174, 113232. [Google Scholar] [CrossRef]
- Daniele, L.; Tardani, D.; Schmidlin, D.; Quiroga, I.; Cannatelli, C.; Somma, R. Seawater intrusion and hydrogeochemical processes in the Ischia Island groundwater system. J. Geochem. Explor. 2022, 234, 106935. [Google Scholar] [CrossRef]
- Satheeskumar, V.; Subramani, T.; Lakshumanan, C.; Roy, P.D.; Karunanidhi, D. Groundwater chemistry and demarcation of seawater intrusion zones in the Thamirabarani delta of south India based on geochemical signatures. Environ. Geochem. Health 2021, 43, 757–770. [Google Scholar] [CrossRef]
- Chen, H.; Zhang, Y.; Wang, X.; Ren, Z.; Li, L. Salt-Water Intrusion in the Lower Reaches of the Weihe River, Shandong Province, China. Hydrogeol. J. 1997, 5, 82–88. [Google Scholar] [CrossRef]
- Barker, A.P.; Newton, R.J.; Bottrell, S.H.; Tellam, J.H. Processes affecting groundwater chemistry in a zone of saline intrusion into an urban sandstone aquifer. Appl. Geochem. 1998, 13, 735–749. [Google Scholar] [CrossRef]
- Barlow, P.M.; Reichard, E.G. Saltwater intrusion in coastal regions of North America. Hydrogeol. J. 2010, 18, 247–260. [Google Scholar] [CrossRef]
- Salem, Z.E.; ElNahrawy, A.; Attiah, A.M.; Edokpayi, J.N. Vertical and spatial evaluation of the groundwater chemistry in the Central Nile Delta Quaternary aquifer to assess the effects of human activities and seawater intrusion. Front. Environ. Sci. 2022, 10. [Google Scholar] [CrossRef]
- Argamasilla, M.; Barberá, J.A.; Andreo, B. Factors controlling groundwater salinization and hydrogeochemical processes in coastal aquifers from southern Spain. Sci. Total Environ. 2017, 580, 50–68. [Google Scholar] [CrossRef] [PubMed]
- Mollema, P.N.; Antonellini, M.; Dinelli, E.; Gabbianelli, G.; Greggio, N.; Stuyfzand, P.J. Hydrochemical and physical processes influencing salinization and freshening in Mediterranean low-lying coastal environments. Appl. Geochem. 2013, 34, 207–221. [Google Scholar] [CrossRef]
- Galliari, J.; Santucci, L.; Misseri, L.; Carol, E.; Alvarez, M.d.P. Processes controlling groundwater salinity in coastal wetlands of the southern edge of South America. Sci. Total Environ. 2021, 754, 141951. [Google Scholar] [CrossRef] [PubMed]
- Carreira, P.M.; Marques, J.M.; Nunes, D. Source of groundwater salinity in coastline aquifers based on environmental isotopes (Portugal): Natural vs. human interference. A review and reinterpretation. Appl. Geochem. 2014, 41, 163–175. [Google Scholar] [CrossRef]
- Han, D.M.; Song, X.F.; Currell, M.J.; Yang, J.L.; Xiao, G.Q. Chemical and isotopic constraints on evolution of groundwater salinization in the coastal plain aquifer of Laizhou Bay, China. J. Hydrol. 2014, 508, 12–27. [Google Scholar] [CrossRef]
- Xiao, J.; Wang, L.; Chai, N.; Liu, T.; Jin, Z.; Rinklebe, J. Groundwater hydrochemistry, source identification and pollution assessment in intensive industrial areas, eastern Chinese loess plateau. Environ. Pollut. 2021, 278, 116930. [Google Scholar] [CrossRef]
- Quino Lima, I.; Ramos Ramos, O.; Ormachea Muñoz, M.; Quintanilla Aguirre, J.; Duwig, C.; Maity, J.P.; Sracek, O.; Bhattacharya, P. Spatial dependency of arsenic, antimony, boron and other trace elements in the shallow groundwater systems of the Lower Katari Basin, Bolivian Altiplano. Sci. Total Environ. 2020, 719, 137505. [Google Scholar] [CrossRef]
- Dai, L.; Wang, L.; Li, L.; Liang, T.; Zhang, Y.; Ma, C.; Xing, B. Multivariate geostatistical analysis and source identification of heavy metals in the sediment of Poyang Lake in China. Sci. Total Environ. 2018, 621, 1433–1444. [Google Scholar] [CrossRef]
- Alshehri, F.; Almadani, S.; El-Sorogy, A.S.; Alwaqdani, E.; Alfaifi, H.J.; Alharbi, T. Influence of seawater intrusion and heavy metals contamination on groundwater quality, Red Sea coast, Saudi Arabia. Mar. Pollut. Bull. 2021, 165, 112094. [Google Scholar] [CrossRef]
- Unglert, K.; Radić, V.; Jellinek, A.M. Principal component analysis vs. self-organizing maps combined with hierarchical clustering for pattern recognition in volcano seismic spectra. J. Volcanol. Geotherm. Res. 2016, 320, 58–74. [Google Scholar] [CrossRef]
- Underwood, K.L.; Rizzo, D.M.; Schroth, A.W.; Dewoolkar, M.M. Evaluating Spatial Variability in Sediment and Phosphorus Concentration-Discharge Relationships Using Bayesian Inference and Self-Organizing Maps. Water Resour. Res. 2017, 53, 10293–10316. [Google Scholar] [CrossRef]
- Petelet-Giraud, E.; Négrel, P.; Aunay, B.; Ladouche, B.; Bailly-Comte, V.; Guerrot, C.; Flehoc, C.; Pezard, P.; Lofi, J.; Dörfliger, N. Coastal groundwater salinization: Focus on the vertical vriability in a multi-layered aquifer through a multi-isotope fingerprinting (Roussillon Basin, France). Sci. Total Environ. 2016, 566-567, 398–415. [Google Scholar] [CrossRef]
- Hao, C.; Zhang, W.; Gui, H. Hydrogeochemistry characteristic contrasts between low- and high-antimony in shallow drinkable groundwater at the largest antimony mine in hunan province, China. Appl. Geochem. 2020, 117, 104584. [Google Scholar] [CrossRef]
- Lone, S.A.; Jeelani, G.; Mukherjee, A.; Coomar, P. Geogenic groundwater arsenic in high altitude bedrock aquifers of upper Indus river basin (UIRB), Ladakh. Appl. Geochem. 2020, 113, 104497. [Google Scholar] [CrossRef]
- Chen, W.; Zhang, Y.; Shi, W.; Cui, Y.; Zhang, Q.; Shi, Y.; Liang, Z. Analysis of Hydrogeochemical Characteristics and Origins of Chromium Contamination in Groundwater at a Site in Xinxiang City, Henan Province. Appl. Sci. 2021, 11, 11683. [Google Scholar] [CrossRef]
- Xiao, Y.; Gu, X.; Yin, S.; Pan, X.; Shao, J.; Cui, Y. Investigation of Geochemical Characteristics and Controlling Processes of Groundwater in a Typical Long-Term Reclaimed Water Use Area. Water 2017, 9, 800. [Google Scholar] [CrossRef]
- Tanasković, I.; Golobocanin, D.; Miljević, N. Multivariate statistical analysis of hydrochemical and radiological data of Serbian spa waters. J. Geochem. Explor. 2012, 112, 226–234. [Google Scholar] [CrossRef]
- Kai, Z.; Jing-xian, Q.; Yi, C.; Bai-heng, M.; Li, Y.; Hua-ming, G.; Xin-zhou, W.; Lin-ying, W.; Hai-tao, L. Hydrogeochemical characteristics of groundwater and pore-water and the paleoenvironmental evolution in the past 3.10 Ma in the Xiong’an New Area, North China. China Geol. 2021, 4, 476–486. [Google Scholar] [CrossRef]
- Liu, J.; Tokunaga, T. Future Risks of Tsunami-Induced Seawater Intrusion Into Unconfined Coastal Aquifers: Insights From Numerical Simulations at Niijima Island, Japan. Water Resour. Res. 2019, 55, 10082–10104. [Google Scholar] [CrossRef]
- Xu, Z.; Hu, B.X. Development of a discrete-continuum VDFST-CFP numerical model for simulating seawater intrusion to a coastal karst aquifer with a conduit system. Water Resour. Res. 2017, 53, 688–711. [Google Scholar] [CrossRef]
- Miao, T.; Huang, H.; Guo, J.; Li, G.; Zhang, Y.; Chen, N. Uncertainty Analysis of Numerical Simulation of Seawater Intrusion Using Deep Learning-Based Surrogate Model. Water 2022, 14, 2933. [Google Scholar] [CrossRef]
- Yechieli, Y.; Kafri, U.; Goldman, M.; Voss, C. Factors controlling the configuration of the fresh–saline water interface in the Dead Sea coastal aquifers: Synthesis of TDEM surveys and numerical groundwater modeling. Hydrogeol. J. 2001, 9, 367–377. [Google Scholar] [CrossRef]
- Ibrahim, H.; Yaseen, Z.M.; Scholz, M.; Ali, M.; Gad, M.; Elsayed, S.; Khadr, M.; Hussein, H.; Ibrahim, H.H.; Eid, M.H.; et al. Evaluation and Prediction of Groundwater Quality for Irrigation Using an Integrated Water Quality Indices, Machine Learning Models and GIS Approaches: A Representative Case Study. Water 2023, 15, 694. [Google Scholar] [CrossRef]
- Gad, M.; El Osta, M. Geochemical controlling mechanisms and quality of the groundwater resources in El Fayoum Depression, Egypt. Arab. J. Geosci. 2020, 13, 861. [Google Scholar] [CrossRef]
- El Osta, M.; Masoud, M.; Alqarawy, A.; Elsayed, S.; Gad, M. Groundwater Suitability for Drinking and Irrigation Using Water Quality Indices and Multivariate Modeling in Makkah Al-Mukarramah Province, Saudi Arabia. Water 2022, 14, 483. [Google Scholar] [CrossRef]
- Zhu, G.; Wu, X.; Ge, J.; Liu, F.; Zhao, W.; Wu, C. Influence of mining activities on groundwater hydrochemistry and heavy metal migration using a self-organizing map (SOM). J. Clean. Prod. 2020, 257, 120664. [Google Scholar] [CrossRef]
- Piper, A.M. A graphic procedure in the geochemical interpretation of water-analyses. Eos Trans. Am. Geophys. Union 1944, 25, 914–928. [Google Scholar] [CrossRef]
- Gibbs, R.J. Mechanisms Controlling World Water Chemistry. Science 1970, 170, 1088–1090. [Google Scholar] [CrossRef]
Figure 1.
Location map of the study area and the distribution of sampling wells.

Figure 2.
Correlation matrix of major ions in groundwater during the dry season (left) and wet season (right). The size of the solid circles represents the correlation degree.
Figure 2.
Correlation matrix of major ions in groundwater during the dry season (left) and wet season (right). The size of the solid circles represents the correlation degree.

Figure 3.
Principal component analysis of different components in the dry season (a) and the wet season (b).
Figure 3.
Principal component analysis of different components in the dry season (a) and the wet season (b).

Figure 4.
Spatial distribution of pollution components in the dry season.


Figure 5.
Spatial distribution of pollution components in the wet season.


Figure 6.
Piper diagrams during the dry and wet seasons.

Figure 7.
Gibbs diagrams showing the source of water chemistry components.

Figure 8.
Diagrams showing the correlations of major cations/anions to distinguish the hydrogeochemical processes. (a) Na+ versus Cl−; (b) Ca2+ versus SO42−; (c) ( Ca2+ + Mg2+ ) versus HCO3−; (d) ( Ca2+ + Mg2+ ) versus ( HCO3− + SO42− ).
Figure 8.
Diagrams showing the correlations of major cations/anions to distinguish the hydrogeochemical processes. (a) Na+ versus Cl−; (b) Ca2+ versus SO42−; (c) ( Ca2+ + Mg2+ ) versus HCO3−; (d) ( Ca2+ + Mg2+ ) versus ( HCO3− + SO42− ).

Figure 9.
Saturation index diagram against TDS: (a) SI of minerals in dry season; (b) SI of minerals in wet season.
Figure 9.
Saturation index diagram against TDS: (a) SI of minerals in dry season; (b) SI of minerals in wet season.

Figure 10.
Evolution of hydrogeochemical ratios with rising salinity.


Table 1.
Statistic descriptions of main ionic parameters in groundwater.
| Component | Dry Season | Wet Season | ||||||||
|---|---|---|---|---|---|---|---|---|---|---|
| Max | Min | Mean | SD | CV | Max | Min | Mean | SD | CV | |
| Na+ (mg/L) | 2962.00 | 12.00 | 96.58 | 346.41 | 358.69 | 936.00 | 6.73 | 59.77 | 112.09 | 187.53 |
| K+ (mg/L) | 69.50 | 0.29 | 7.13 | 12.29 | 172.39 | 65.00 | 0.54 | 5.82 | 9.88 | 169.71 |
| Ca2+ (mg/L) | 240.00 | 27.20 | 94.06 | 41.73 | 44.36 | 223.00 | 31.70 | 88.47 | 39.34 | 44.46 |
| Mg2+ (mg/L) | 266.00 | 6.72 | 30.56 | 31.65 | 103.57 | 80.60 | 3.53 | 22.93 | 13.60 | 59.32 |
| NH4+ (mg/L) | 5.00 | 0.00 | 0.12 | 0.60 | 490.19 | 1.50 | 0.00 | 0.03 | 0.18 | 524.34 |
| Cl− (mg/L) | 4565.69 | 1.97 | 132.99 | 539.24 | 405.46 | 2316.95 | 5.08 | 104.85 | 277.82 | 264.97 |
| SO42− (mg/L) | 761.98 | 15.11 | 108.56 | 94.43 | 86.98 | 445.29 | 14.09 | 93.23 | 63.45 | 68.06 |
| HCO3− (mg/L) | 878.00 | 26.91 | 207.84 | 131.38 | 63.21 | 528.14 | 20.18 | 198.14 | 99.35 | 50.14 |
| NO3− (mg/L) | 648.90 | 1.27 | 97.53 | 110.81 | 113.62 | 652.17 | 1.50 | 88.12 | 109.19 | 123.91 |
| NO2− (mg/L) | 22.27 | 0.00 | 0.64 | 2.69 | 423.75 | 13.91 | 0.00 | 0.80 | 2.37 | 297.38 |
| Pb (ug/L) | 57.32 | 0.36 | 1.78 | 6.91 | 387.06 | 20.66 | 0.36 | 1.49 | 2.93 | 196.34 |
| Ni (ug/L) | 11.62 | 0.67 | 3.17 | 2.29 | 72.11 | 39.50 | 1.84 | 6.27 | 4.66 | 74.39 |
| As (ug/L) | 27.92 | 0.48 | 2.57 | 3.96 | 153.98 | 16.65 | 0.48 | 2.40 | 2.76 | 115.14 |
| Se (ug/L) | 15.02 | 1.64 | 1.93 | 1.63 | 84.54 | 16.87 | 1.64 | 2.53 | 2.21 | 87.23 |
| Br (mg/L) | 13.01 | 0.02 | 1.02 | 1.61 | 158.24 | 6.85 | 0.02 | 0.71 | 1.18 | 165.34 |
| TDS (mg/L) | 8880.98 | 209.22 | 675.87 | 1015.47 | 150.25 | 4064.75 | 161.32 | 571.49 | 489.41 | 85.64 |
| TH (mg/L) | 1388.03 | 141.71 | 361.17 | 192.22 | 53.22 | 853.52 | 107.46 | 331.93 | 142.85 | 43.04 |
| F− (mg/L) | 2.28 | 0.01 | 0.66 | 0.32 | 47.83 | 1.19 | 0.01 | 0.70 | 0.19 | 27.59 |
| Fe (mg/L) | 0.11 | 0.02 | 0.02 | 0.01 | 55.74 | 0.02 | 0.02 | 0.02 | 0.00 | 0.00 |
| Mn (mg/L) | 2.97 | 0.00 | 0.28 | 0.58 | 207.78 | 2.10 | 0.00 | 0.10 | 0.34 | 319.66 |
| pH | 8.52 | 7.24 | 7.94 | 0.30 | 358.69 | 8.89 | 7.69 | 8.25 | 0.19 | 2.25 |
Disclaimer/Publisher’s Note: The statements, opinions and data contained in all publications are solely those of the individual author(s) and contributor(s) and not of MDPI and/or the editor(s). MDPI and/or the editor(s) disclaim responsibility for any injury to people or property resulting from any ideas, methods, instructions or products referred to in the content. |
© 2023 by the authors. Licensee MDPI, Basel, Switzerland. This article is an open access article distributed under the terms and conditions of the Creative Commons Attribution (CC BY) license (https://creativecommons.org/licenses/by/4.0/).
Share and Cite
MDPI and ACS Style
An, G.; Kang, H.; Fu, R.; Xu, D.; Li, J. Investigation on the Hydrogeochemical Characteristics and Controlling Mechanisms of Groundwater in the Coastal Aquifer. Water 2023, 15, 1710. https://doi.org/10.3390/w15091710
AMA Style
An G, Kang H, Fu R, Xu D, Li J. Investigation on the Hydrogeochemical Characteristics and Controlling Mechanisms of Groundwater in the Coastal Aquifer. Water. 2023; 15(9):1710. https://doi.org/10.3390/w15091710
Chicago/Turabian StyleAn, Guangnan, Hao Kang, Rongbing Fu, Damao Xu, and Jia Li. 2023. "Investigation on the Hydrogeochemical Characteristics and Controlling Mechanisms of Groundwater in the Coastal Aquifer" Water 15, no. 9: 1710. https://doi.org/10.3390/w15091710
Note that from the first issue of 2016, this journal uses article numbers instead of page numbers. See further details here.