
Spatiotemporal Variation Characteristics of Droughts and Their Connection to Climate Variability and Human Activity in the Pearl River Basin, South China
 , ,
, ,
Abstract
:1. Introduction
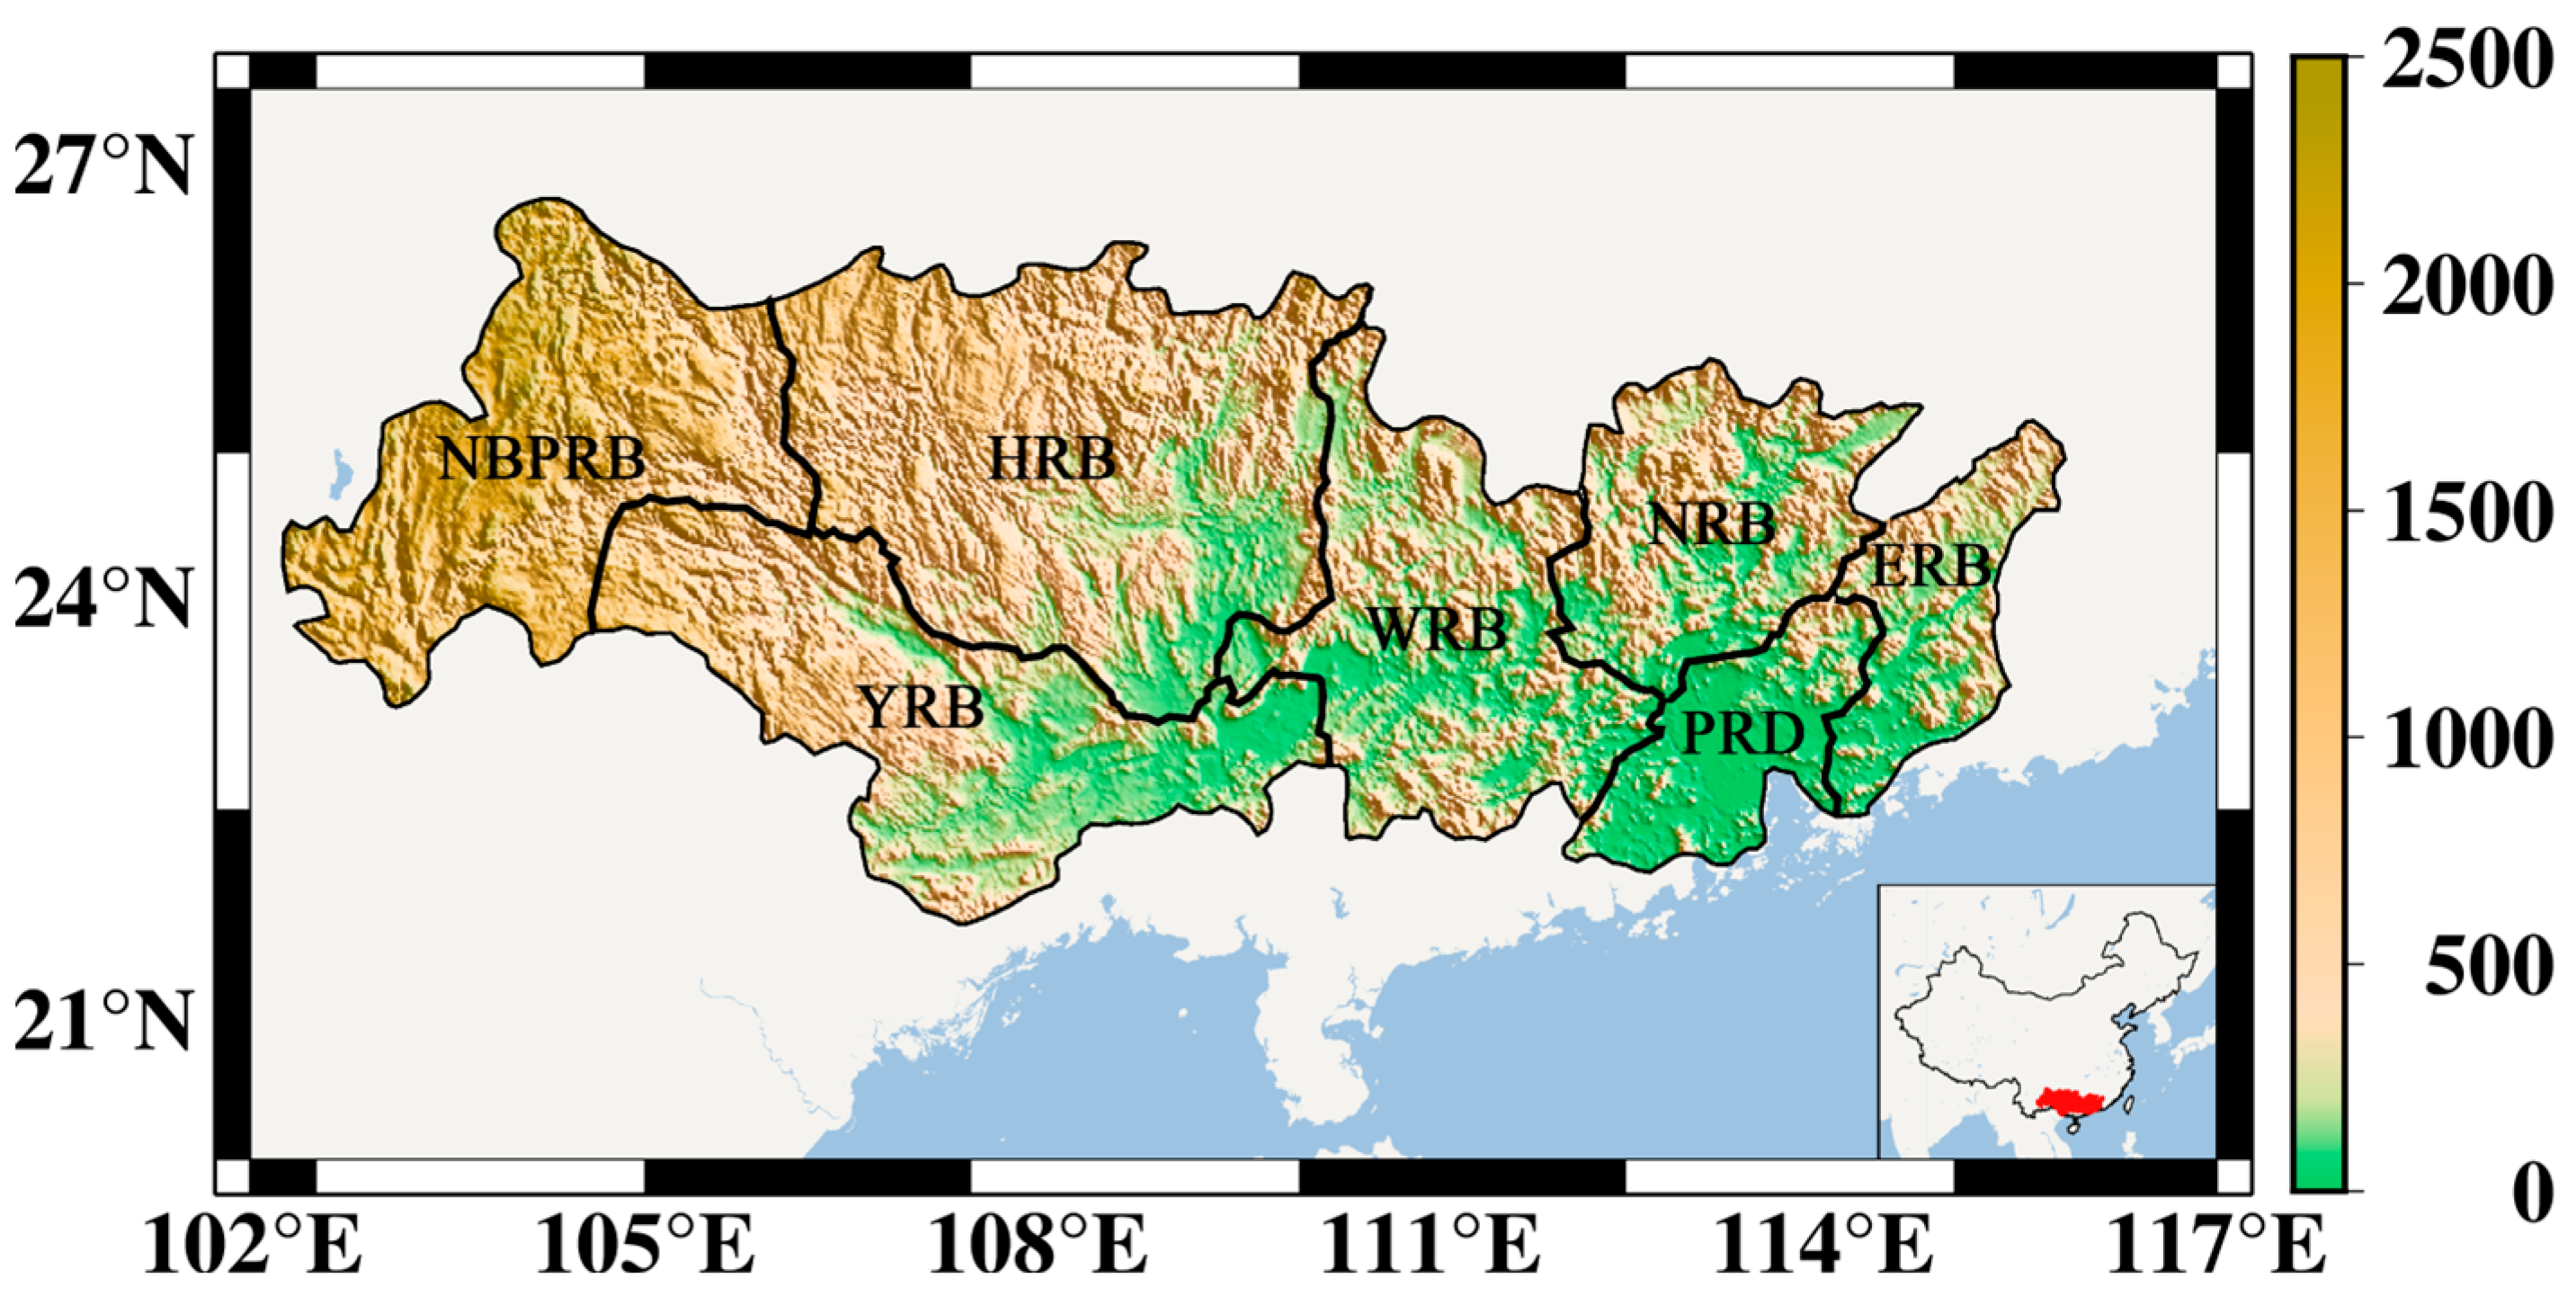
2. Study Area
3. Data
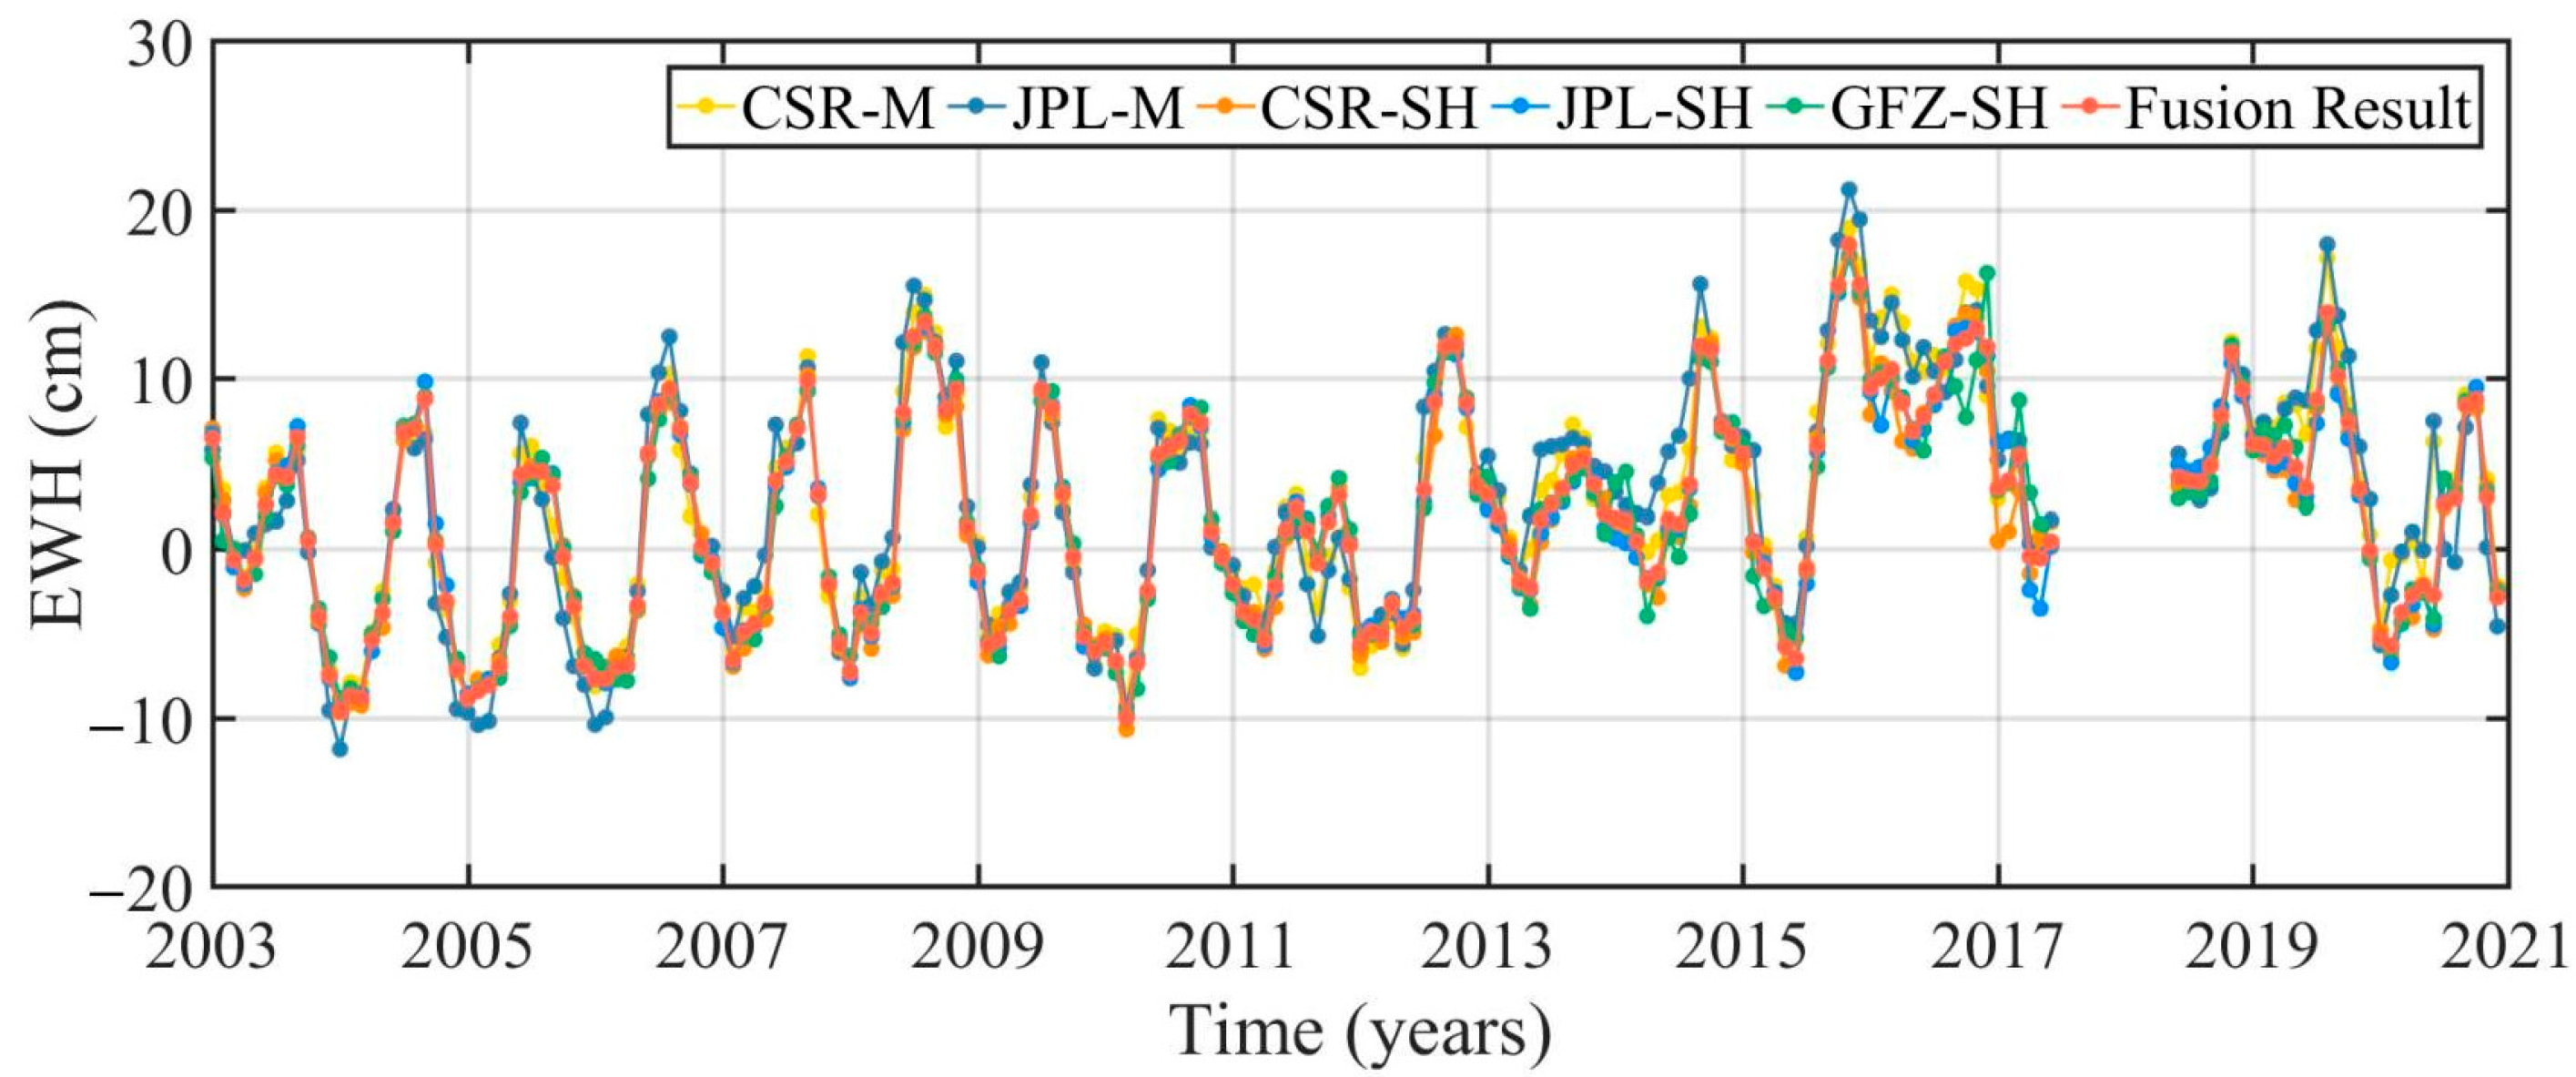
3.1. GRACE/GRACE-FO Data
3.2. Reconstructed TWSC Data
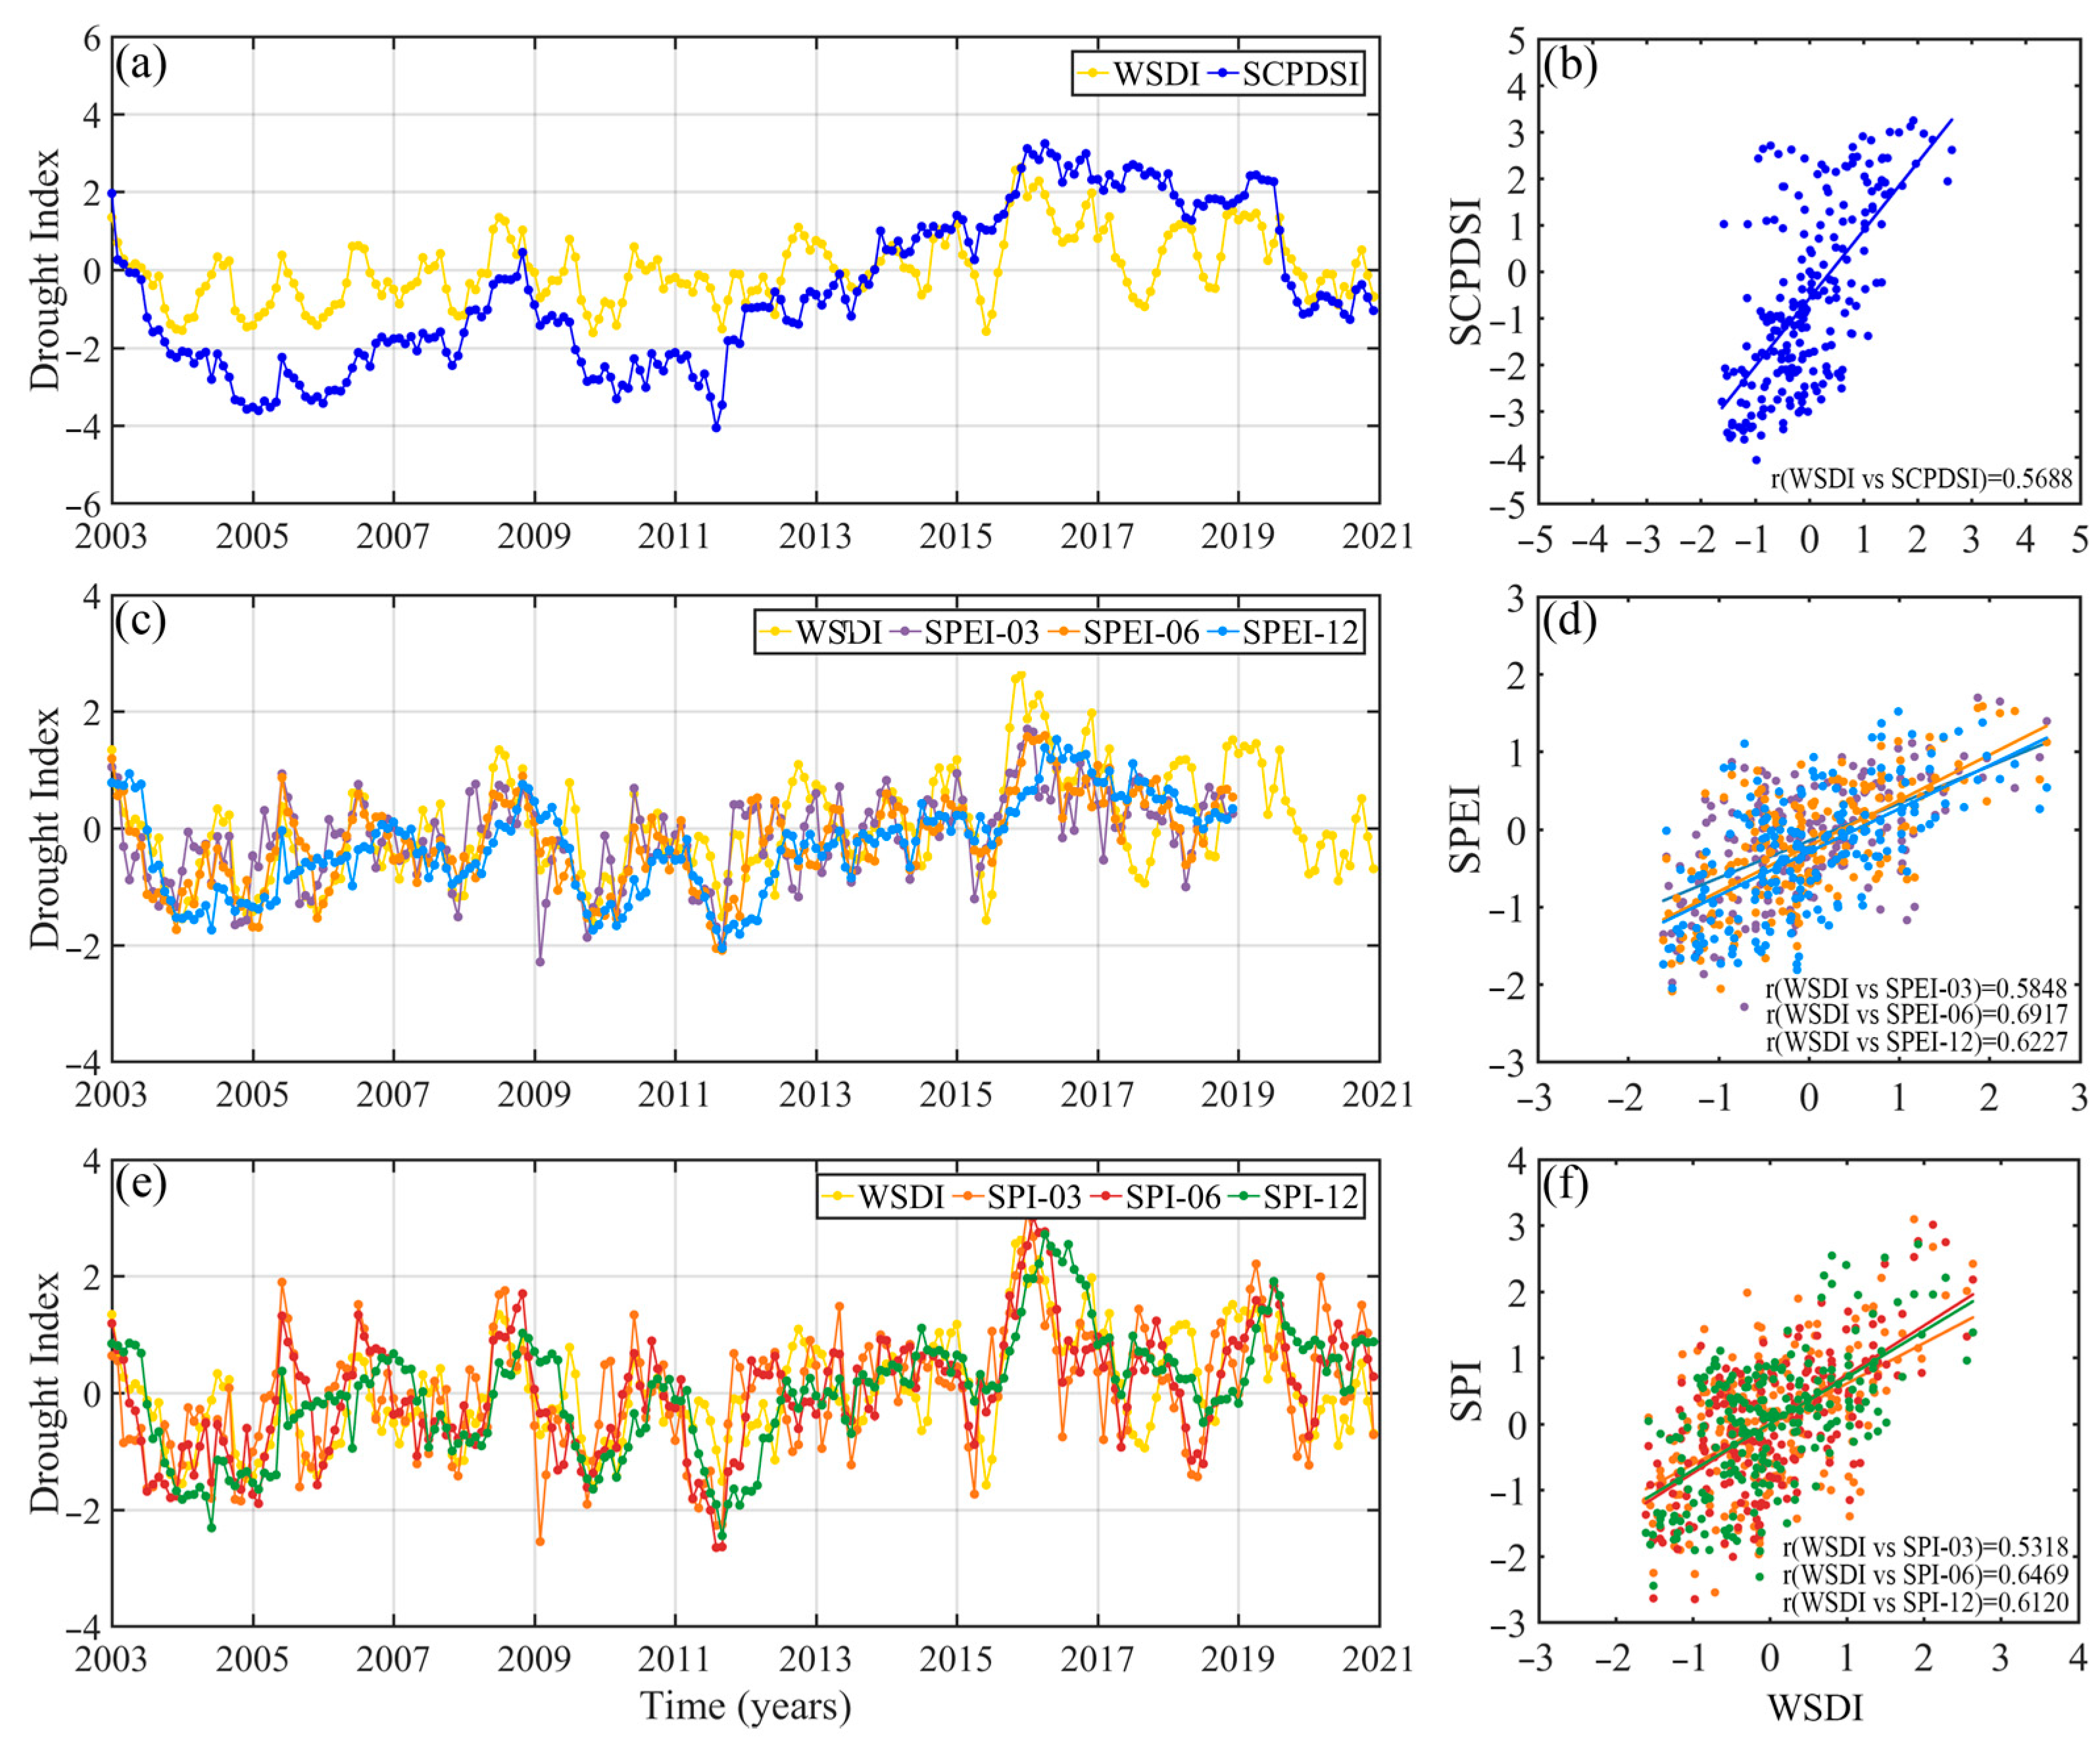
3.3. Traditional Drought Index
3.4. In Situ Hydrometeorological Data
3.5. Groundwater Data
3.6. Climate Teleconnection
3.7. In Situ Human-Induced TWSC Data
4. Methods
4.1. Data Fusion
4.2. Natural-Induced TWSCs
4.3. WSDI
4.4. Definition and Characteristics of Drought Event
4.5. SPI
4.6. Partial Least Squares Regression Model
4.7. Correlation Coefficient and Delay Months
5. Results
5.1. Spatiotemporal Distribution of the WSDI in the PRB
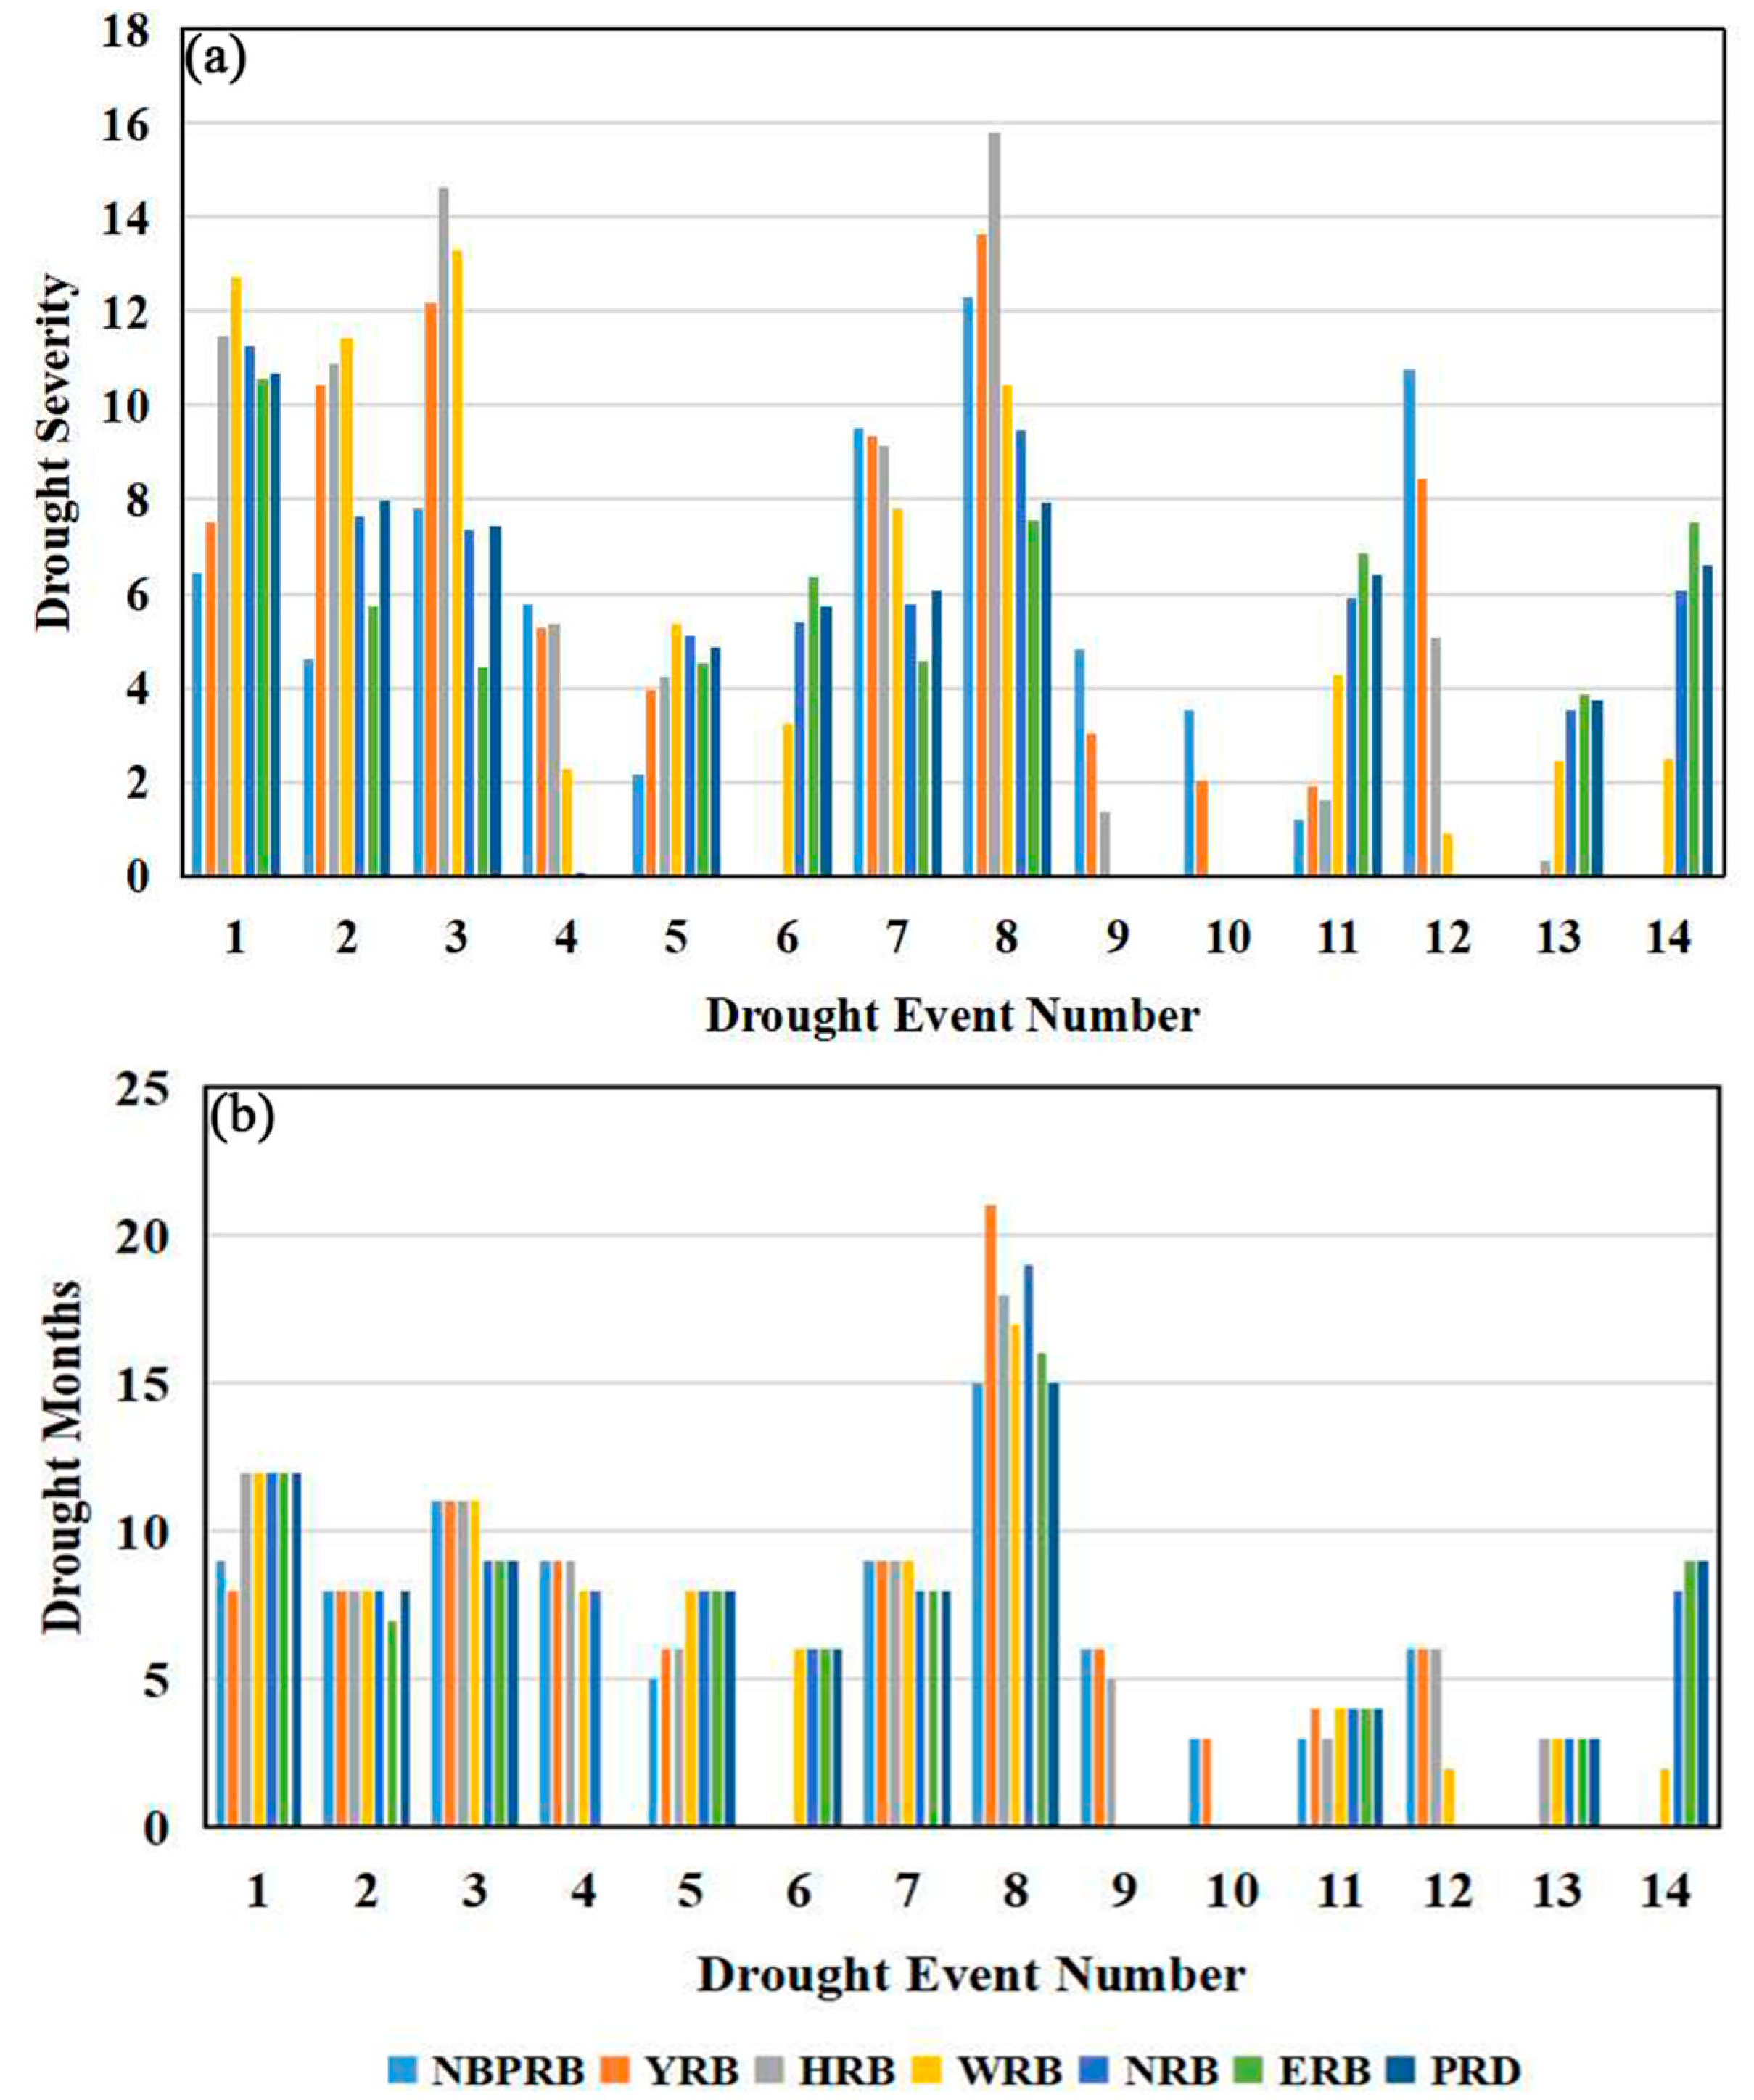
5.2. Drought Characteristics in the PRB
5.3. Impact of Climate Variability on Droughts
5.4. Impact of Human Activity on Droughts
6. Discussion
7. Conclusions
- (1)
- Although 14 droughts occurred in the PRB, not all droughts are basin-wide. Among them, the worst drought occurred from Nov 2010 to July 2012. There are significant differences in the drought characteristics of each sub-basin. The NRB is the basin that was affected by droughts for the longest durations.
- (2)
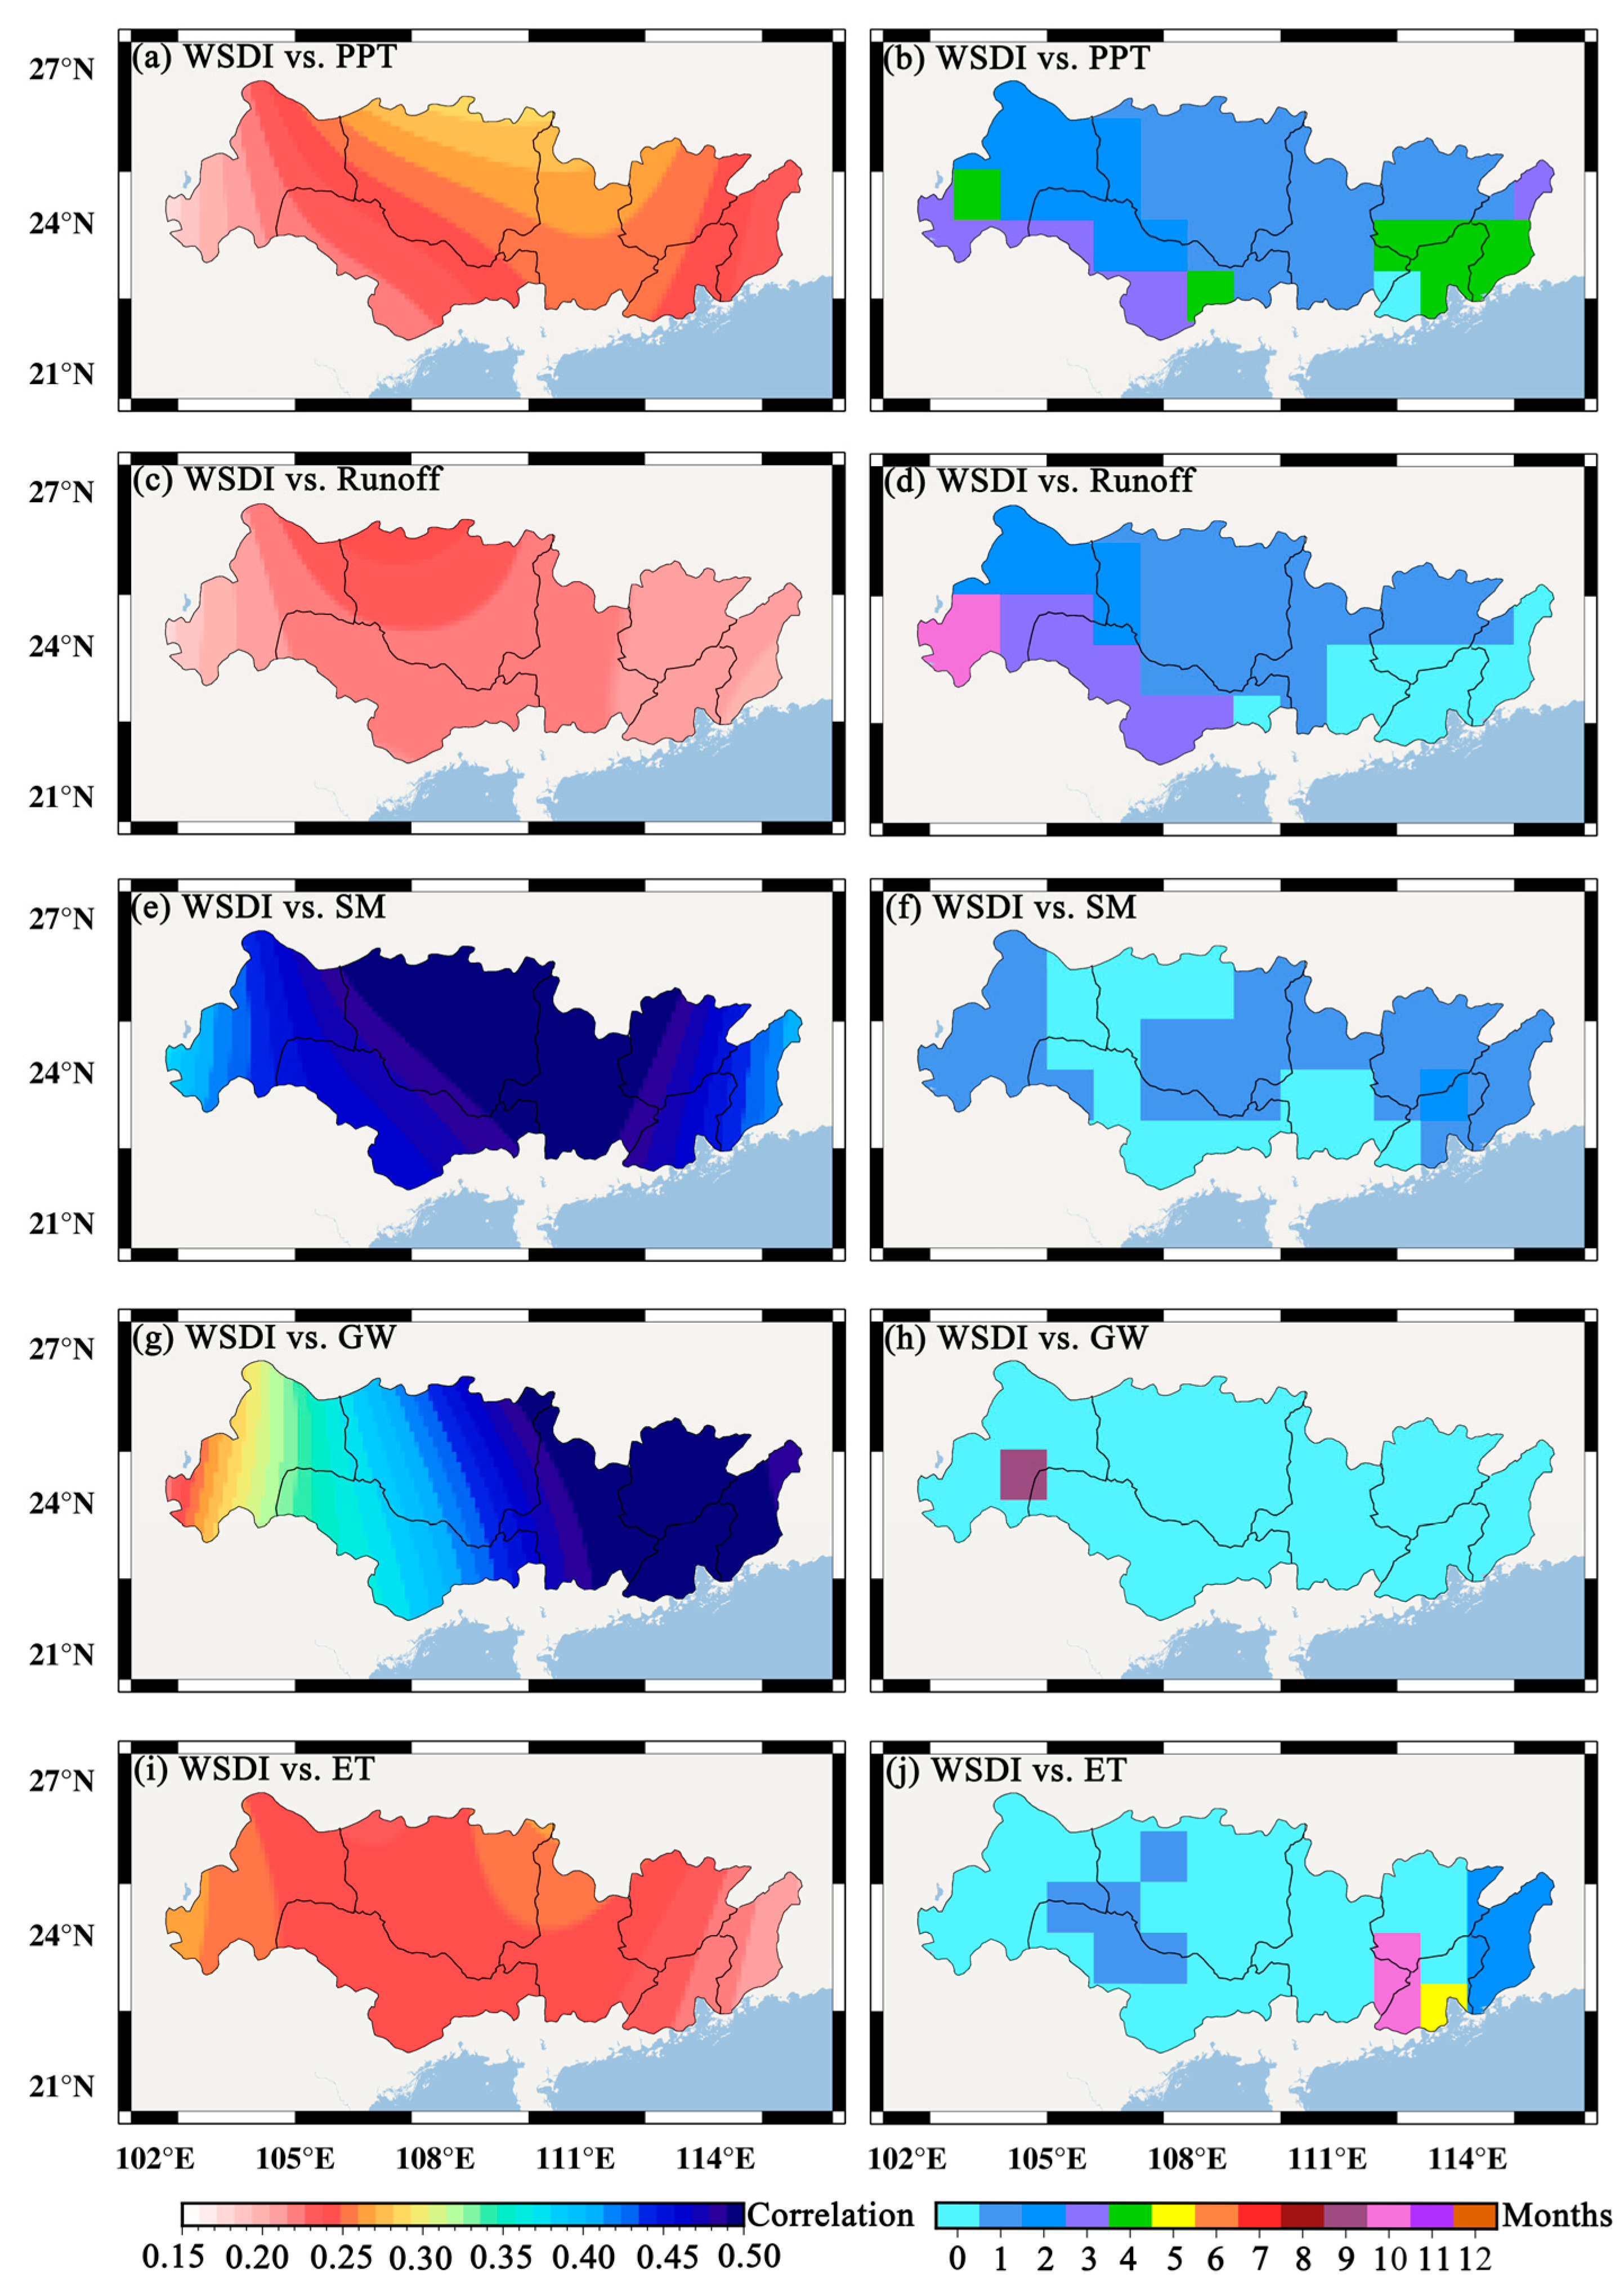
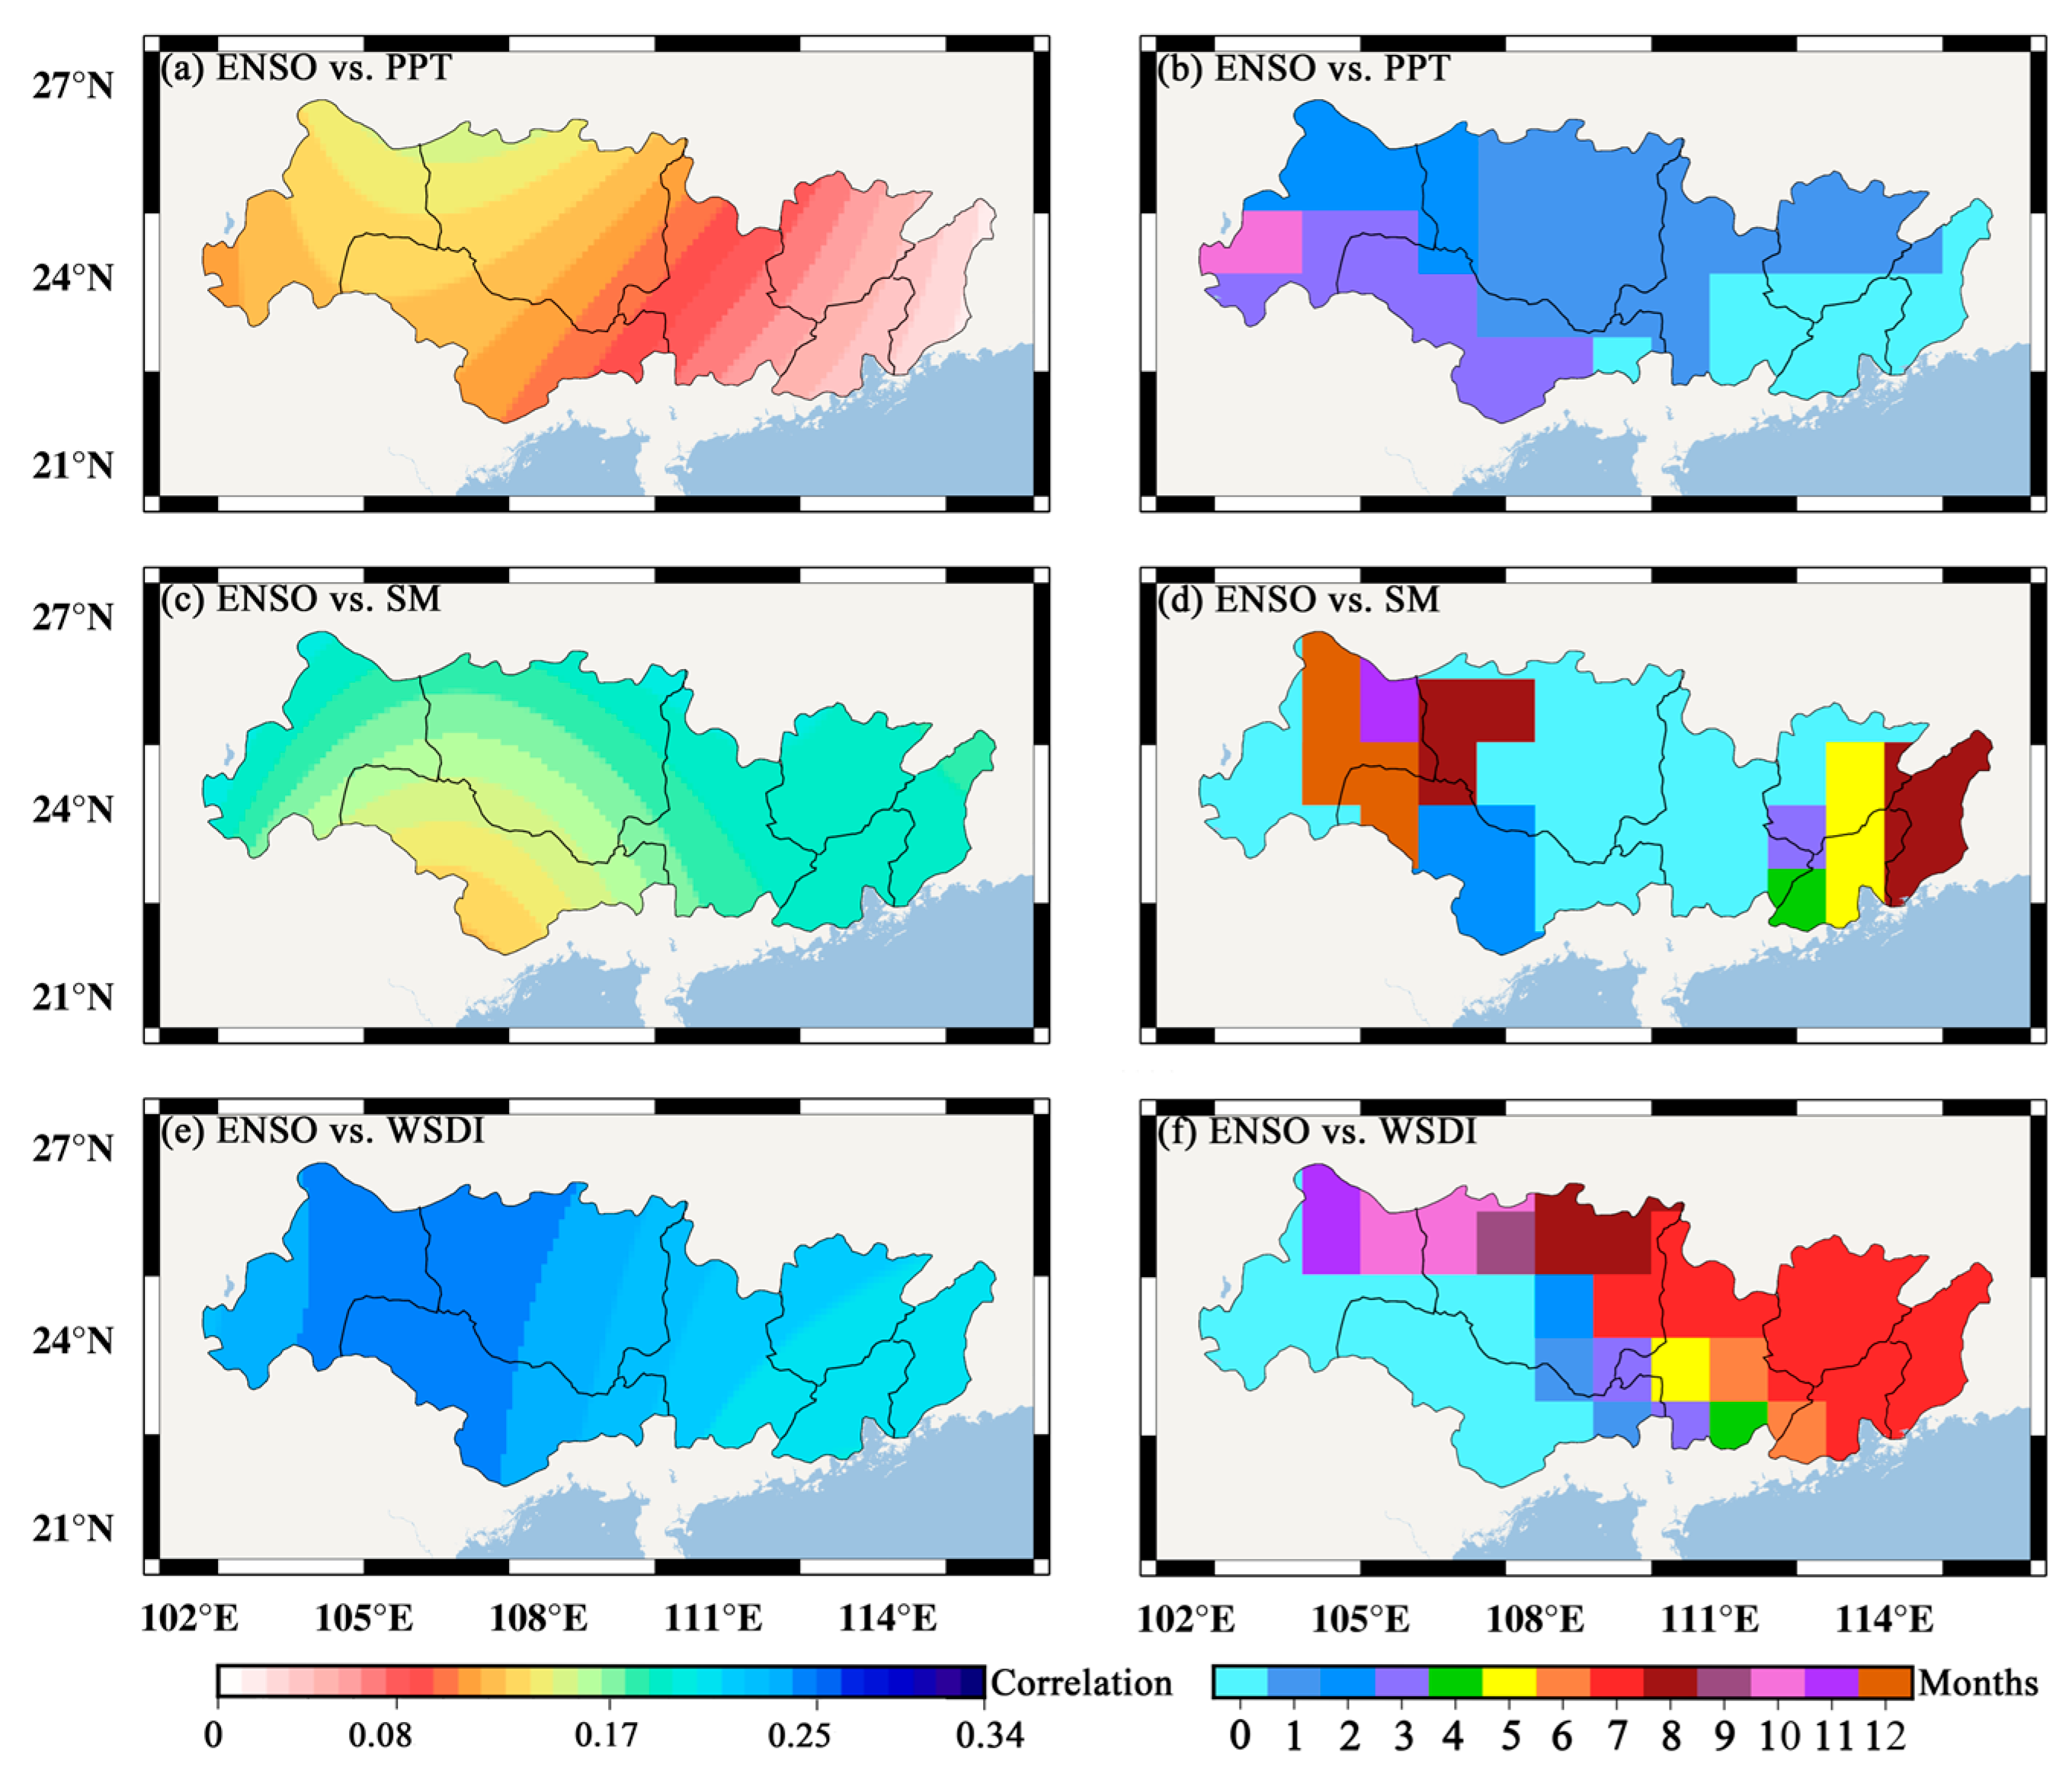
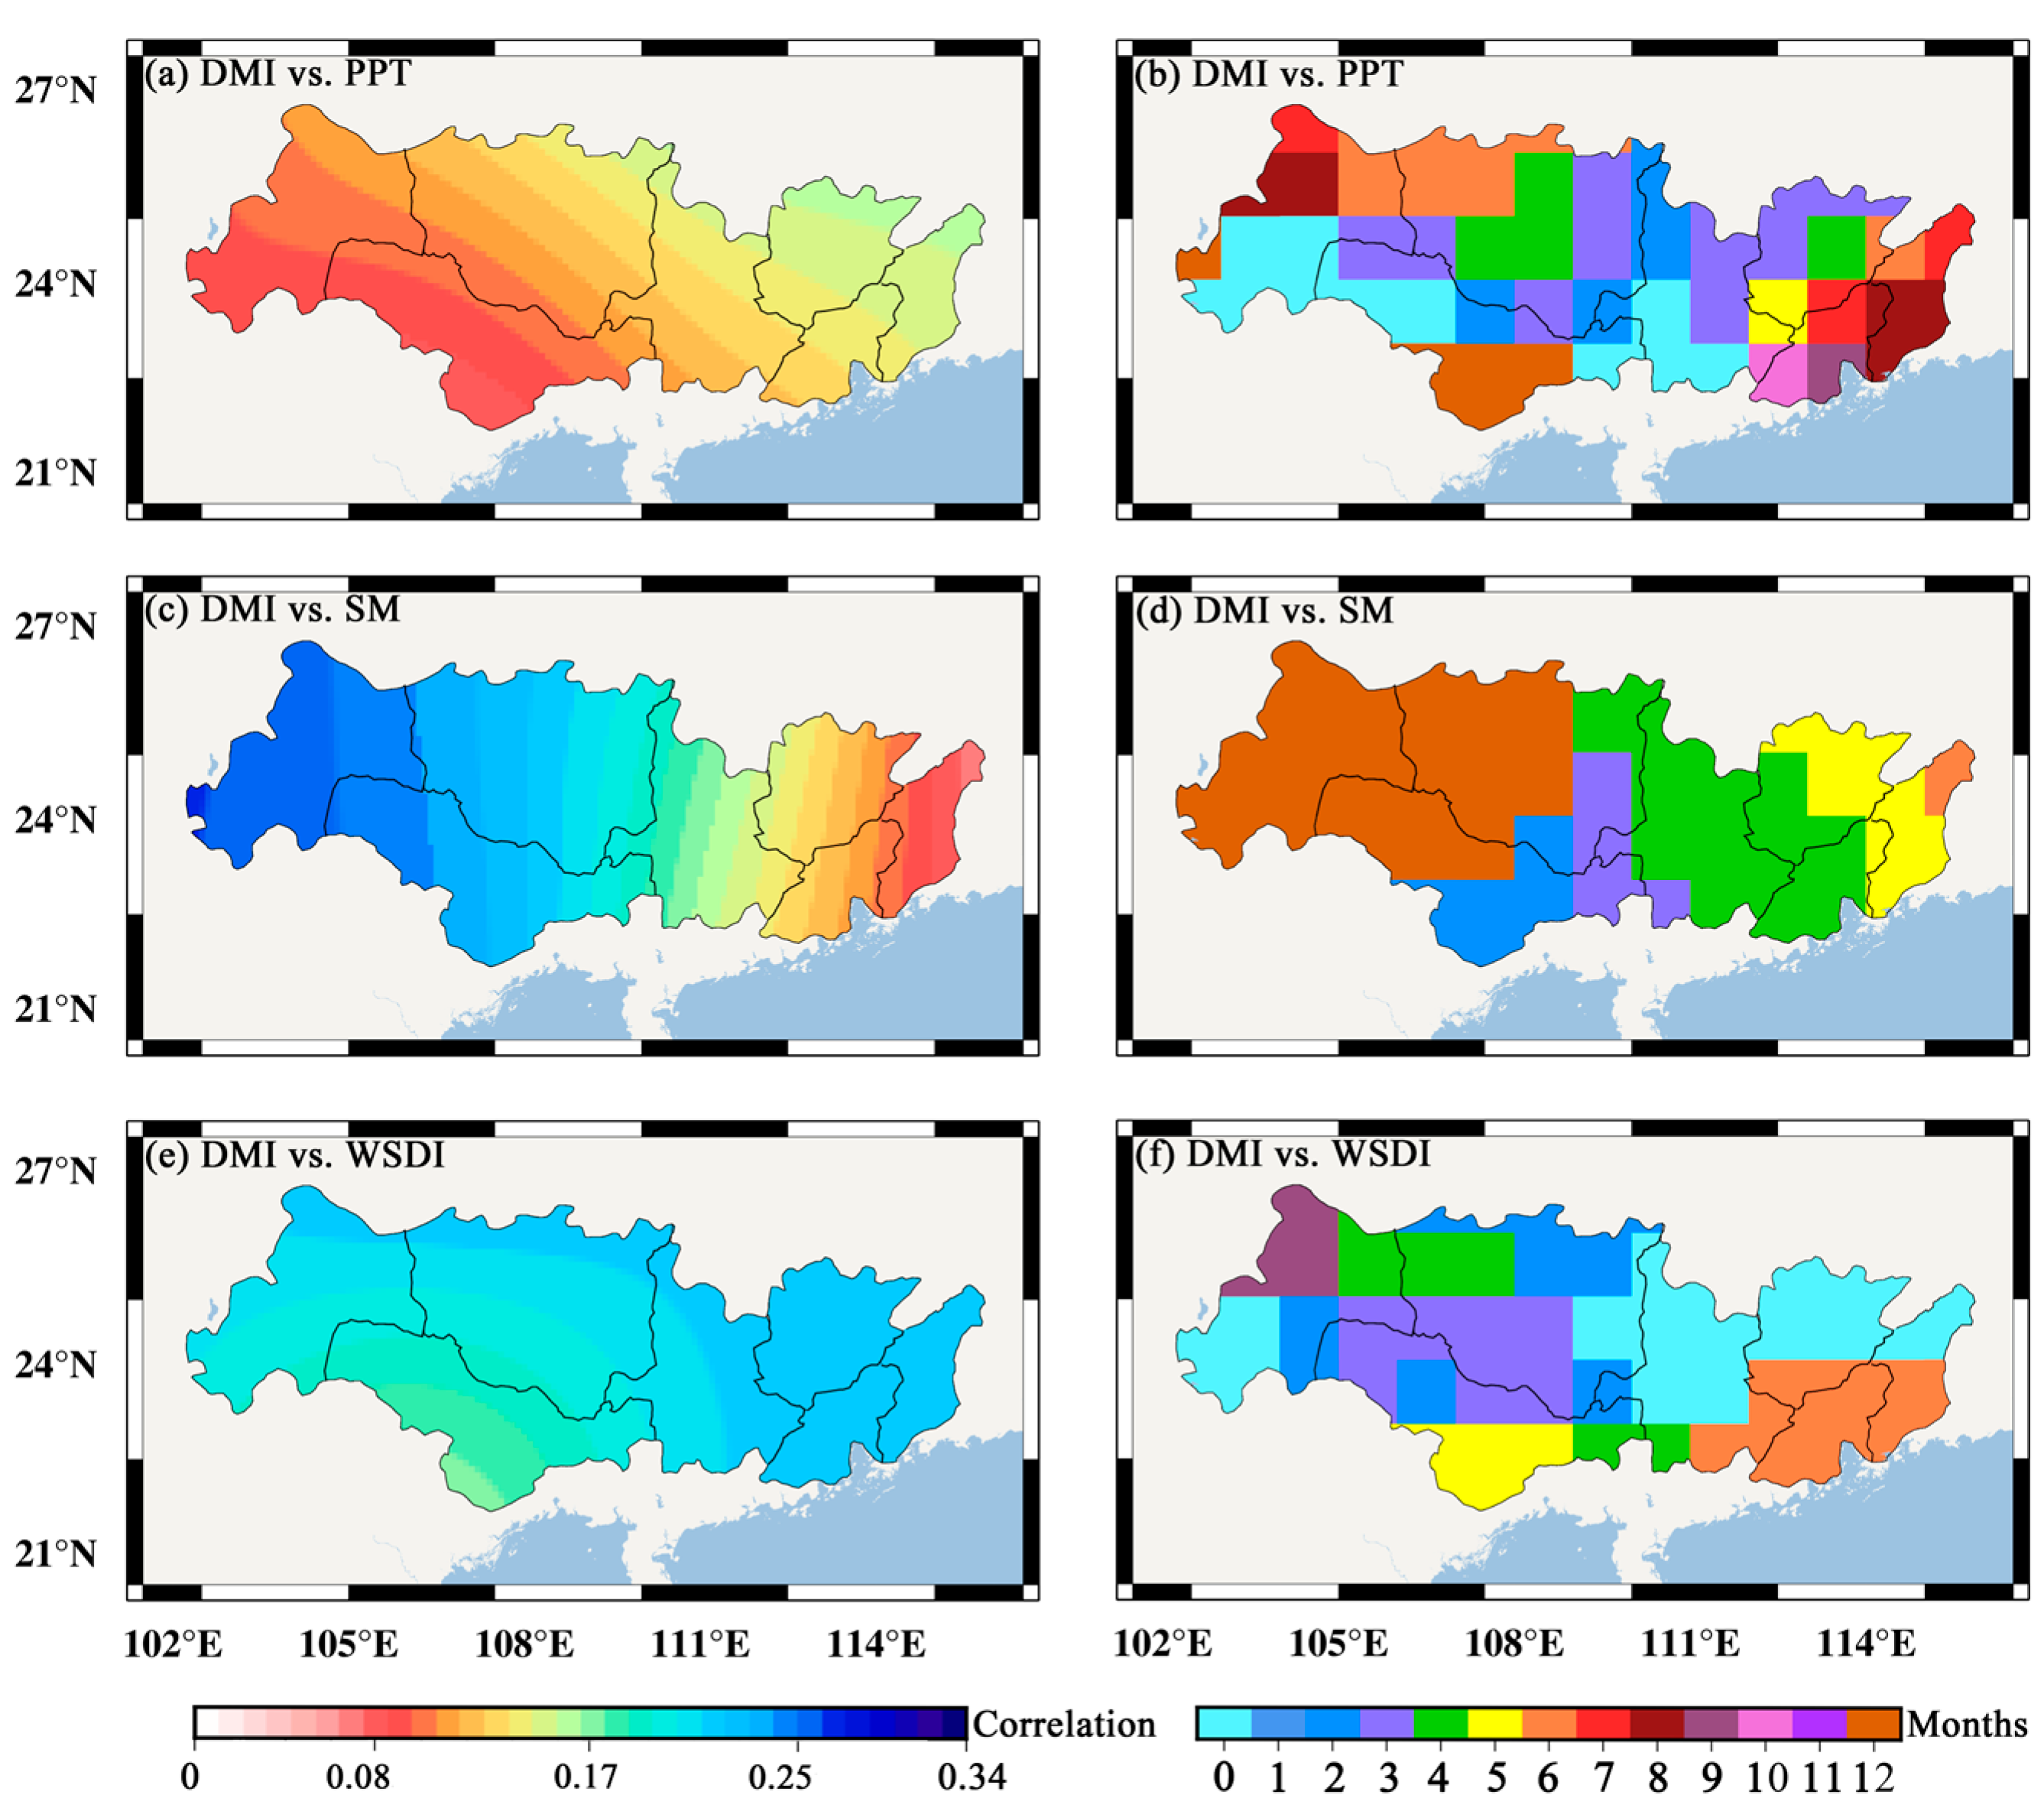
- The middle and upper reaches of the PRB were mainly dominated by SM, while the lower reaches were mainly dominated by GW. The ENSO had a greater impact on PPT in the PRB than the IOD. The impacts of the ENSO and the IOD on PPT present significant spatial east–west differences.
- (3)
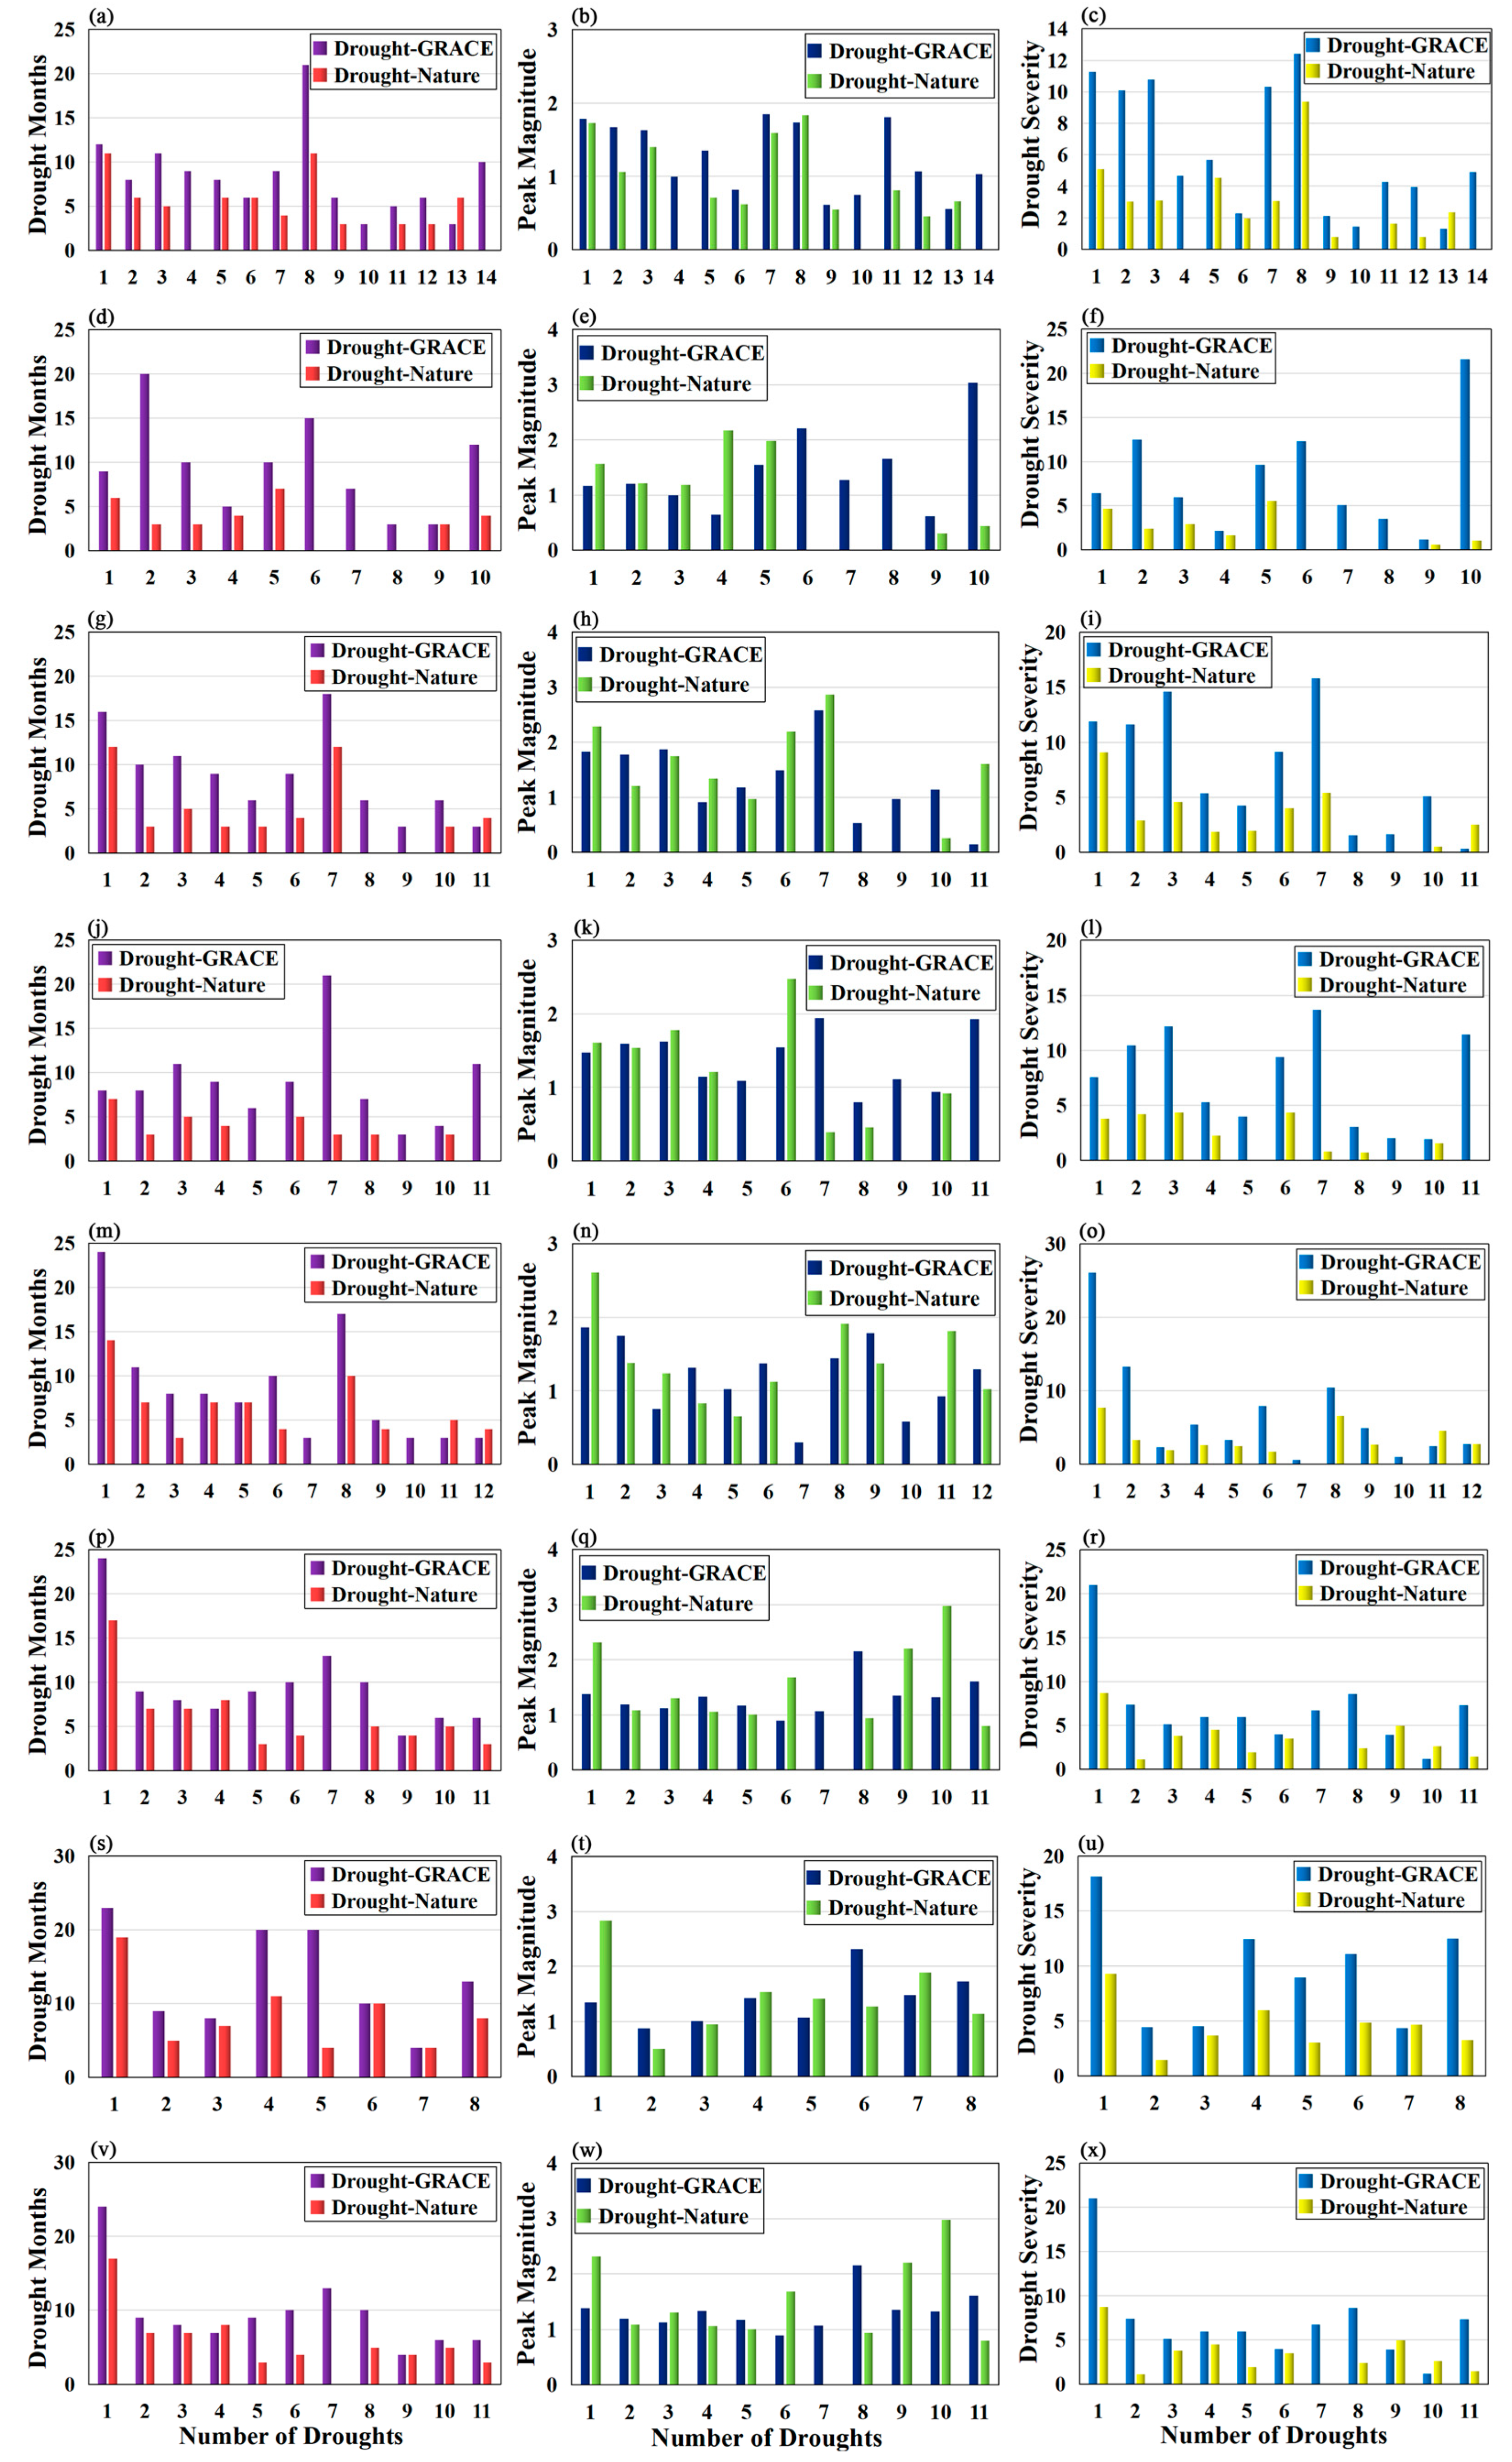
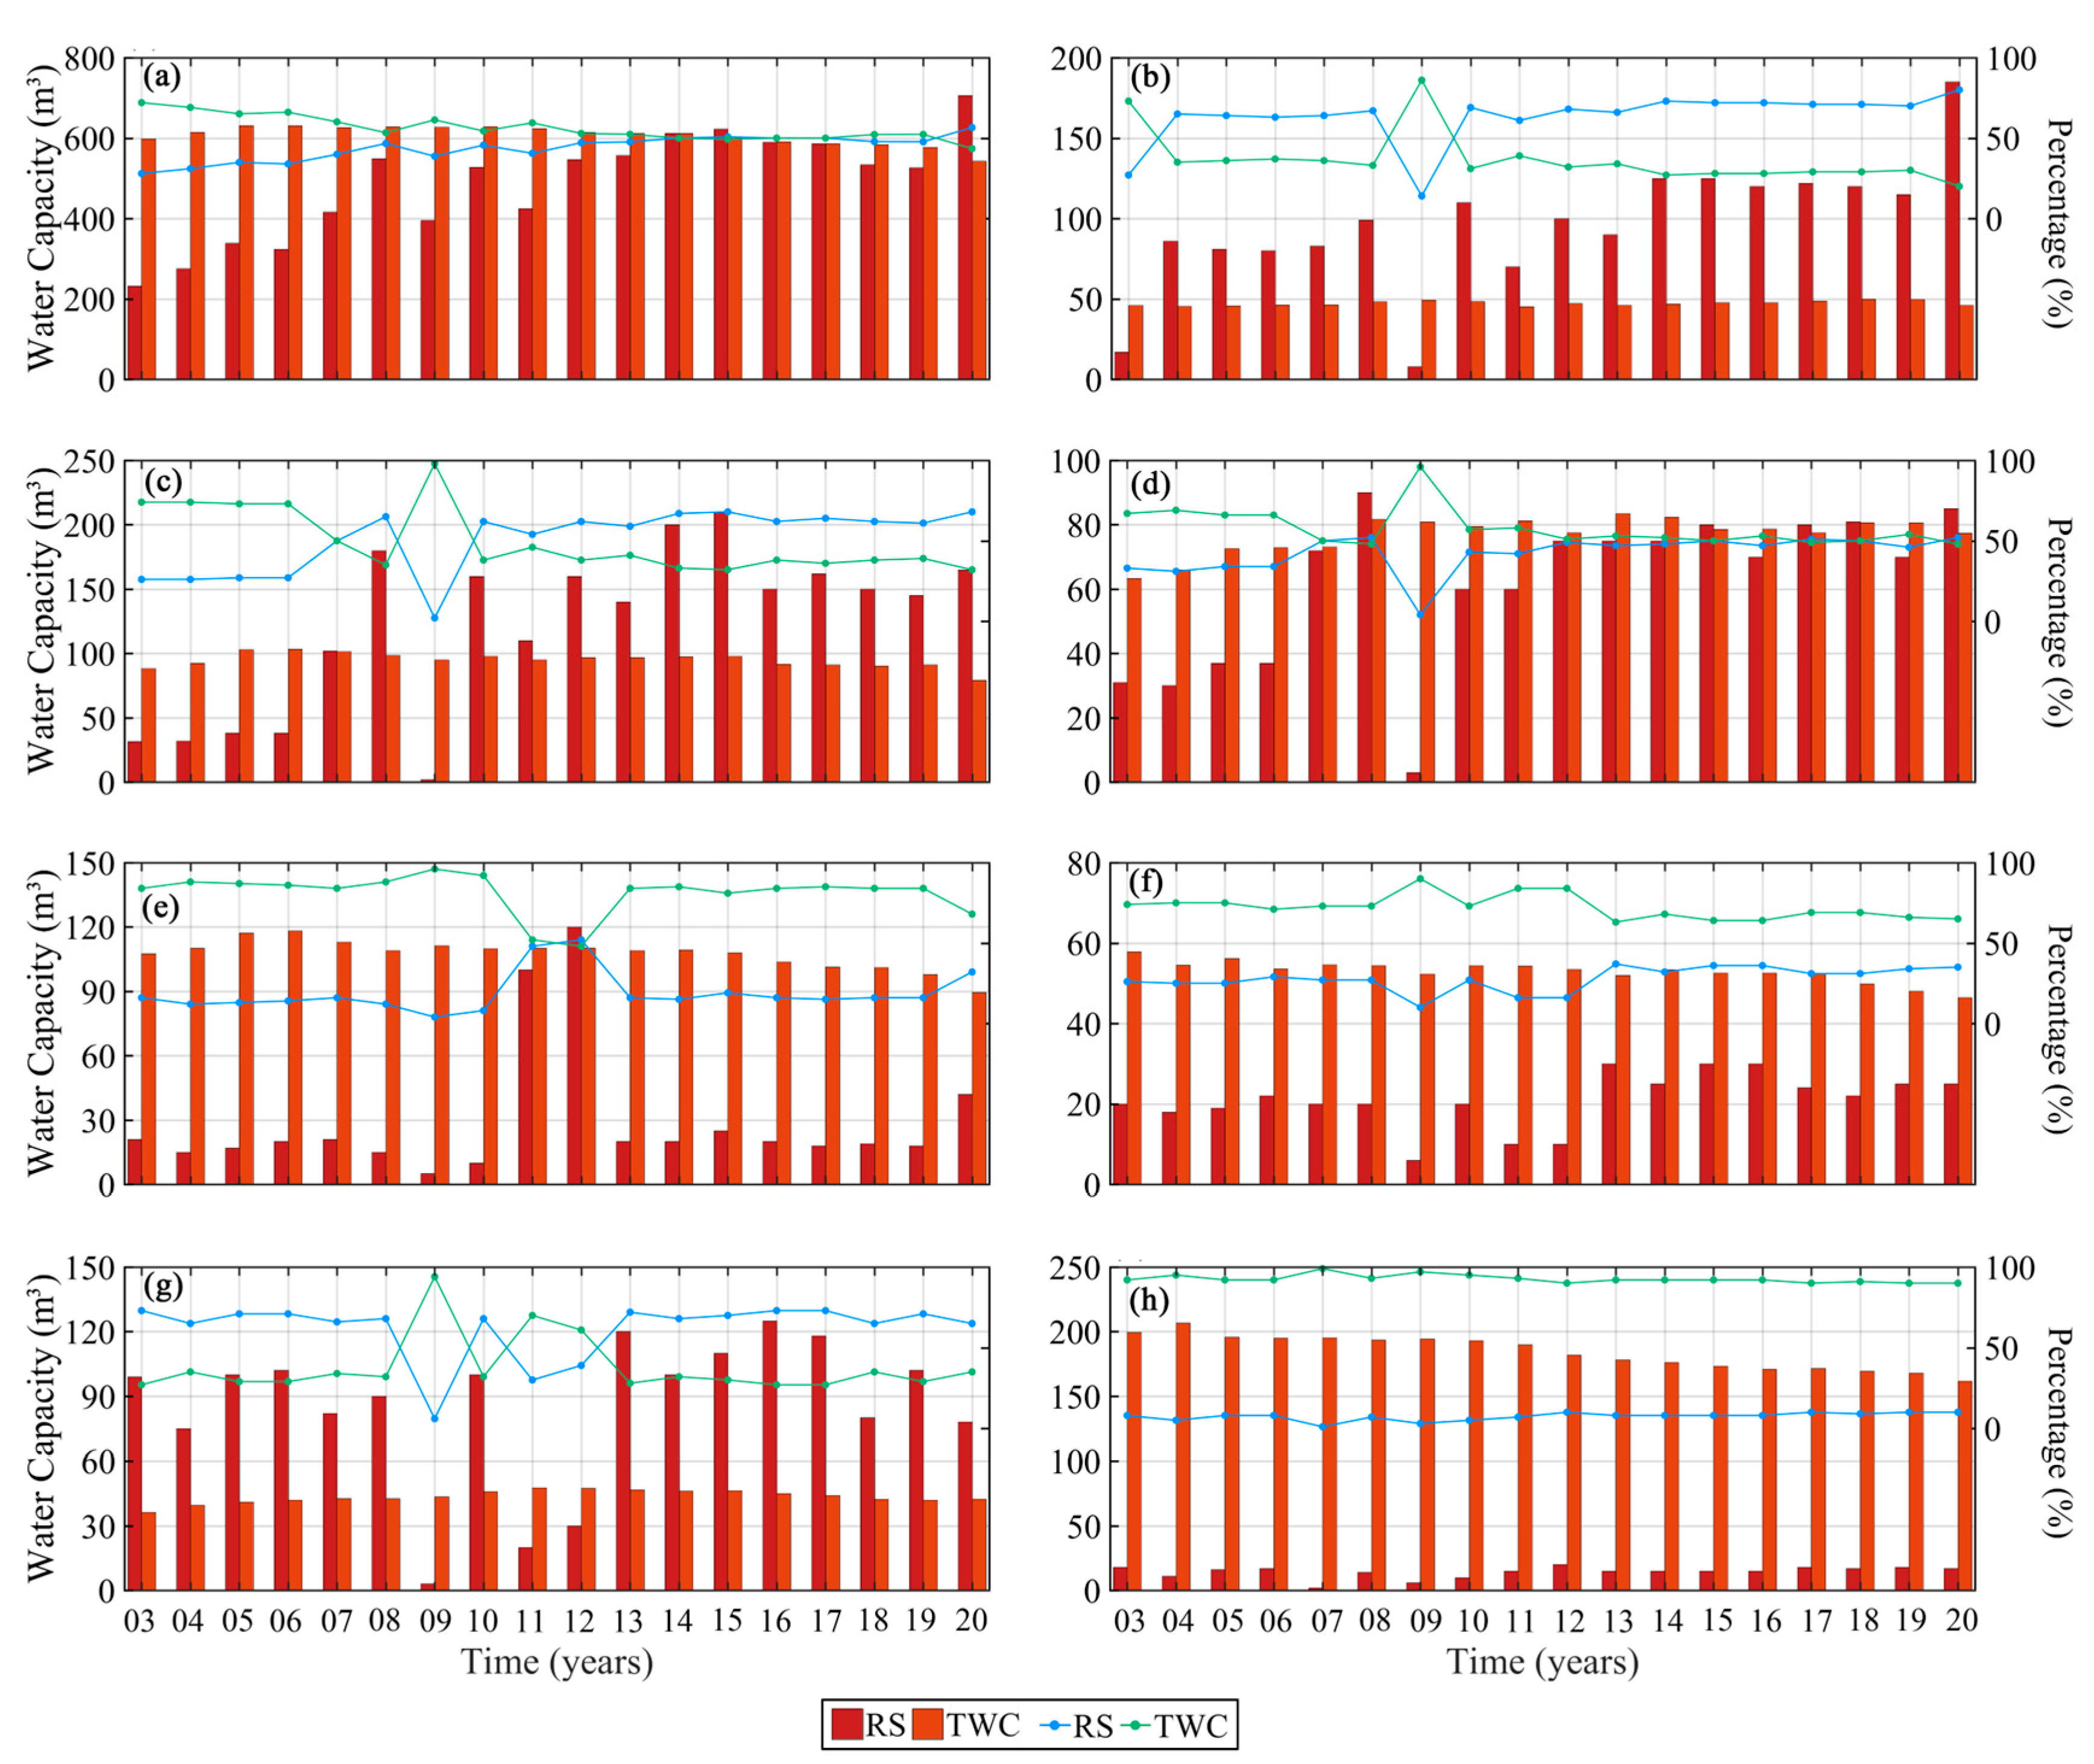
- In the PRB, human activity leads to longer drought durations and more severe drought, but can weaken the peak magnitude. The PRD is the basin most affected by human activity. Due to TWC, the drought frequency increased. RS can play a role in reducing the peak magnitude and drought severity, but this depends on the use of a reservoir.
Author Contributions
Funding
Institutional Review Board Statement
Informed Consent Statement
Data Availability Statement
Acknowledgments
Conflicts of Interest
Appendix A

| No. | Time Span of Drought Events | Duration (Months) | WSDI | Drought Area Percentage (%) | ||||
| Peak Magnitude | Average Magnitude | Severity | Peak Magnitude | Average Magnitude | Cumulative Manitude | |||
| 1 | 200302–200312 | 11 | −1.7283 | −0.4644 | −5.1088 | 100.00 | 79.25 | 871.72 |
| 2 | 200408–200501 | 6 | −1.0604 | −0.5037 | −3.0220 | 100.00 | 86.00 | 516.02 |
| 3 | 200507–200511 | 5 | −1.4033 | −0.6229 | −3.1146 | 99.36 | 88.49 | 442.46 |
| 4 | 200709–200711 | 3 | −0.7144 | −0.4736 | −1.4208 | 100.00 | 84.12 | 252.35 |
| 5 | 200802–200804 | 3 | −0.3451 | −0.2004 | −0.6011 | 98.07 | 79.02 | 237.06 |
| 6 | 200812–200902 | 3 | −0.6211 | −0.4518 | −1.3555 | 100.00 | 97.61 | 292.84 |
| 7 | 200904–200906 | 3 | −0.4907 | −0.3164 | −0.9491 | 78.13 | 67.72 | 203.16 |
| 8 | 200908–200911 | 4 | −1.5915 | −0.7640 | −3.0561 | 98.69 | 86.89 | 347.55 |
| 9 | 201101–201108 | 8 | −1.8329 | −0.7901 | −6.3209 | 100.00 | 80.04 | 640.30 |
| 10 | 201208–201210 | 3 | −1.0076 | −0.4514 | −1.3541 | 95.45 | 73.29 | 219.86 |
| 11 | 201212–201302 | 3 | −0.5513 | −0.2662 | −0.7985 | 99.36 | 79.14 | 237.41 |
| 12 | 201502–201504 | 3 | −0.8139 | −0.5444 | −1.6332 | 98.73 | 87.61 | 262.82 |
| 13 | 201612–201702 | 3 | −0.4576 | −0.2658 | −0.7974 | 98.73 | 80.93 | 242.79 |
| 14 | 201802–201807 | 6 | −0.6643 | −0.3944 | −2.3667 | 99.34 | 73.35 | 440.13 |
References
- Vishwakarma, B. Monitoring droughts from GRACE. Front. Environ. Sci. 2020, 8, 584690. [Google Scholar] [CrossRef]
- Mohamed, A.; Faye, C.; Othman, A.; Abdelrady, A. Hydro-geophysical evaluation of the regional variability of Senegal’s terrestrial water storage using time-variable gravity data. Remote Sens. 2022, 14, 4059. [Google Scholar] [CrossRef]
- Khan, A.A.; Zhao, Y.J.; Khan, J.; Rahman, G.; Rafiq, M.; UI Moazzam, M.F. Spatial and temporal analysis of rainfall and drought condition in Southwest Xinjiang in Northwest China, using various climate indices. Earth Syst. Environ. 2021, 5, 201–216. [Google Scholar] [CrossRef]
- Phoenix Net Finance. Available online: https://finance.ifeng.com/c/8JQyXvqfv66 (accessed on 13 April 2023).
- Cui, L.; Zhang, C.; Yao, C.; Luo, Z.; Wang, X.; Li, Q. Analysis of the influencing factors of drought events based on GRACE data under different climatic conditions: A case study in Mainland China. Water 2021, 13, 2575. [Google Scholar] [CrossRef]
- Aghakouchak, A.; Farahmand, A.; Melton, F.; Teixeira, J.; Anderson, M.; Wardlow, B.; Hain, C. Remote sensing of drought: Progress, challenges, and opportunities. Rev. Geophys. 2015, 53, 452–480. [Google Scholar] [CrossRef] [Green Version]
- Sun, Z.; Zhu, X.; Pan, Y.; Zhang, J.; Liu, X. Drought evaluation using the GRACE terrestrial water storage deficit over the Yangtze River Basin, China. Sci. Total Environ. 2018, 634, 727–738. [Google Scholar] [CrossRef] [PubMed]
- Cui, L.; Zhu, C.; Wu, Y.; Yao, C.; Wang, X.; An, J.; Wei, P. Natural- and human-induced influences on terrestrial water storage change in Sichuan, Southwest China from 2003 to 2020. Remote Sens. 2022, 14, 1369. [Google Scholar] [CrossRef]
- Mohamed, A.; Othman, A.; Galal, W.; Abdelrady, A. Integrated geophysical approach of groundwater potential in Wadi Ranyah, Saudi Arabia, using gravity, electrical resistivitu, and remote-sensing techniques. Remote Sens. 2023, 15, 1808. [Google Scholar] [CrossRef]
- Long, D.; Yang, Y.; Wada, Y.; Hong, Y.; Liang, W.; Chen, Y.; Yong, B.; Hou, A.; Wei, J.; Chen, L. Deriving scaling factors using a global hydrological model to restore GRACE total water storage changes for China’s Yangtze River basin. Remote Sens. Environ. 2015, 168, 177–193. [Google Scholar] [CrossRef]
- Zhang, Z.; Chao, B.; Chen, J.; Wilson, C. Terrestrial water storage anomalies of Yangtze River basin drought observed by GRACE and connection with ENSO. Glob. Planet. Change 2015, 126, 35–45. [Google Scholar] [CrossRef]
- Chen, J.; Wilson, C.; Tapley, B.; Yang, Z.; Niu, G. 2005 drought event in the Amazon River basin as measured by GRACE and estimated by climate models. J. Geophys Res. 2009, 114, B05404. [Google Scholar] [CrossRef]
- Cui, L.; Yin, M.; Huang, Z.; Yao, C.; Wang, X.; Lin, X. The drought events over the Amazon River basin from 2003 to 2020 detected by GRACE/GRACE-FO and Swarm satellites. Remote Sens. 2022, 14, 2887. [Google Scholar] [CrossRef]
- Ahmed, M.; Sultan, M.; Wahr, J.; Yan, E. The use of GRACE data to monitor natural and anthropogenic induced variations in water availability across Africa. Earth Sic. Rev. 2014, 136, 289–300. [Google Scholar] [CrossRef]
- Awange, J.; Khandu, K.; Schumacher, M.; Forootan, E.; Heck, B. Exploring hydro-meteorological drought patterns over the Greater Horn of Africa (1979-2014) using remote sensing and reanalysis produces. Adv. Water Res. 2016, 94, 45–59. [Google Scholar] [CrossRef] [Green Version]
- Xie, Z.; Huete, A.; Restrepo-Coupe, N.; Ma, X.; Devadas, R.; Caprarelli, G. Spatial partitioning and temporal evolution of Australia’s total water storage under extreme hydroclimatic impacts. Remote Sens. Environ. 2016, 183, 43–52. [Google Scholar] [CrossRef]
- Wang, W.; Shen, Y.; Wang, F.; Li, W. Two severe prolonged hydrological droughts analysis over Mainland Australia using GRACE satellite data. Remote Sens. 2021, 13, 1432. [Google Scholar] [CrossRef]
- Cui, L.; Zhang, C.; Luo, Z.; Wang, X.; Li, Q.; Liu, L. Using the local drought data and GRACE/GRACE-FO data to characterize the drought events in Mainland China from 2002 to 2020. Appl. Sci. 2021, 11, 9594. [Google Scholar] [CrossRef]
- Rodell, M.; Famiglietti, J. An analysis of terrestrial water storage variations in Illinois with implications for the Gravity Recovery and Climate Experiment (GRACE). Water Resour. Res. 2001, 37, 1327–1339. [Google Scholar] [CrossRef] [Green Version]
- Rodell, M.; Velicogna, I.; Famiglietti, J. Satellite-based estimates of groundwater depletion in India. Nature 2009, 460, 999–1002. [Google Scholar] [CrossRef] [Green Version]
- Zhang, X.; Hao, Z.; Singh, V.; Zhang, Y.; Feng, S.; Xu, Y.; Hao, F. Drought propagation under global warning: Characeristics, approaches, processes, and controllong factors. Sci. Total Environ. 2022, 838, 156021. [Google Scholar] [CrossRef]
- Sinha, D.; Syed, T.; Famiglietti, J.; Reager, J.; Thomas, R. Chaeacterizing drought in Indian using GRACE observations of terrestrial water storage deficit. J. Hydrometeorol. 2017, 18, 381–396. [Google Scholar] [CrossRef]
- Parades-Trejo, F.; Barbosa, H.; Govannettgne, J.; Kumar, T.; Thaur, M.; Buriti, C.; Uzcategui-Briceno, C. Drought assessment in the Sao Francisco River basin using satellite-based and ground-based indices. Remote Sens. 2021, 13, 3921. [Google Scholar] [CrossRef]
- Deng, S.; Liu, S.; Mo, X. Assessment and attribution of China’s droughts using an integrated drought index derived from GRACE and GRACE-FO data. J. Hydrol. 2021, 603, 127170. [Google Scholar] [CrossRef]
- Khorrami, B.; Gunduz, O. Detection and analysis of drought over Turkey with remote sensing and model-based drought indices. Geocarto Int. 2022, 37, 12171–12193. [Google Scholar] [CrossRef]
- Niu, J. Precipitation in the Pearl River basin, South China: Scaling, regional patterns, and influence of large-scale climate anomalies. Stochastic Environ. Res. Risk. Assess. 2013, 27, 1253–1268. [Google Scholar] [CrossRef]
- Luo, Z.; Yao, C.; Li, Q.; Huang, Z. Terrestrial water storage changes over the Pearl River basin from GRACE and connection with Pacific climate variability. Geod. Geodyn. 2016, 7, 171–179. [Google Scholar] [CrossRef] [Green Version]
- Cui, W.; Chen, J.; Wu, Y.; Wu, Y. An overview of water resources management of the Pearl River. Water Sci. Technol. Water Supply 2007, 7, 101–113. [Google Scholar] [CrossRef]
- Han, Z.; Huang, S.; Huang, Q.; Leng, G.; Wang, H.; Bai, Q.; Zhao, J.; Ma, L.; Wang, L.; Du, M. Propagation dynamics from meteorological to groundwater drought and their possible influence factors. J. Hydrol. 2019, 578, 124102. [Google Scholar] [CrossRef]
- Huang, Z.; Jiao, J.; Luo, X.; Pan, Y.; Jin, T. Drought and flood characterization and connection to climate variability in the Pearl River basin in Southern China using long-term GRACE and reanalysis data. J. Clim. 2021, 34, 2053–2078. [Google Scholar] [CrossRef]
- Zhang, M.; Wei, X. The effects of cumulative forest disturbance on streamflow in a large watershed in the central interior of British Columbia, Canada. Hydrol. Earth Syst. Sci. 2012, 16, 2021–2034. [Google Scholar] [CrossRef] [Green Version]
- Aryal, Y.; Zhu, J. Effect of watershed disturbance on seasonal hydrological drought: An improved double mass curve (IDMC) technique. J. Hydrol. 2020, 585, 124746. [Google Scholar] [CrossRef]
- Zhang, Q.; Xu, C.; Becker, S.; Zhang, Z.; Chen, Y.; Coulibaly, M. Trends and abrupt changes of precipitation maxima in the Pearl River basin, China. Atmos. Sci. Lett. 2009, 10, 132–144. [Google Scholar]
- Yang, T.; Shao, Q.; Hao, Z.; Chen, X.; Zhang, Z.; Xu, C. Regional frequency analysis and spatio-temporal pattern characterization of rainfall extremes in the Pearl River basin, China. J. Hydrol. 2010, 380, 386–405. [Google Scholar] [CrossRef]
- Swenson, S.; Chambers, D.; Whar, J. Estimating geocenter variations form a combination of GRACE and ocean model output. J. Geophys. Res. Solid Earth. 2008, 113, 194–205. [Google Scholar]
- Cheng, M.; Tapley, B. Variations in the Earth’s oblateness during the past 28 years. J. Geophys. Res. 2004, 109, B09402. [Google Scholar] [CrossRef]
- Cui, L.; Song, Z.; Luo, Z.; Zhong, B.; Wang, X.; Zou, Z. Comparison of terrestrial water storage changes derived from GRACE/GRACE-FO and Swarm: A case study in the Amazon River Basin. Water 2020, 12, 3128. [Google Scholar] [CrossRef]
- Zhong, Y.L.; Feng, W.; Zhong, M.; Ming, Z.T. Dataset of Reconstructed Terrestrial Water Storage in China Based on Precipitation (2002–2019); National Tibetan Plateau Data Center: Beijing, China, 2020. [Google Scholar]
- Zhong, Y.; Feng, W.; Humphrey, V.; Zhong, M. Human-Induced and Climate-Driven Contributions to Water Storage Variations in the Haihe River Basin, China. Remote Sens. 2019, 11, 3050. [Google Scholar] [CrossRef] [Green Version]
- Van der Schrier, G.; Barichivich, J.; Briffa, K.; Jones, P. A scPDSI-based global data set of dry and wet spells for 1901–2009. J. Geophys. Res. Atmos. 2013, 118, 4025–4048. [Google Scholar] [CrossRef]
- Mishra, A.; Singh, V. A review of drought concepts. J. Hydrol. 2010, 391, 202–216. [Google Scholar] [CrossRef]
- Bazrkar, M.; Eslamian, F. Ocean oscillation and drought indices: Application, Ch, 8. In Handbook of Drought and Water Scarcity, Vol. 1: Principles of Drought and Water Scarcity; Eslamian, S., Eslamian, F., Eds.; Francis and Taylor: Abingdon, UK; CRC Press: Boca Raton, FL, USA, 2017; pp. 127–136. [Google Scholar]
- Qian, W. Global Climate System; Peking Unversity Press: Beijing, China, 2009; pp. 45–50. (In Chinese) [Google Scholar]
- Zhou, T.; Yu, R.; Li, H.; Wang, B. Ocean forcing to changes in global monsoon precipitation over the recent half-century. J. Clim. 2008, 21, 3833–3852. [Google Scholar] [CrossRef]
- Cayan, D.; Redmond, K.; Riddle, L. ENSO and hydrologic extremes in the western United States. J.Clim. 2010, 12, 2881–2893. [Google Scholar] [CrossRef]
- Deng, S.; Chen, T.; Yang, N.; Qu, L.; Li, M.; Chen, D. Spatial and temporal distribution of rainfall and drought characteristics acorss the Pearl River basin. Sci. Total Environ. 2018, 619–620, 28–41. [Google Scholar] [CrossRef] [PubMed]
- Meyers, G.; Mcintosh, P.; Pigot, L.; Pook, M. The years of EI Niño, La Niña, and Interactions with the Tropical Indian Ocean. J. Clim. 2007, 20, 2872–2880. [Google Scholar] [CrossRef]
- Hu, B.; Nan, X.; Gao, B. Application of industrial wireless technology in control system of current meter verification vehicle. J. China Hydrol. 2017, 37, 12–21. (In Chinese) [Google Scholar]
- Long, D.; Pan, Y.; Zhou, J.; Chen, Y.; Hou, X.; Hong, Y.; Scanlon, B.; Longuevergne, L. Global analysis of spatiotemporal variability in merged total water storage changes using multiple GRACE products and global hydrological models. Remote Sens. Environ. 2017, 192, 198–216. [Google Scholar] [CrossRef]
- Cui, L.; Luo, C.; Yao, C.; Zou, Z.; Wu, G.; Li, Q.; Wang, X. The influence of climate change on forest fires in Yunnan province, Southwest China detected by GRACE satellites. Remote Sens. 2022, 14, 712. [Google Scholar] [CrossRef]
- Thomas, A.; Reager, J.; Famiglietti, J.; Rodell, M. A GRACE-based water storage deficit approach for hydrological drought characterization. Geophys. Res. Lett. 2014, 41, 1537–1545. [Google Scholar] [CrossRef] [Green Version]
- Cui, L.; He, M.; Zou, Z.; Yao, C.; Wang, S.; An, J.; Wang, X. The influence of climate change on droughts and floods in the Yangtze River basin from 2003 to 2020. Sensors 2022, 22, 8178. [Google Scholar] [CrossRef]
- McKee, T.; Doesken, N.; Kleist, J. The relationship of drought frequency and duration to time scales. In Proceedings of the 8th Conference on Applied Climatology, Anaheim, CA, USA, 17–22 January 1993; pp. 179–184. [Google Scholar]
- Vicente-Serrano, S. Differences in spatial patterns of drought on different time scales: An analysis of the Iberian Peninsula. Water Resour. Manag. 2006, 20, 37–60. [Google Scholar] [CrossRef]
- Mcroberts, D.; Nielsengammon, J. The use of a high-resolution standardized precipitation index for drought monitoring and assessment. J. Appl. Meteorol. Climatol. 2012, 51, 68–83. [Google Scholar] [CrossRef]
- Abdi, H. Partial least square regression (PLS regression). In Encyclopedia of Measurement and Statistics; Salkind, N.J., Ed.; Sage Publications: Thousand Oaks, CA, USA, 2007. [Google Scholar]
- Yan, B.; Fang, N.; Zhang, P.C.; Shi, Z. Impacts of land use change on watershed streamflow and sediment yield: An assessment using hydrologic modelling and partial least squares regression. J. Hydrol. 2013, 484, 26–37. [Google Scholar] [CrossRef]
- Hu, Z.; Zhang, Z.; Sang, Y.; Qian, J.; Feng, W.; Chen, X.; Zhou, Q. Temporal and spatial variations in the terrestrial water storage acorss Central Asia based on multiple satellite datasets and global hydrological models. J. Hydrol. 2021, 596, 126013. [Google Scholar] [CrossRef]
- Woldesenbet, T.A.; Elagib, N.A.; Ribbe, L.; Heinrich, J. Hydrological responses to land use/cover changes in the source region of the Upper Blue Nile Basin, Ethiopia. Sci. Total Environ. 2017, 575, 724–741. [Google Scholar] [CrossRef]
- Cui, L.; Zhu, C.; Zou, Z.; Yao, C.; Zhang, C.; Li, Y. The spatiotemporal characteristics of wildfires across Australia and their connection to extreme climate based on a combined hydrological drought index. Fire 2023, 6, 42. [Google Scholar] [CrossRef]
- Yuan, L.; He, J. Different impact if two types of ENSO on winter rainfall over South China. J. Arid Meteorol. 2013, 31, 24–31. (In Chinese) [Google Scholar]
- Xiao, Y.; Zhang, Z.; He, J. Progresses in the studies on Indian ocean dipoles. J. Tropical Meteorol. 2009, 25, 621–627. (In Chinese) [Google Scholar]
- Margariti, J.; Rangecroft, S.; Parry, S.; Wendt, D.; Van Loon, A. Anthropogenic activities alter drought termination. Elementa 2019, 7, 1–30. [Google Scholar] [CrossRef] [Green Version]
- Comprehensive Work Plan for Energy Saving and Emission Reduction. Available online: http://www.gov.cn/zhengce/content/2011-01/24/content_5670202.htm?trs=1 (accessed on 5 March 2023).
- Zhang, R.; Chen, X.; Zhang, Z.; Shi, P. Evolution of hydrological drought under the regulation of two reservoirs in the headwater basin of the Huaihe River, China. Stoch. Environ. Res. Risk Assess 2015, 29, 487–499. [Google Scholar] [CrossRef]
- Wu, J.; Liu, Z.; Yao, H. Impacts of reservoir operations on multi-scale correlations between hydrological drought and meteorological drought. J. Hydrol. 2018, 563, 726–736. [Google Scholar] [CrossRef]
- Huang, C.; Zhang, Q.; Xiao, M. Influences of ENSO, NAO, IOD and PDO on precipitation regimes in the Pearl River basin. Acta Sci. Nat. Univ. Sunyatseni 2016, 55, 134–142. (In Chinese) [Google Scholar]
- Min, X.; Zhang, M. Numerical simulation of the Indian Ocean Dipole influence on climate variations over East Asian Monsoon region during equator east pacific SSTA. J. Trop. Meteorol. 2004, 20, 375–382. (In Chinese) [Google Scholar]
- Jia, L.; Zhou, S. The effect of Indian Ocean SST anomaly on Indian Monsoon and summer precipitation over Tibetan Plateau. Plateau Meteorol. 2003, 22, 132–137. (In Chinese) [Google Scholar]
- Zhang, Q.; Li, J.; Singh, V.; Xu, C.; Deng, J. Influence of ENSO on precipitation in the East River basin, south China. J. Geophys. Res Atmos. 2013, 118, 2207–2219. [Google Scholar] [CrossRef]
- Climate change enhances the severity and variability of drought in the Pearl River basin in South China in the 21st century. Agricul. Forest Meteorol. 2018, 249, 149–162. [CrossRef]
- Yang, X.; Zhang, M.; He, X.; Ren, L.; Pan, M.; Yu, X.; Wei, Z.; Sheffield, J. Contrasting influences of human activities on hydrological drought regimes over China based on high-resolution simulations. Water Resour. Res. 2020, 56, e2019WR025843. [Google Scholar] [CrossRef]


| No. | Time Span of Drought Events | Duration (Months) | WSDI | Drought Area Percentage (%) | Local Meteorological Data Validation (Y/N) | ||||
|---|---|---|---|---|---|---|---|---|---|
| Peak Magnitude | Average Magnitude | Severity | Peak Magnitude | Average Magnitude | Cumulative Magnitude | ||||
| 1 | 200307–200406 | 12 | −1.7852 | −0.9388 | −11.2652 | 100.00 | 87.60 | 1051.15 | - |
| 2 | 200410–200505 | 8 | −1.6718 | −1.2597 | −10.0776 | 100.00 | 99.68 | 797.44 | Y |
| 3 | 200507–200605 | 11 | −1.6282 | −0.9810 | −10.7907 | 100.00 | 94.38 | 1038.22 | Y |
| 4 | 200609–200705 | 9 | −0.9943 | −0.5177 | −4.6590 | 100.00 | 90.28 | 812.50 | Y |
| 5 | 200710–200805 | 8 | −1.3530 | −0.7105 | −5.6841 | 100.00 | 90.43 | 723.45 | Y |
| 6 | 200901–200906 | 6 | −0.8185 | −0.3814 | −2.2884 | 100.00 | 70.20 | 421.17 | Y |
| 7 | 200909–201005 | 9 | −1.8509 | −1.1458 | −10.3120 | 100.00 | 97.15 | 874.39 | Y |
| 8 | 201011–201207 | 21 | −1.7394 | −0.5912 | −12.4149 | 100.00 | 88.03 | 1848.56 | Y |
| 9 | 201305–201310 | 6 | −0.6143 | −0.3546 | −2.1276 | 79.49 | 61.50 | 368.97 | Y |
| 10 | 201406–201408 | 3 | −0.7469 | −0.4754 | −1.4262 | 69.18 | 60.63 | 181.90 | Y |
| 11 | 201504–201508 | 5 | −1.8096 | −0.8534 | −4.2668 | 100.00 | 82.13 | 410.65 | Y |
| 12 | 201706–201711 | 6 | −1.0703 | −0.6612 | −3.9671 | 100.00 | 74.32 | 445.95 | Y |
| 13 | 201807–201809 | 3 | −0.5566 | −0.4366 | −1.3099 | 84.81 | 70.24 | 210.71 | Y |
| 14 | 201911–202004 | 10 | −1.0355 | −0.4898 | −4.8976 | 100.00 | 84.99 | 849.89 | Y |
| Variance | PRB | NBPRB | HRB | YRB | WRB | NRB | ERB | PRD | ||||||||
|---|---|---|---|---|---|---|---|---|---|---|---|---|---|---|---|---|
| CC | VIP | CC | VIP | CC | VIP | CC | VIP | CC | VIP | CC | VIP | CC | VIP | CC | VIP | |
| WSDI vs. PPT | 0.2603 | 0.4018 | 0.1024 | 0.1438 | 0.2871 | 0.4897 | 0.1640 | 0.2609 | 0.2338 | 0.3969 | 0.1689 | 0.3604 | 0.1627 | 0.4018 | 0.1660 | 0.4359 |
| WSDI vs. runoff | 0.2873 | 0.4896 | 0.1482 | 0.3012 | 0.2713 | 0.4366 | 0.2097 | 0.4263 | 0.2320 | 0.3906 | 0.1635 | 0.3375 | 0.1986 | 0.5984 | 0.1583 | 0.3965 |
| WSDI vs. SM | 0.6477 | 2.4888 | 0.4561 | 2.8542 | 0.6750 | 2.7032 | 0.5222 | 2.6439 | 0.5745 | 2.3963 | 0.4128 | 2.1528 | 0.3473 | 1.8299 | 0.3740 | 2.2119 |
| WSDI vs. GW | 0.5607 | 1.8651 | 0.2758 | 1.0434 | 0.5621 | 1.8745 | 0.4462 | 1.9302 | 0.5733 | 2.3859 | 0.4670 | 2.7546 | 0.4356 | 2.8784 | 0.4150 | 2.7229 |
| WSDI vs. ET | 0.3566 | 0.7543 | 0.3379 | 1.5667 | 0.2890 | 0.4955 | 0.2759 | 0.7377 | 0.2432 | 0.4294 | 0.7166 | 0.3940 | 0.1346 | 0.2751 | 0.1197 | 0.2265 |
Disclaimer/Publisher’s Note: The statements, opinions and data contained in all publications are solely those of the individual author(s) and contributor(s) and not of MDPI and/or the editor(s). MDPI and/or the editor(s) disclaim responsibility for any injury to people or property resulting from any ideas, methods, instructions or products referred to in the content. |
© 2023 by the authors. Licensee MDPI, Basel, Switzerland. This article is an open access article distributed under the terms and conditions of the Creative Commons Attribution (CC BY) license (https://creativecommons.org/licenses/by/4.0/).
Share and Cite
Cui, L.; Chen, X.; An, J.; Yao, C.; Su, Y.; Zhu, C.; Li, Y. Spatiotemporal Variation Characteristics of Droughts and Their Connection to Climate Variability and Human Activity in the Pearl River Basin, South China. Water 2023, 15, 1720. https://doi.org/10.3390/w15091720
Cui L, Chen X, An J, Yao C, Su Y, Zhu C, Li Y. Spatiotemporal Variation Characteristics of Droughts and Their Connection to Climate Variability and Human Activity in the Pearl River Basin, South China. Water. 2023; 15(9):1720. https://doi.org/10.3390/w15091720
Chicago/Turabian StyleCui, Lilu, Xiusheng Chen, Jiachun An, Chaolong Yao, Yong Su, Chengkang Zhu, and Yu Li. 2023. "Spatiotemporal Variation Characteristics of Droughts and Their Connection to Climate Variability and Human Activity in the Pearl River Basin, South China" Water 15, no. 9: 1720. https://doi.org/10.3390/w15091720