

Water Density Variations of the Aral Sea from GRACE and GRACE-FO Monthly Solutions


1
Department of Geodesy and Surveying, Budapest University of Technology and Economics, 1111 Budapest, Hungary
2
Geological and Environmental Sciences, Western Michigan University, Kalamazoo, MI 49008, USA
*
Author to whom correspondence should be addressed.
Water 2023, 15(9), 1725; https://doi.org/10.3390/w15091725
Submission received: 20 March 2023
/
Revised: 21 April 2023
/
Accepted: 25 April 2023
/
Published: 29 April 2023
(This article belongs to the Special Issue Novel Perspective for Interactions between Water and the Geology Using GRACE and Remote Sensing Data)
Abstract
:The Gravity Recovery and Climate Experiment (GRACE) and its successor, the GRACE Follow-On (GRACE-FO) gravity satellite missions, have been providing monthly gravity field solutions for almost 20 years, enabling a unique opportunity to monitor large-scale mass variation processes. The gravity anomaly time series for the Aral Sea region has been obtained for the period of April 2002 to January 2022. The method of determining the gravity anomaly time series from GRACE and GRACE-FO monthly solutions has been improved by considering the mass variations of the Caspian Sea. The gravity anomaly time series was then compared to water mass changes determined by considering variations in the salinity and temperature of seawater. Nevertheless, the tests suggest that improvements in correlation with such information might occur, although the relevance of the improvement should not be overestimated. All in all, it can be demonstrated that salinity changes relevantly influence the gravity field; however, the signal is too weak to inversely obtain information from satellite-borne gravity observations on salinity variations.
1. Introduction
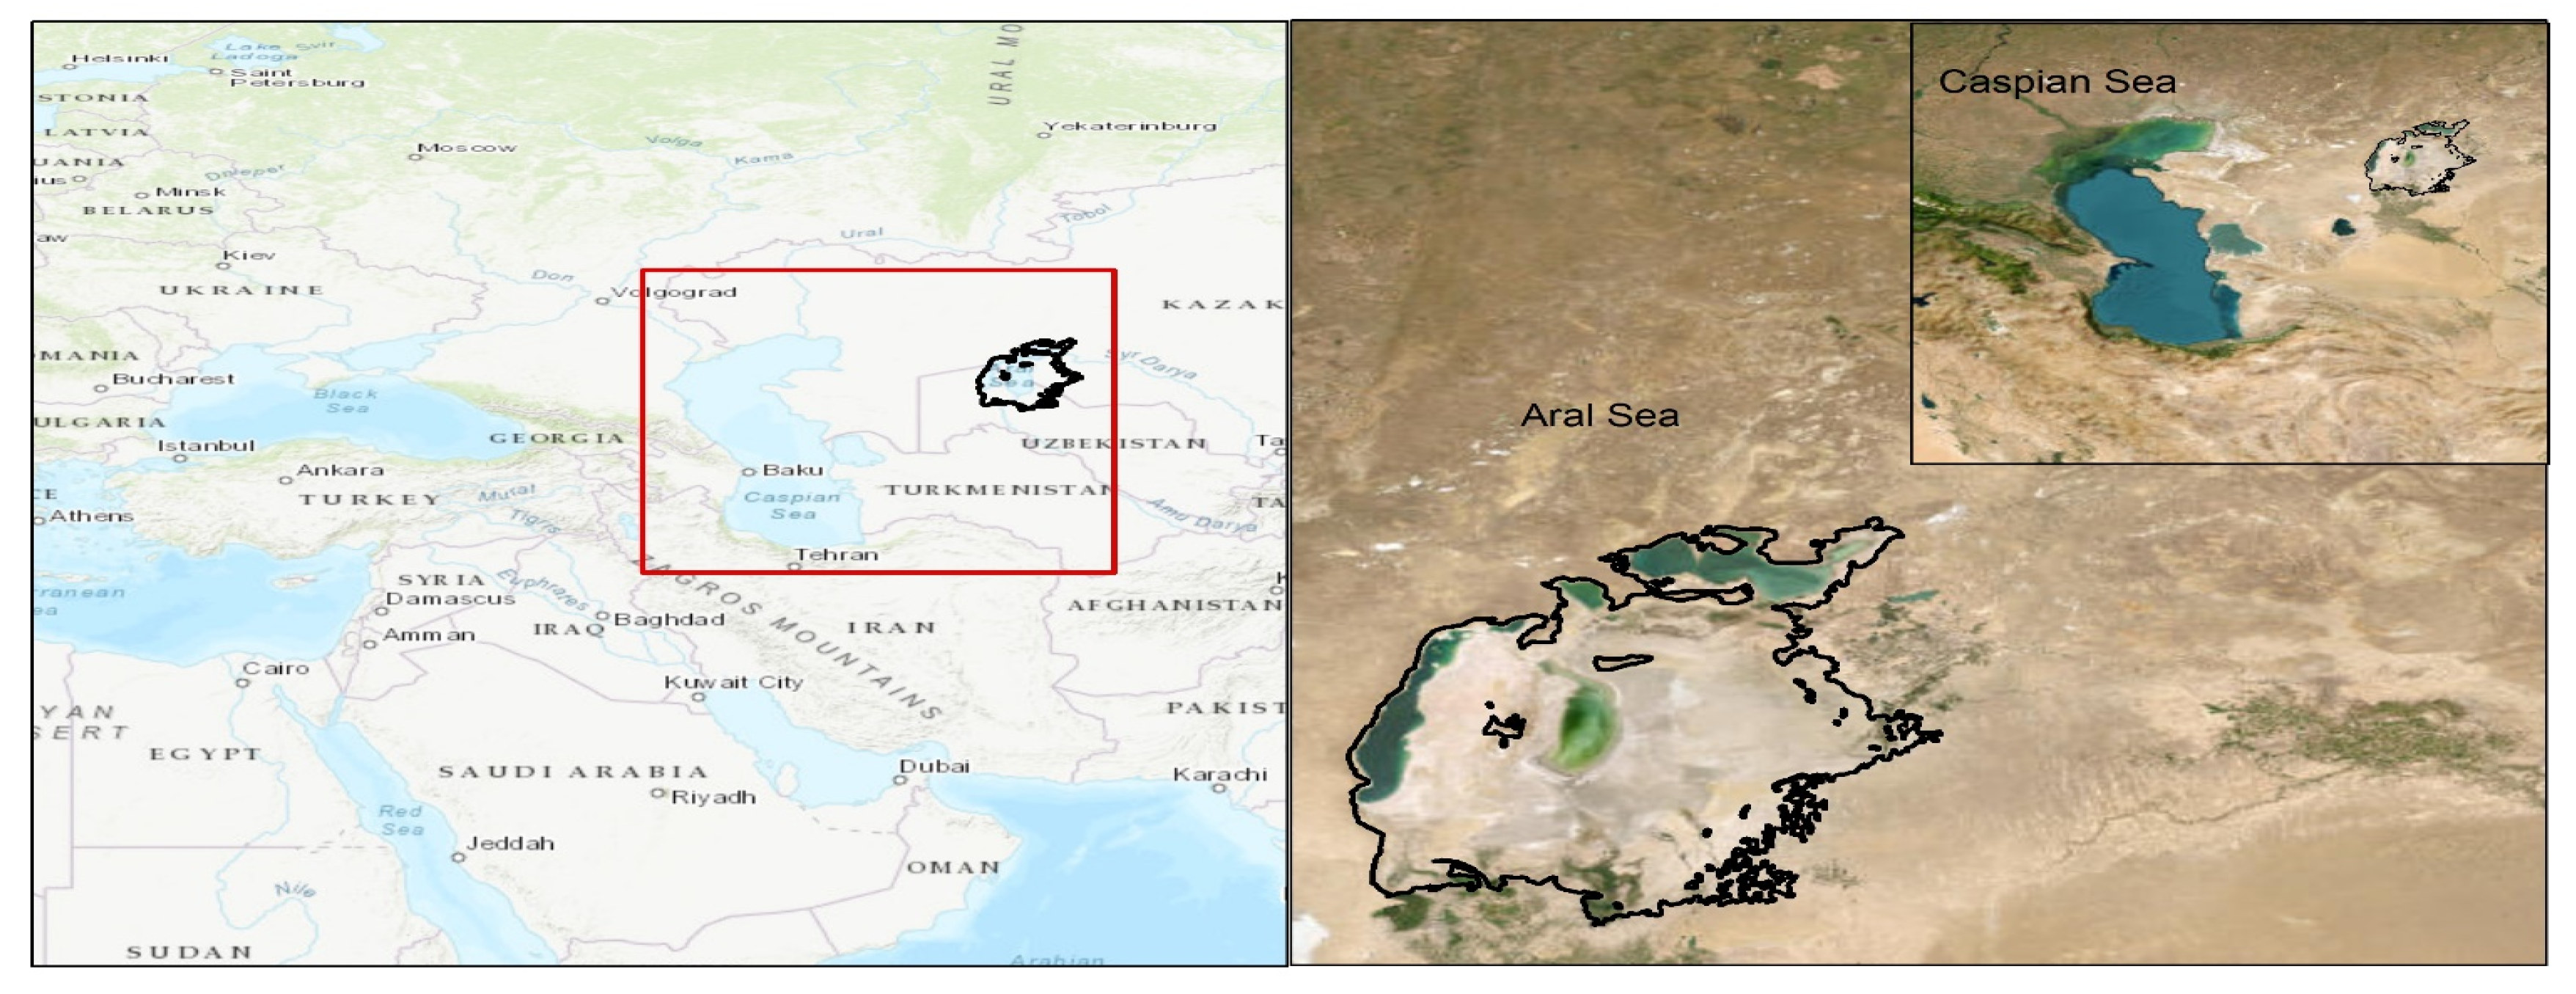
The Aral Sea is in Central Asia and straddles the borders of Kazakhstan and Uzbekistan (Figure 1). The sea was once the fourth-largest lake in the world; however, due to extensive water diversion for irrigation purposes that started in 1990, it has shrunk significantly over the past few decades. The region surrounding the Aral Sea is characterized by a dry desert climate, and the landscape is dominated by flat, sandy plains. Geologically, the area is situated in a tectonic basin, which is surrounded by several mountain ranges. Hydrologically, the Aral Sea is fed by two major rivers, the Amu Darya and the Syr Darya, both of which originate in the Pamir Mountains. However, due to extensive irrigation and water diversion for agriculture, the inflow of these rivers has been significantly reduced, causing a desiccation process carried on by the successor states around the Aral Sea [1]. These problems are generating severe environmental, economic, and human catastrophes, and, at the present time, no solution has been outlined by a feasible plan of action. Hence, the monitoring of the process and forecasting of foreseeable future scenarios with the use of geoscience and geoinformatics tools are essential contributions.
The Gravity Recovery and Climate Experiment (abbr. GRACE) has provided gravity field models with a monthly resolution for the period of 2002 to 2017 [2], and this time series is currently being extended by using the GRACE Follow-On (GRACE-FO) mission from 2018. GRACE-FO is basically identical to GRACE in its orbital configuration and technical design, apart from the inter-satellite range rate measurements, which are performed with lasers in addition to microwaves to achieve more precise results [3]. These two missions provide a unique tool for determining the temporal variations of gravity; consequently, the mass redistribution processes that have generated the gravity changes [4]. GRACE and GRACE-FO have become essential sources of data when monitoring the variation in water fluxes over large basins (e.g., the Mediterranean Sea [5], the Arabian Peninsula [6,7,8], Niger [9], Michigan [10], the Amazonas [11,12,13], the La Plata basins [14,15], the Nubian and Nile basins [16,17,18,19,20,21]), and for the analysis of climate changes via ice mass balance [22,23,24], sea level rise [25,26], ground water storage [27,28,29,30,31], and extreme precipitation [32].
In the present study, a GRACE- and GRACE-FO-based gravity anomaly time series is determined and utilized to analyze the desiccation process of the Aral Sea. This study is a continuation and refinement of the work of Földváry et al. [33]. According to Figure 7 of Földváry et al. [33], in the reservoir of the Aral Sea, the correlation between the water volume change and gravity anomaly was found to be 0.8636, which is a convincing relationship. However, from 2002 to about mid-2005, an increase in the gravity anomaly was determined, which is contrary to the tendencies of the water volume change. In the present study, this unclear feature is analyzed using a more sophisticated method. The refined method considers the effect of the water mass variations of the Caspian Sea at the Aral Sea region; furthermore, the density variations of the water of the Aral Sea are also considered.
2. Geological and Hydrological Setting of the Aral Sea
Cretaux et al. [34] examined the geological context and historical development of the Aral Sea, once the world’s fourth-largest lake. The area is marked by a semi-arid continental climate, characterized by substantial temperature fluctuations and minimal precipitation [35]. The primary sources of water for the Aral Sea are the Amu Darya and Syr Darya rivers, which flow from the eastern and southeastern mountains and provide essential water for agriculture, industry, and human consumption.
The geological origins of the Aral Sea can be traced back to the Neogene period, approximately 23 to 2.6 million years ago [34]. During this time, the region underwent tectonic uplift and subsidence, resulting in the formation of the Turan basin, encompassing the Aral Sea, Caspian Sea, and adjacent plains. In the Pliocene epoch (5.3 to 2.6 million years ago), the Aral Sea and Caspian Sea were part of the expansive Paratethys Sea, a large inland sea spanning Eurasia [34]. Subsequent changes in the Earth’s crust led to the separation of the Aral Sea and Caspian Sea, each forming their own basins.
Throughout history, the Aral Sea has experienced significant fluctuations in its water level, influenced by factors such as climate, tectonics, and human activities [1]. Over the past several millennia, the sea level has undergone considerable changes, with high levels corresponding to wetter climates and low levels associated with arid conditions. The historical development of the Aral Sea can be categorized into several stages based on these fluctuations, including the Medieval Climatic Optimum (9th to 14th century) and the Little Ice Age (14th to 19th century) [36,37]. During the 20th century, however, human intervention had become the primary driver of change in the Aral Sea. Large-scale irrigation projects were initiated in the 1960s to develop agriculture in the region, leading to a dramatic decrease in water levels [1,34]. Moreover, the overextraction of water from the Amu Darya and Syr Darya rivers has exacerbated the situation, causing the sea to shrink significantly, and split into two separate bodies of water—the North Aral Sea (Small Aral) and the South Aral Sea (Large Aral) [1,34].
This transformation has had profound ecological, social, and economic consequences, including the collapse of the local fishing industry, the loss of unique ecosystems, and the emergence of health issues among local populations [34,38]. Efforts to mitigate these issues and restore the Aral Sea have been implemented, such as the construction of the Kok-Aral Dam in 2005 to stabilize the North Aral Sea’s water levels. However, the future of the Aral Sea remains uncertain, with ongoing scientific debates surrounding the effectiveness of these measures and the potential for long-term recovery [34].
In summary, the Aral Sea’s geological history spans millions of years, shaped by tec-tonic events, climatic fluctuations, and human activities. The profound changes in the sea level over time have had significant implications for the region’s ecosystems, societies, and economies. The challenges posed by the Aral Sea’s ongoing transformation have led to various efforts to address the problem, with the future of the sea remaining a topic of considerable scientific debate [1,34].
3. Methodology
Generally, the time series of the gravity anomaly, ∆g, has been determined using the classical spherical harmonic synthesis formulation. For the GRACE and GRACE-FO gravity anomaly calculations, monthly solutions released by UTC CSR were used [2]. The version of the model was the RL06, with coefficients up to degree and order 60. The gravity anomaly time series was determined for the period of April 2002 to January 2022. Using GRACE and GRACE-FO monthly solutions, the spherical harmonic coefficients were smoothed with a Gaussian filter of 300 km; additionally, the de-striping filter of Swenson and Wahr [39] was applied to them. This determined the gravity anomaly over a wide region of the Aral Sea on a 0.1 degree raster.
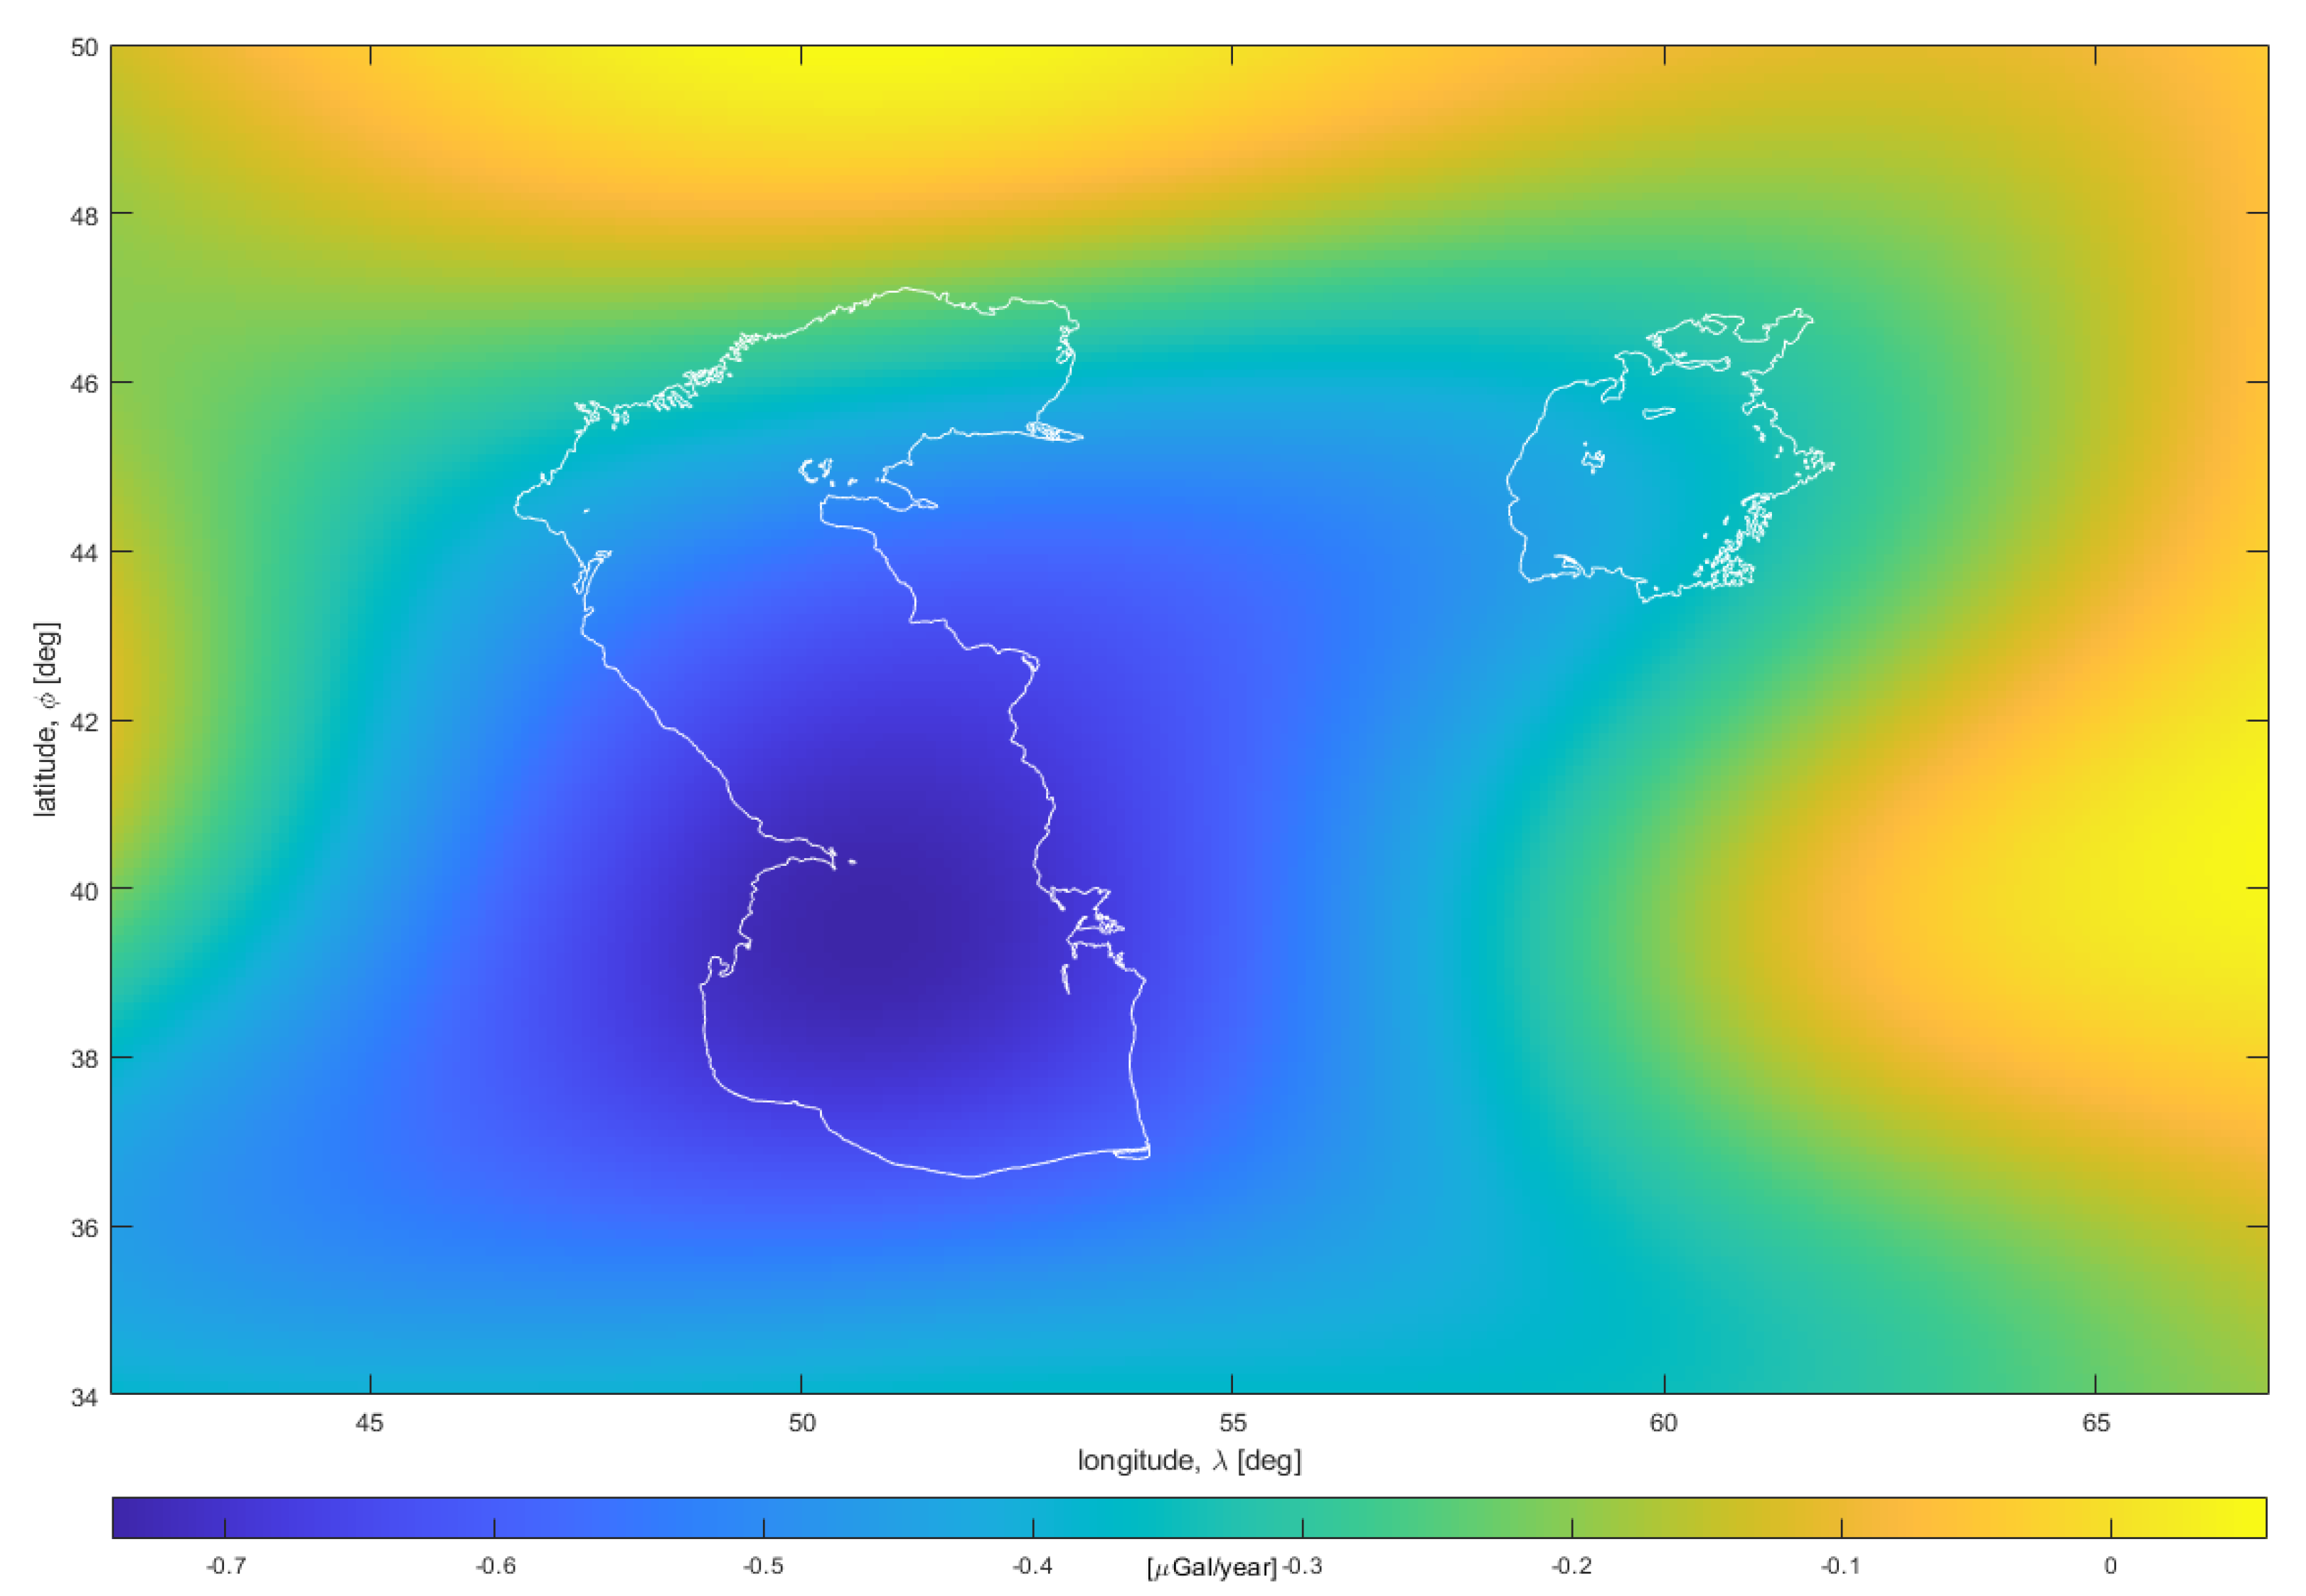
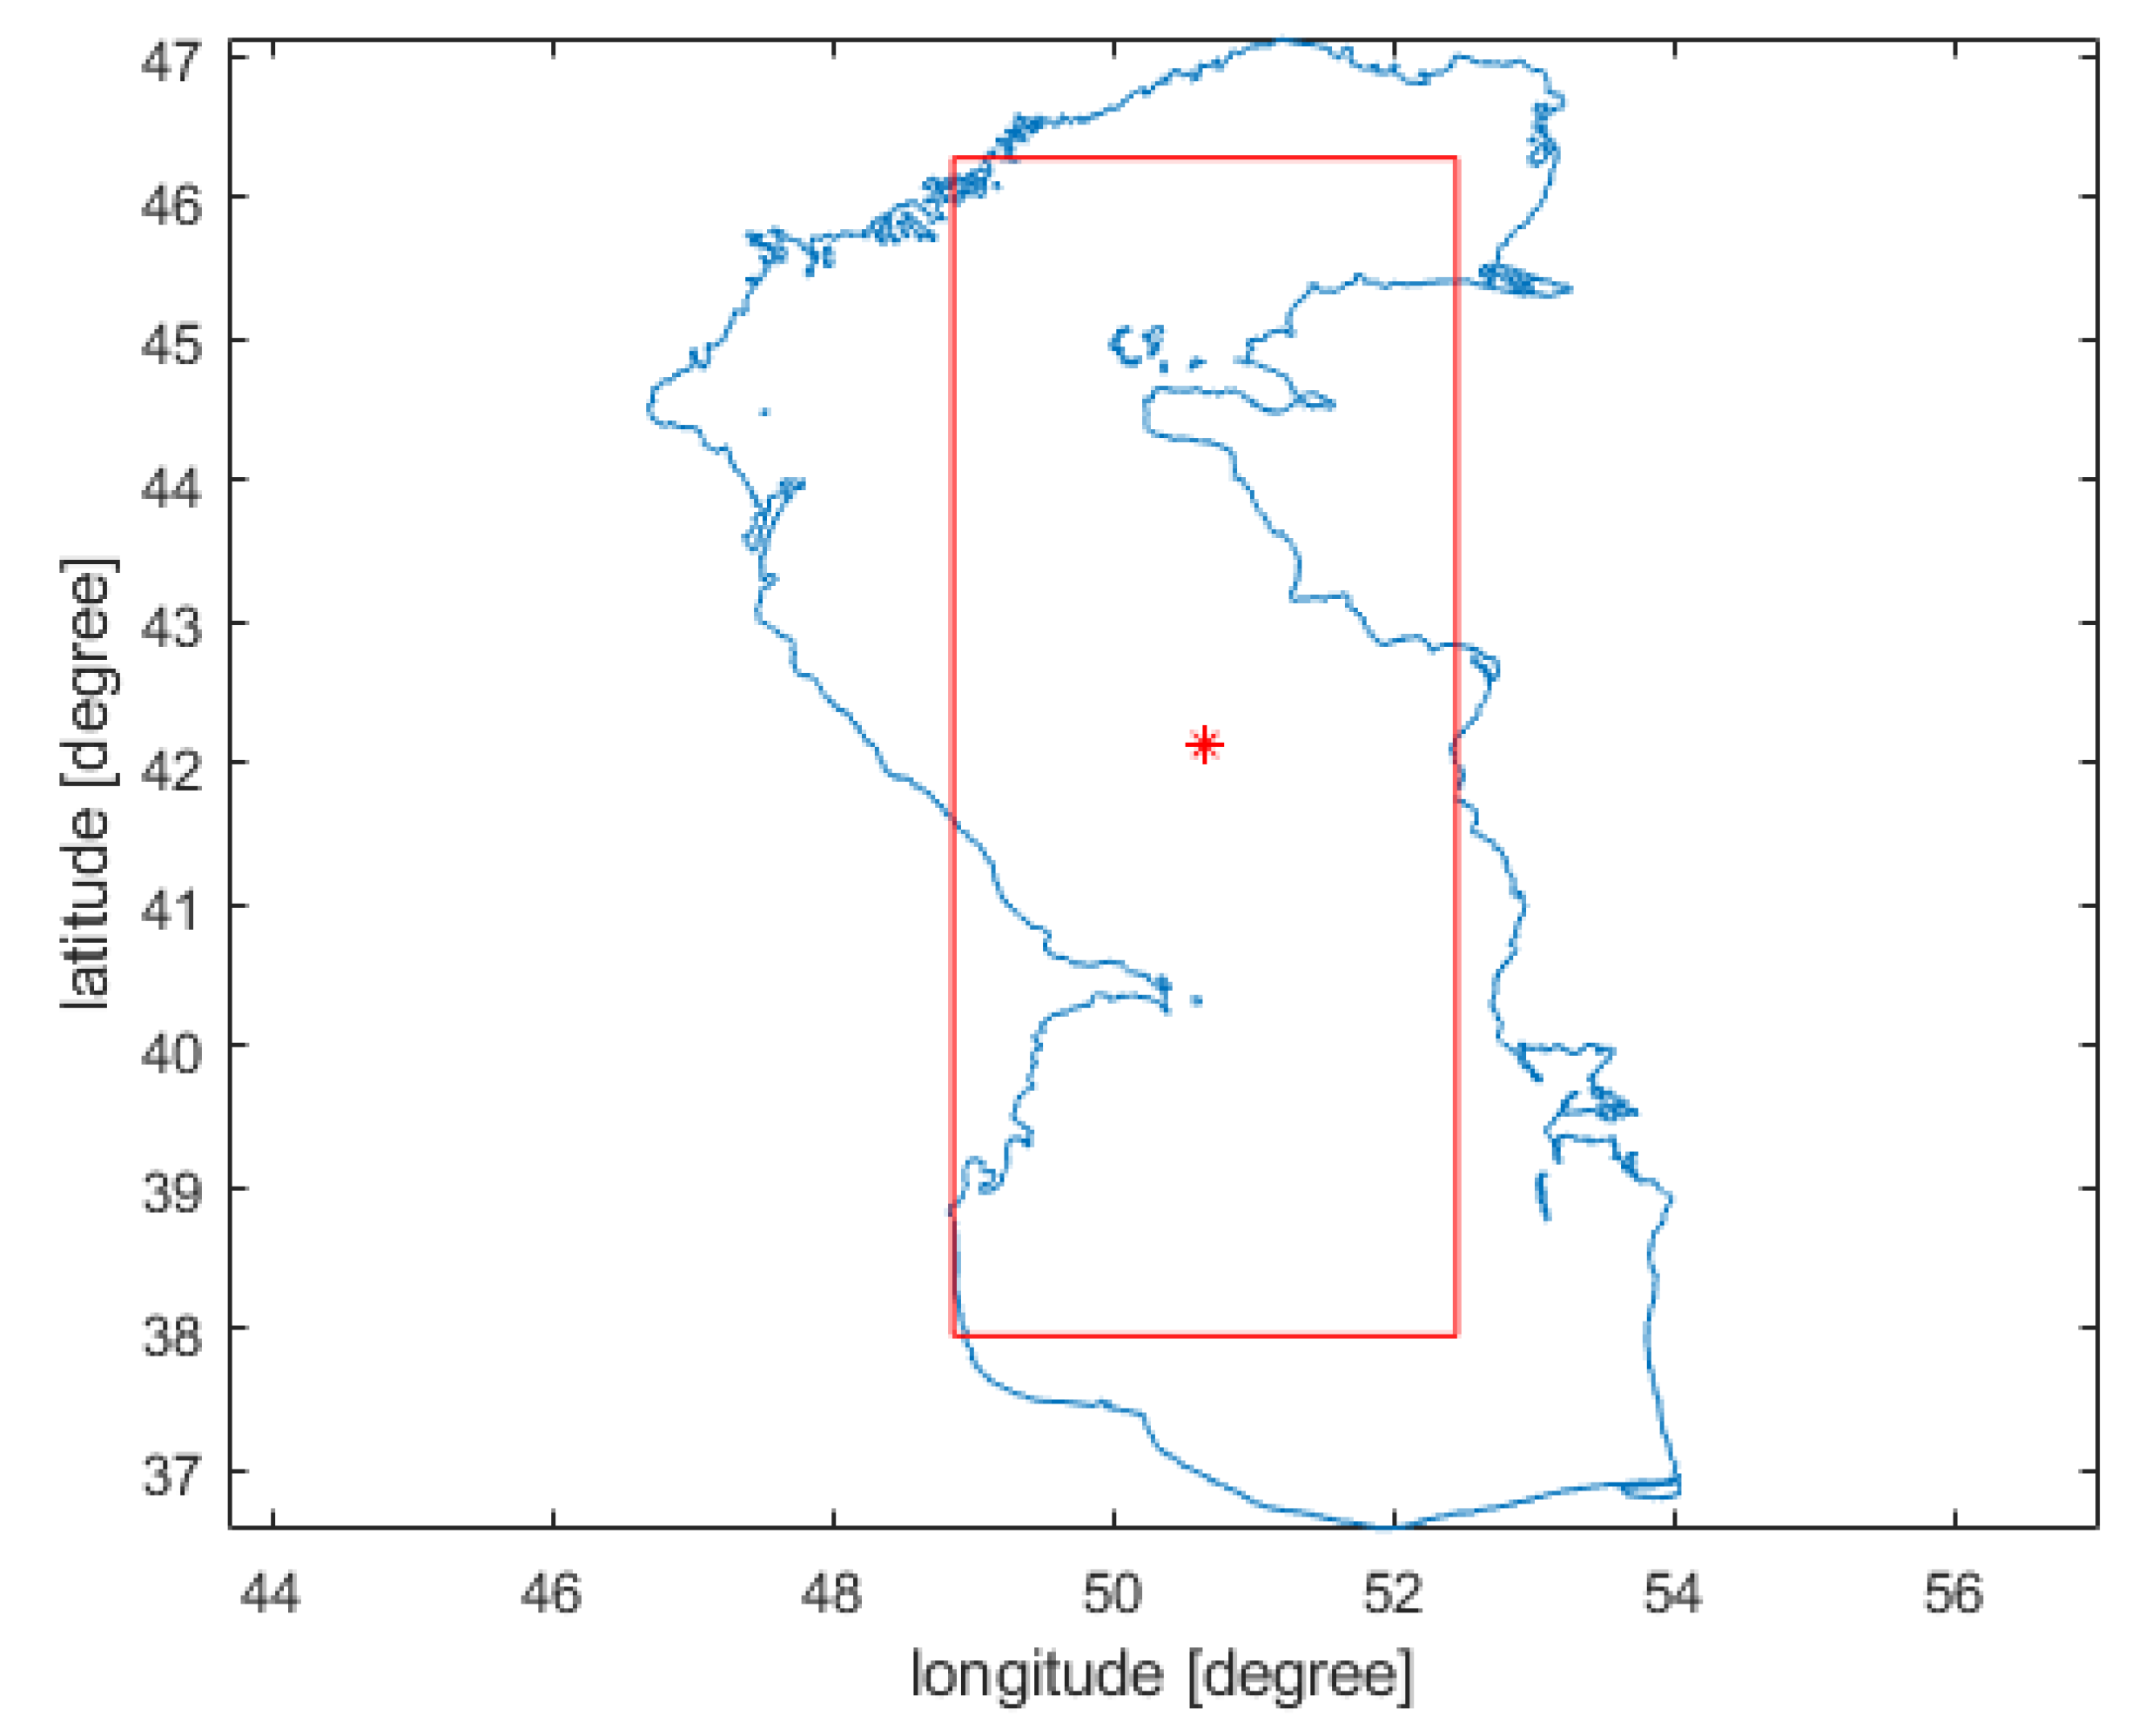
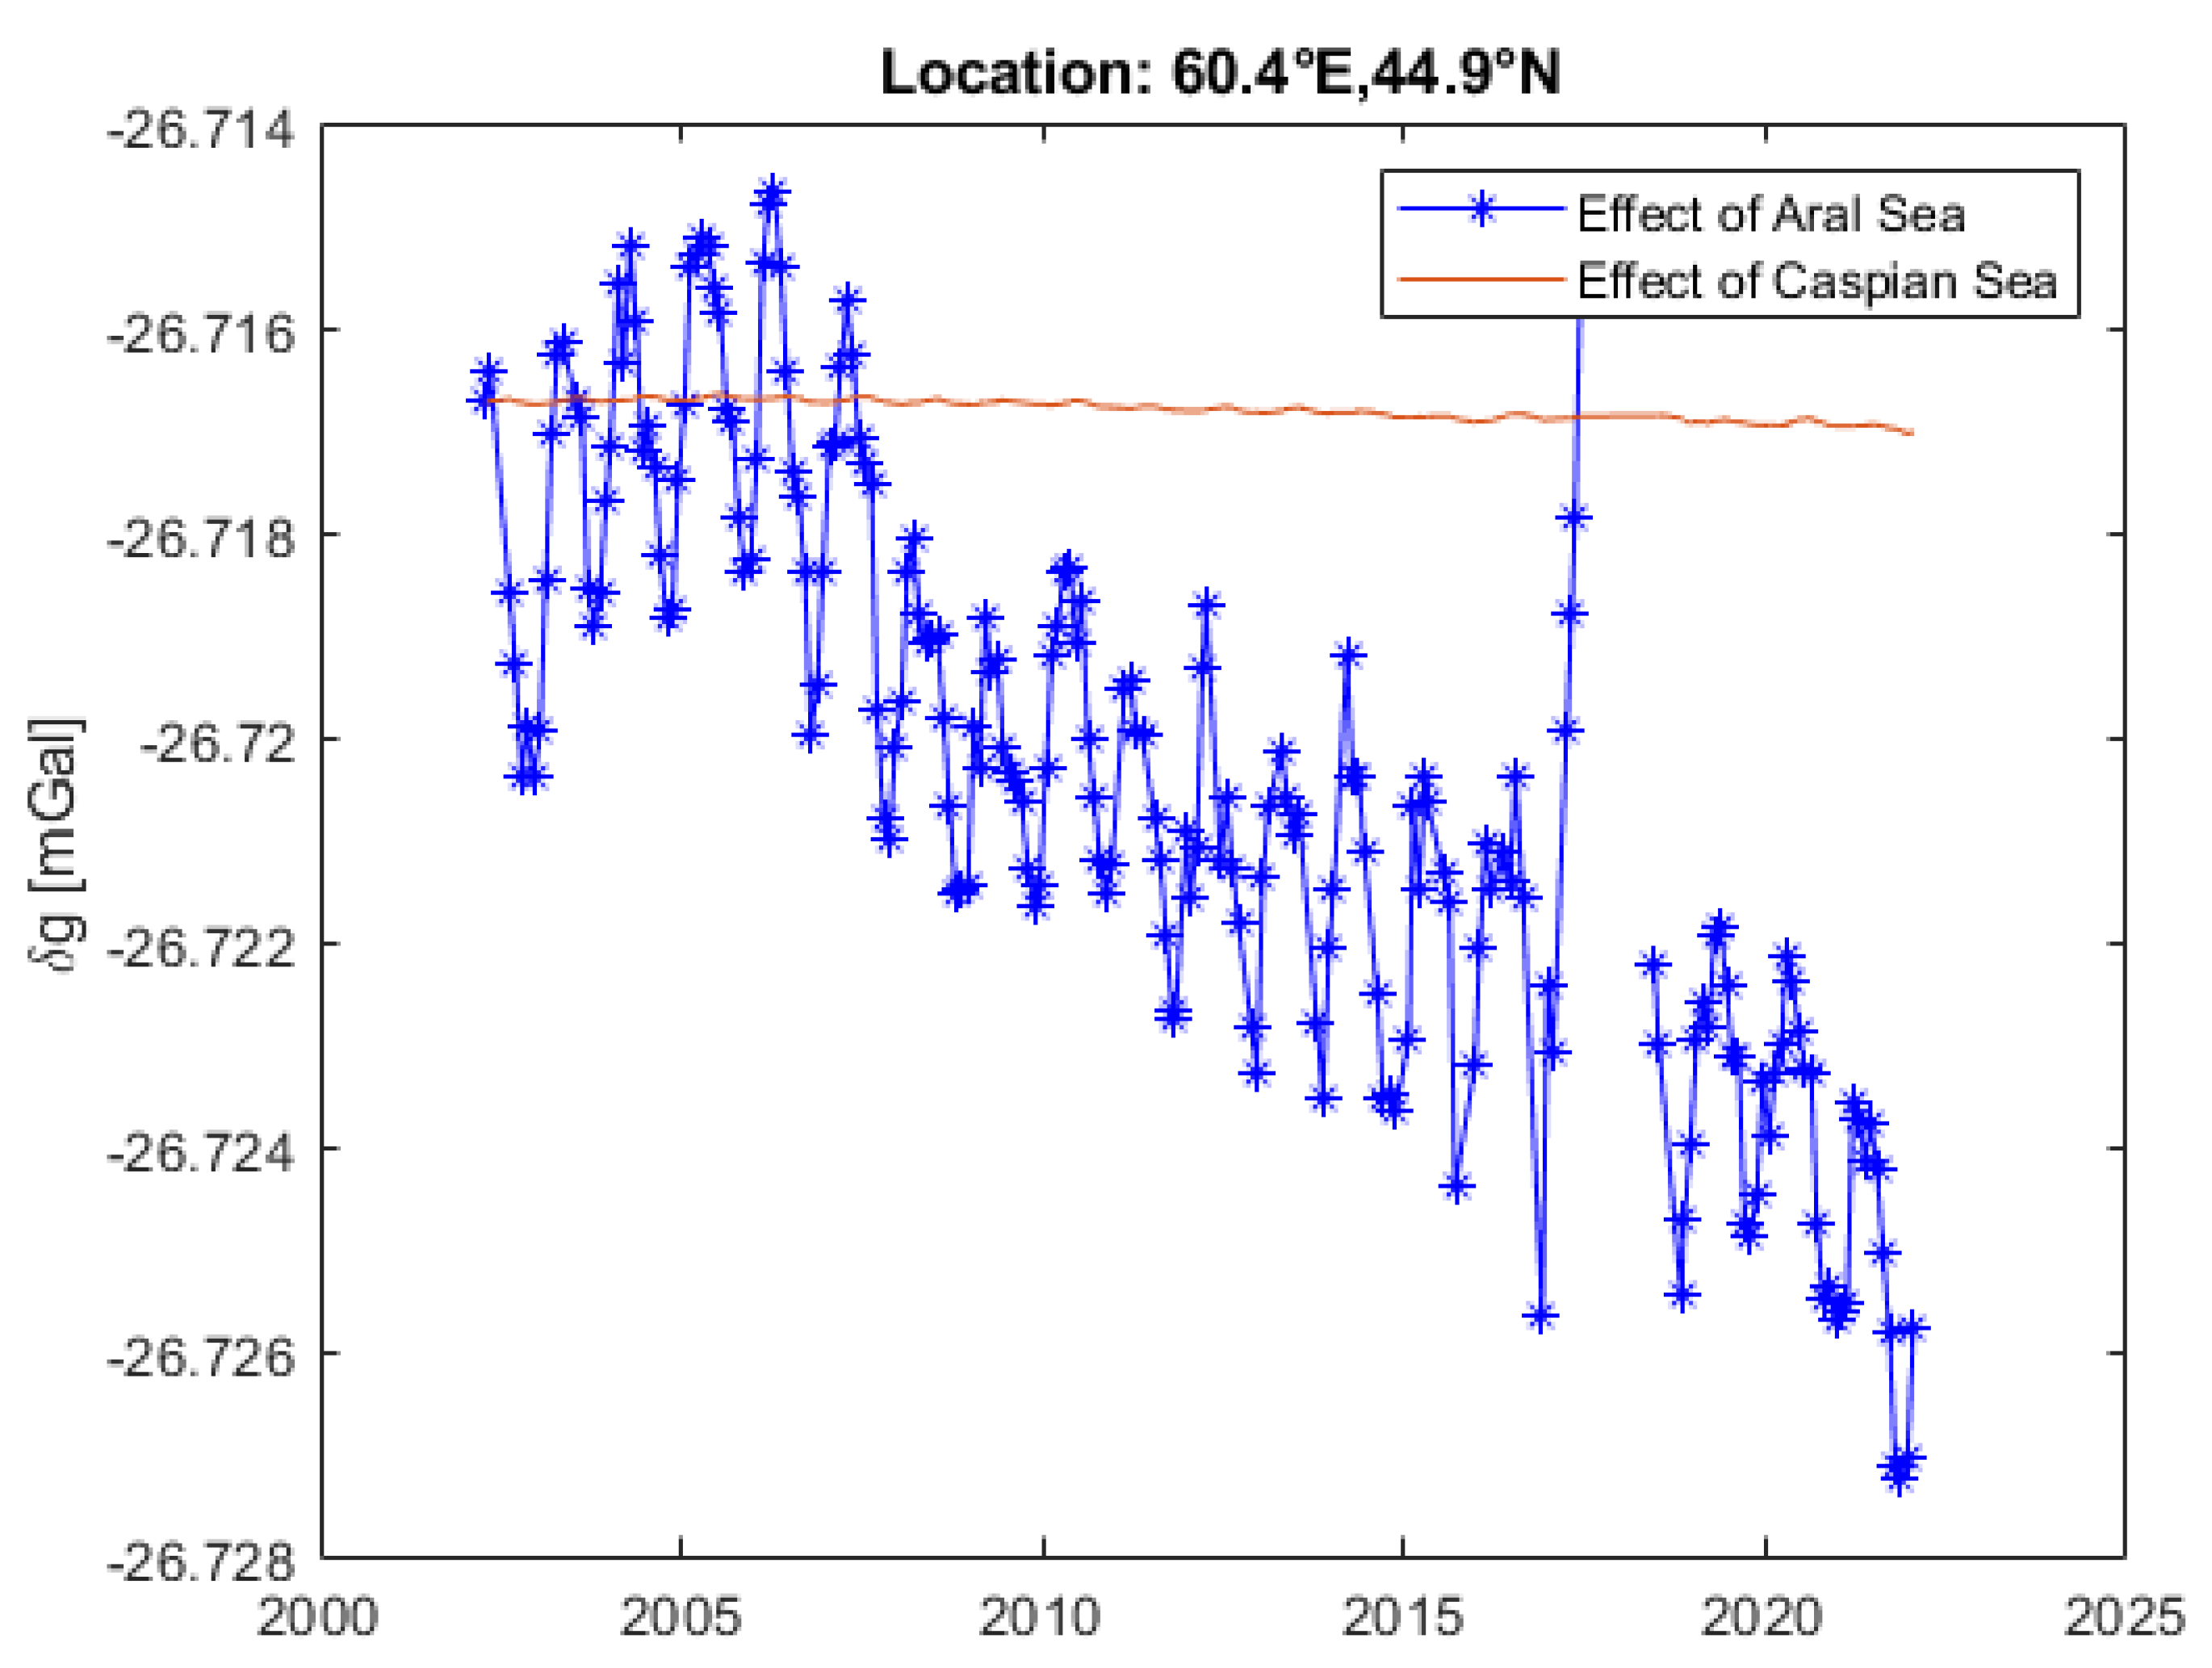
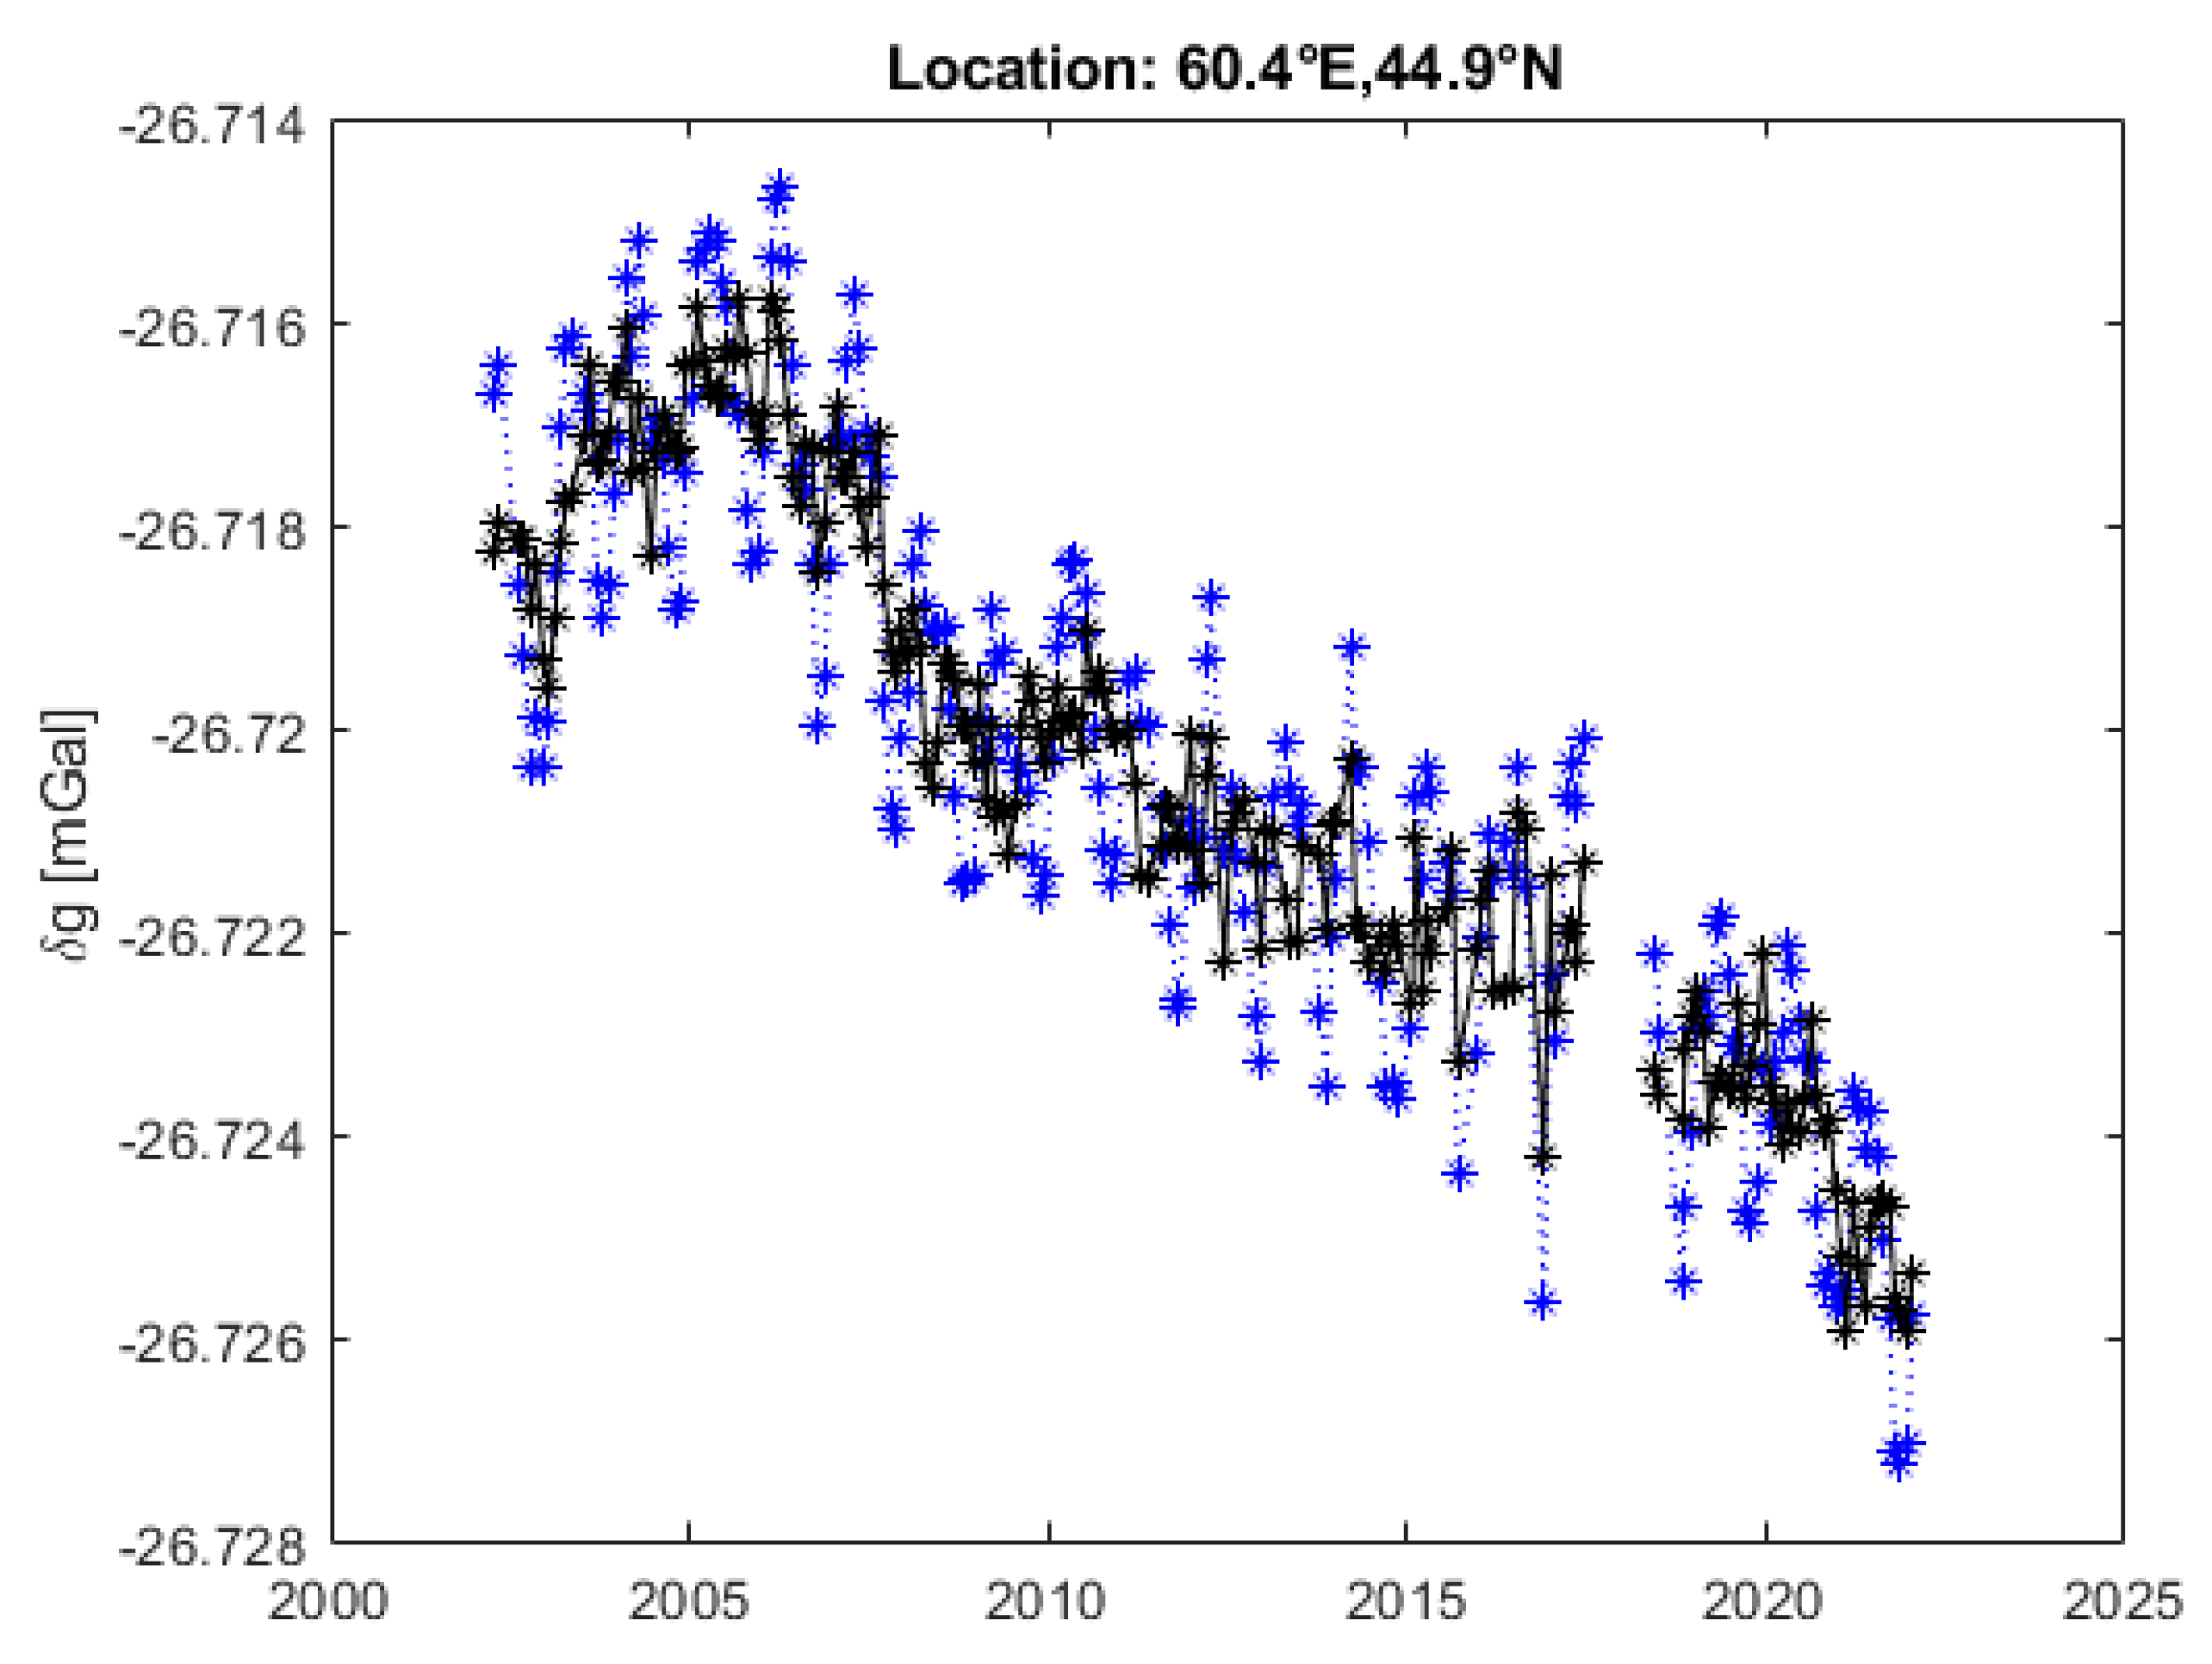
Subsequently, a linear trend on the gravity anomaly time series was fitted to capture long-term variations. The resulting trends are visualized in Figure 2 [33]. Apparently, mass variations of the Caspian Sea have an impact on the gravity anomaly variations of the Aral Sea. Therefore, in the present study, the gravity anomaly time series over the Aral basin was corrected for the gravity variations of the Caspian Sea. For this purpose, the prism modeling described in [40] was used. Since the effect of the Caspian Sea is orders of magnitude smaller than that of the Aral Sea (when the location of the calculation is the center of the Aral Sea), an approximate modeling of the Caspian Sea mass variations was deemed to be sufficient. Accordingly, the shape of the Caspian Sea was replaced with a rectangle with the same area (400 km wide and 927.5 km long, equivalent to the 371,000 km2 area of the Caspian Sea) and positioned in the geometrical center of the Caspian Sea (Figure 3). This way, by multiplying the area of the rectangle with the height variations of the water level, the Caspian Sea was simplified to a single prism. Figure 4 shows the time series of the gravity anomaly at the center point of the Aral Sea (60.4° E, 44.9° N), along with the impact of the Caspian Sea at this point. The impact of the Caspian Sea is negligible; however, it may impact the comparison regarding the specific properties of the water bodies. Subsequently, to focus on the trend of variations, seasonality was removed from the times series (Figure 5) and used for further comparison.
The gravity anomaly time series has been compared to the water volume variations of the Aral Sea. Water volume change was modeled by considering all the sub-basins of the Aral Sea. Subsequently, an attempt to determine mass variations involving salinity and temperature to estimate water density was also carried out. The concept assumes that water mass changes directly generate a gravity anomaly change. The water mass change was determined as
where ∆m is the mass change, is the density, and ∆V is the volume change, and each variable varies by time, t. Note that this equation implicitly assumes that the density changes are concentrated only on the surface layers and do not affect the whole water body. This is supported by the fact that, as the desiccation of the Aral Sea began, a quite stable and strong vertical stratification of the main water properties (density, temperature) was observed [41,42] (see also the final paragraph of Section 4). This implicitly assumes that salinity observation may refer only to the layer of observation, which is, in most cases, carried out in the top layer.
To determine the density, , for Equation (1), the method of Millero and Huang [43] was used, in which the density of the water, , is determined as the function of the salinity, S, and temperature, T, of the seawater, as well as the density of pure water, , using
where
The density of pure water was determined according to Millero and Poisson [44]:
Note that the formulation of Millero and Huang [43] is validated for the salinity interval of 5 to 70 kg/m3 and 0 to 90 °C of temperature, and that certain values of the salinity of the Aral Sea exceed this upper limit.
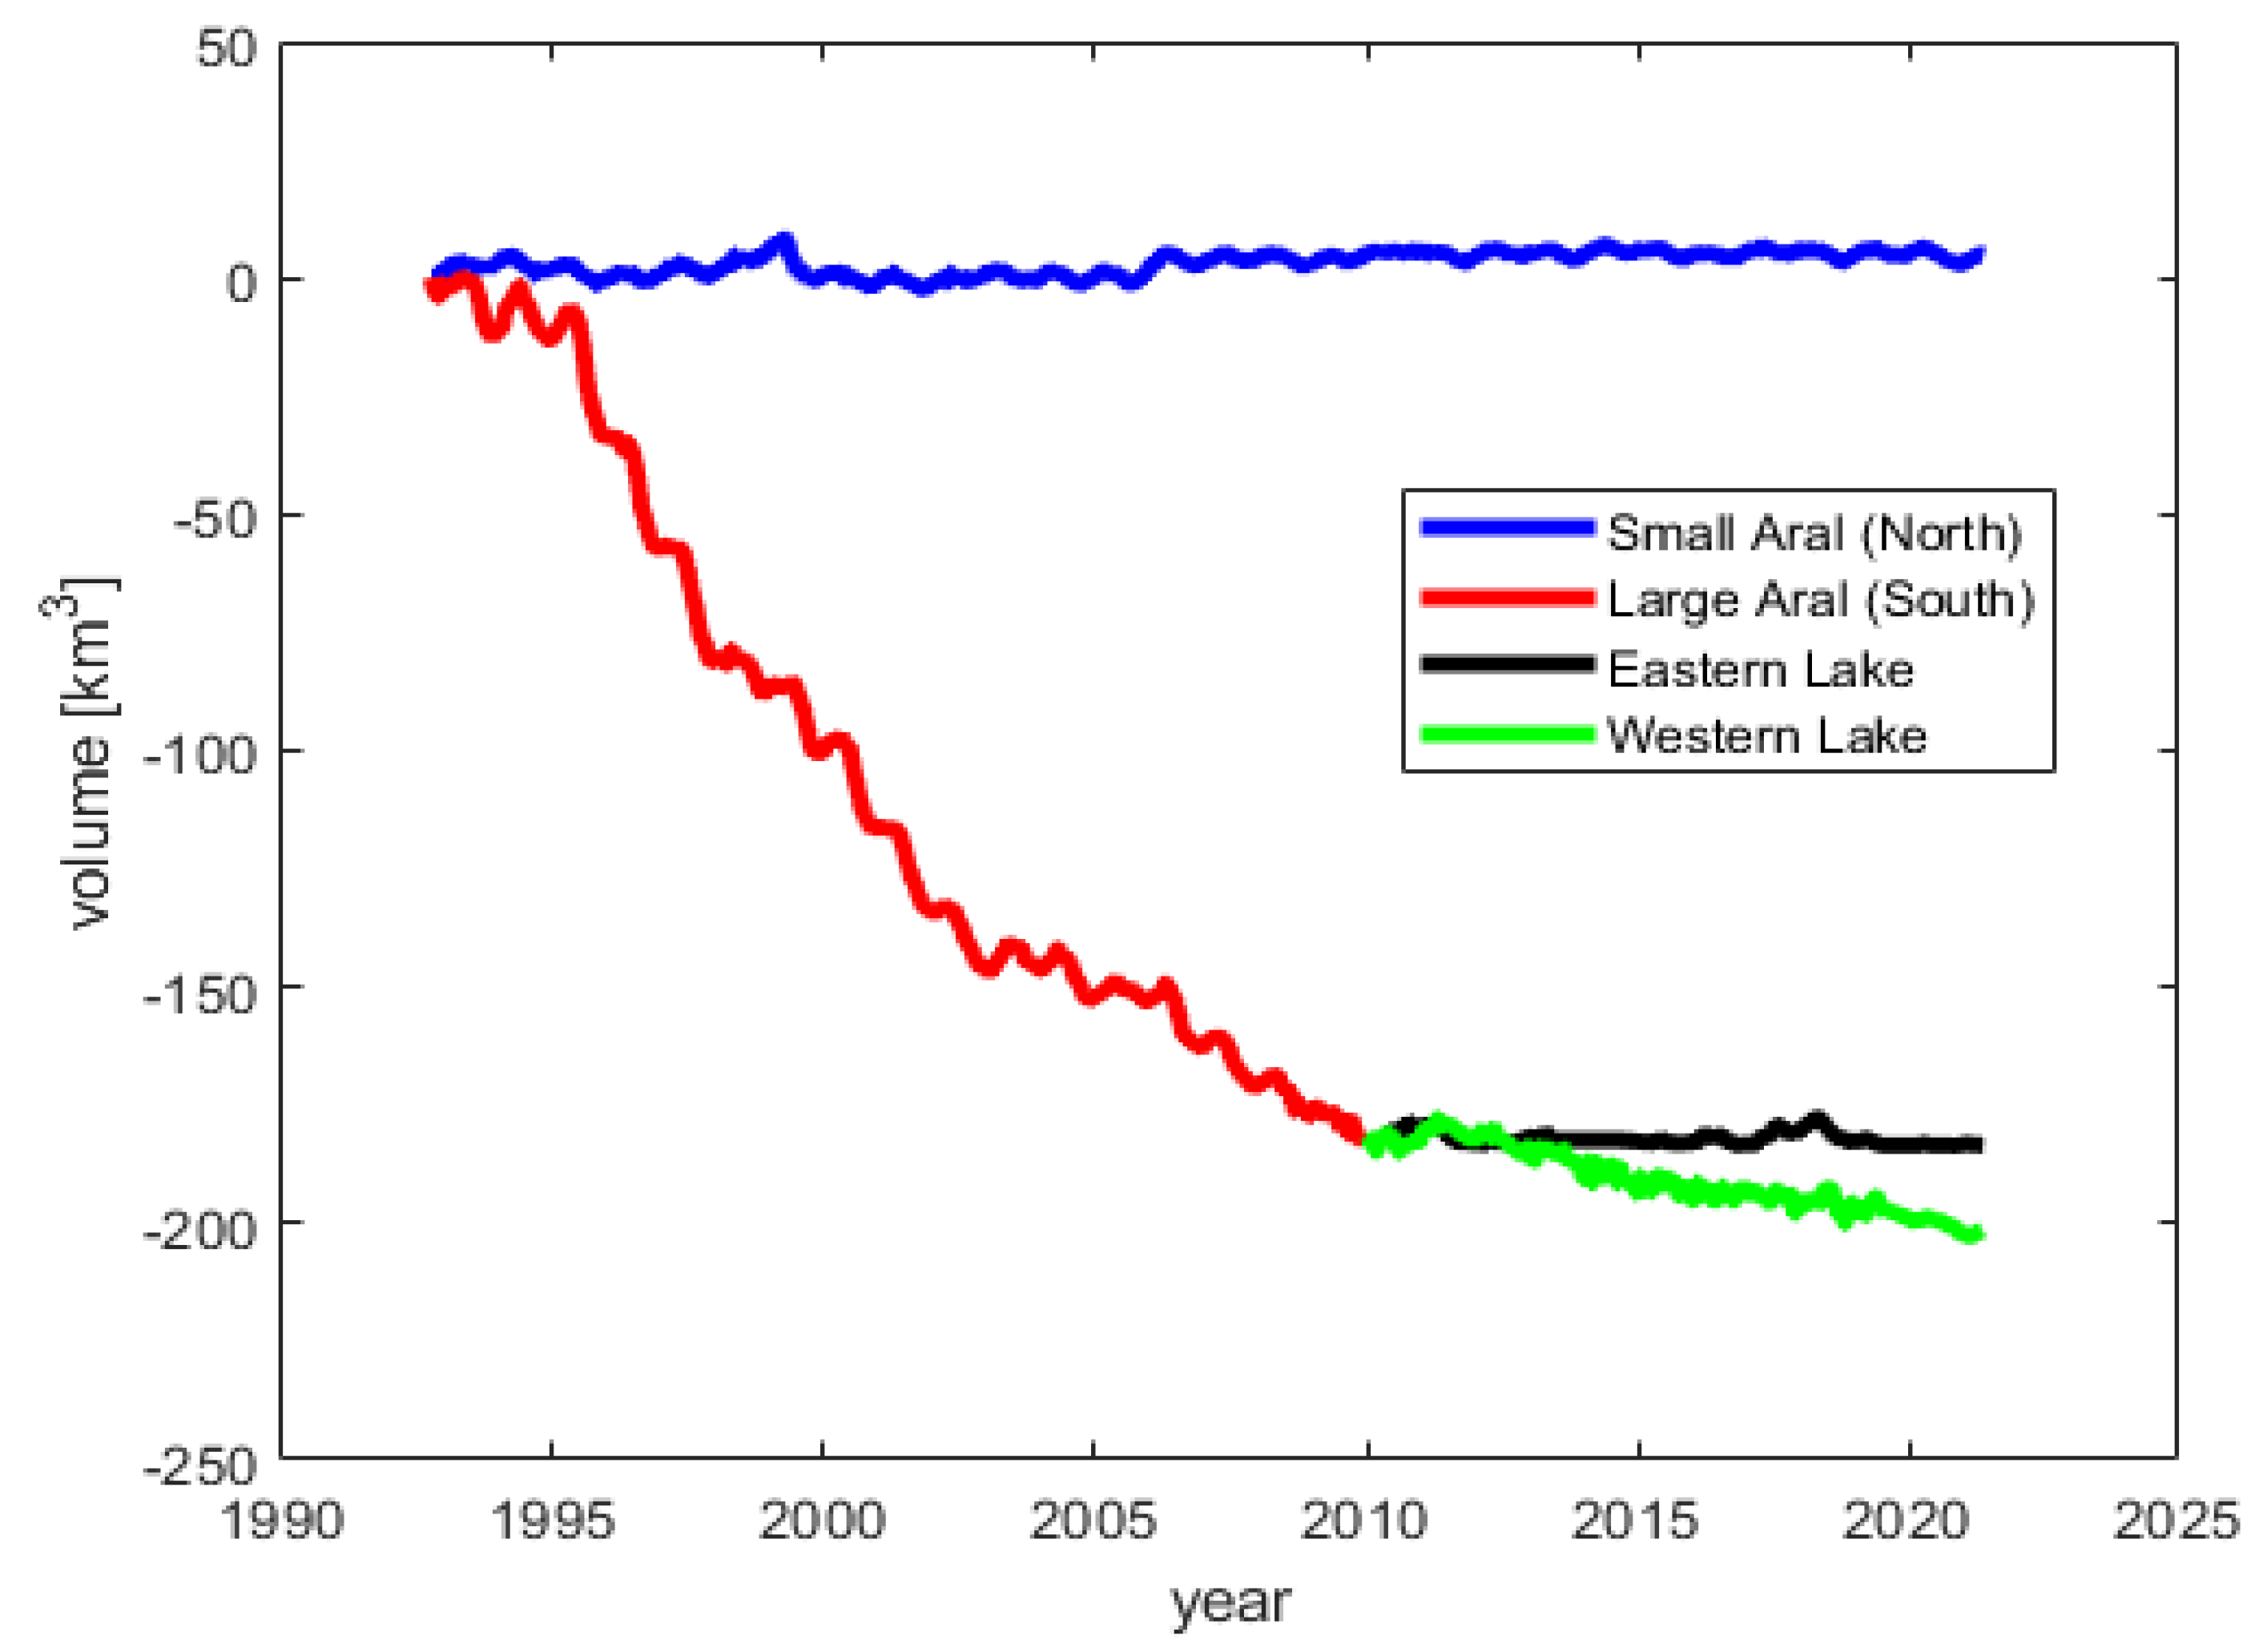
Modeling of the water volume was performed using the Hydroweb data [45]. The data consist of water level, area, and volume information from 1992 to the present day with a nominal temporal resolution of 10 days. To eliminate seasonal variations, annual averages were determined. In Figure 6, water volume data for the Aral Sea are displayed separately for the northern (Small Aral Sea) and the southern reservoirs (Large Aral Sea), where the latter has split into eastern and western lakes around 2010 and is displayed separately from then on. Water volume exhibited a relative change with respect to the first epoch. The total water volume variation was determined by combining the separated basins’ volumes.
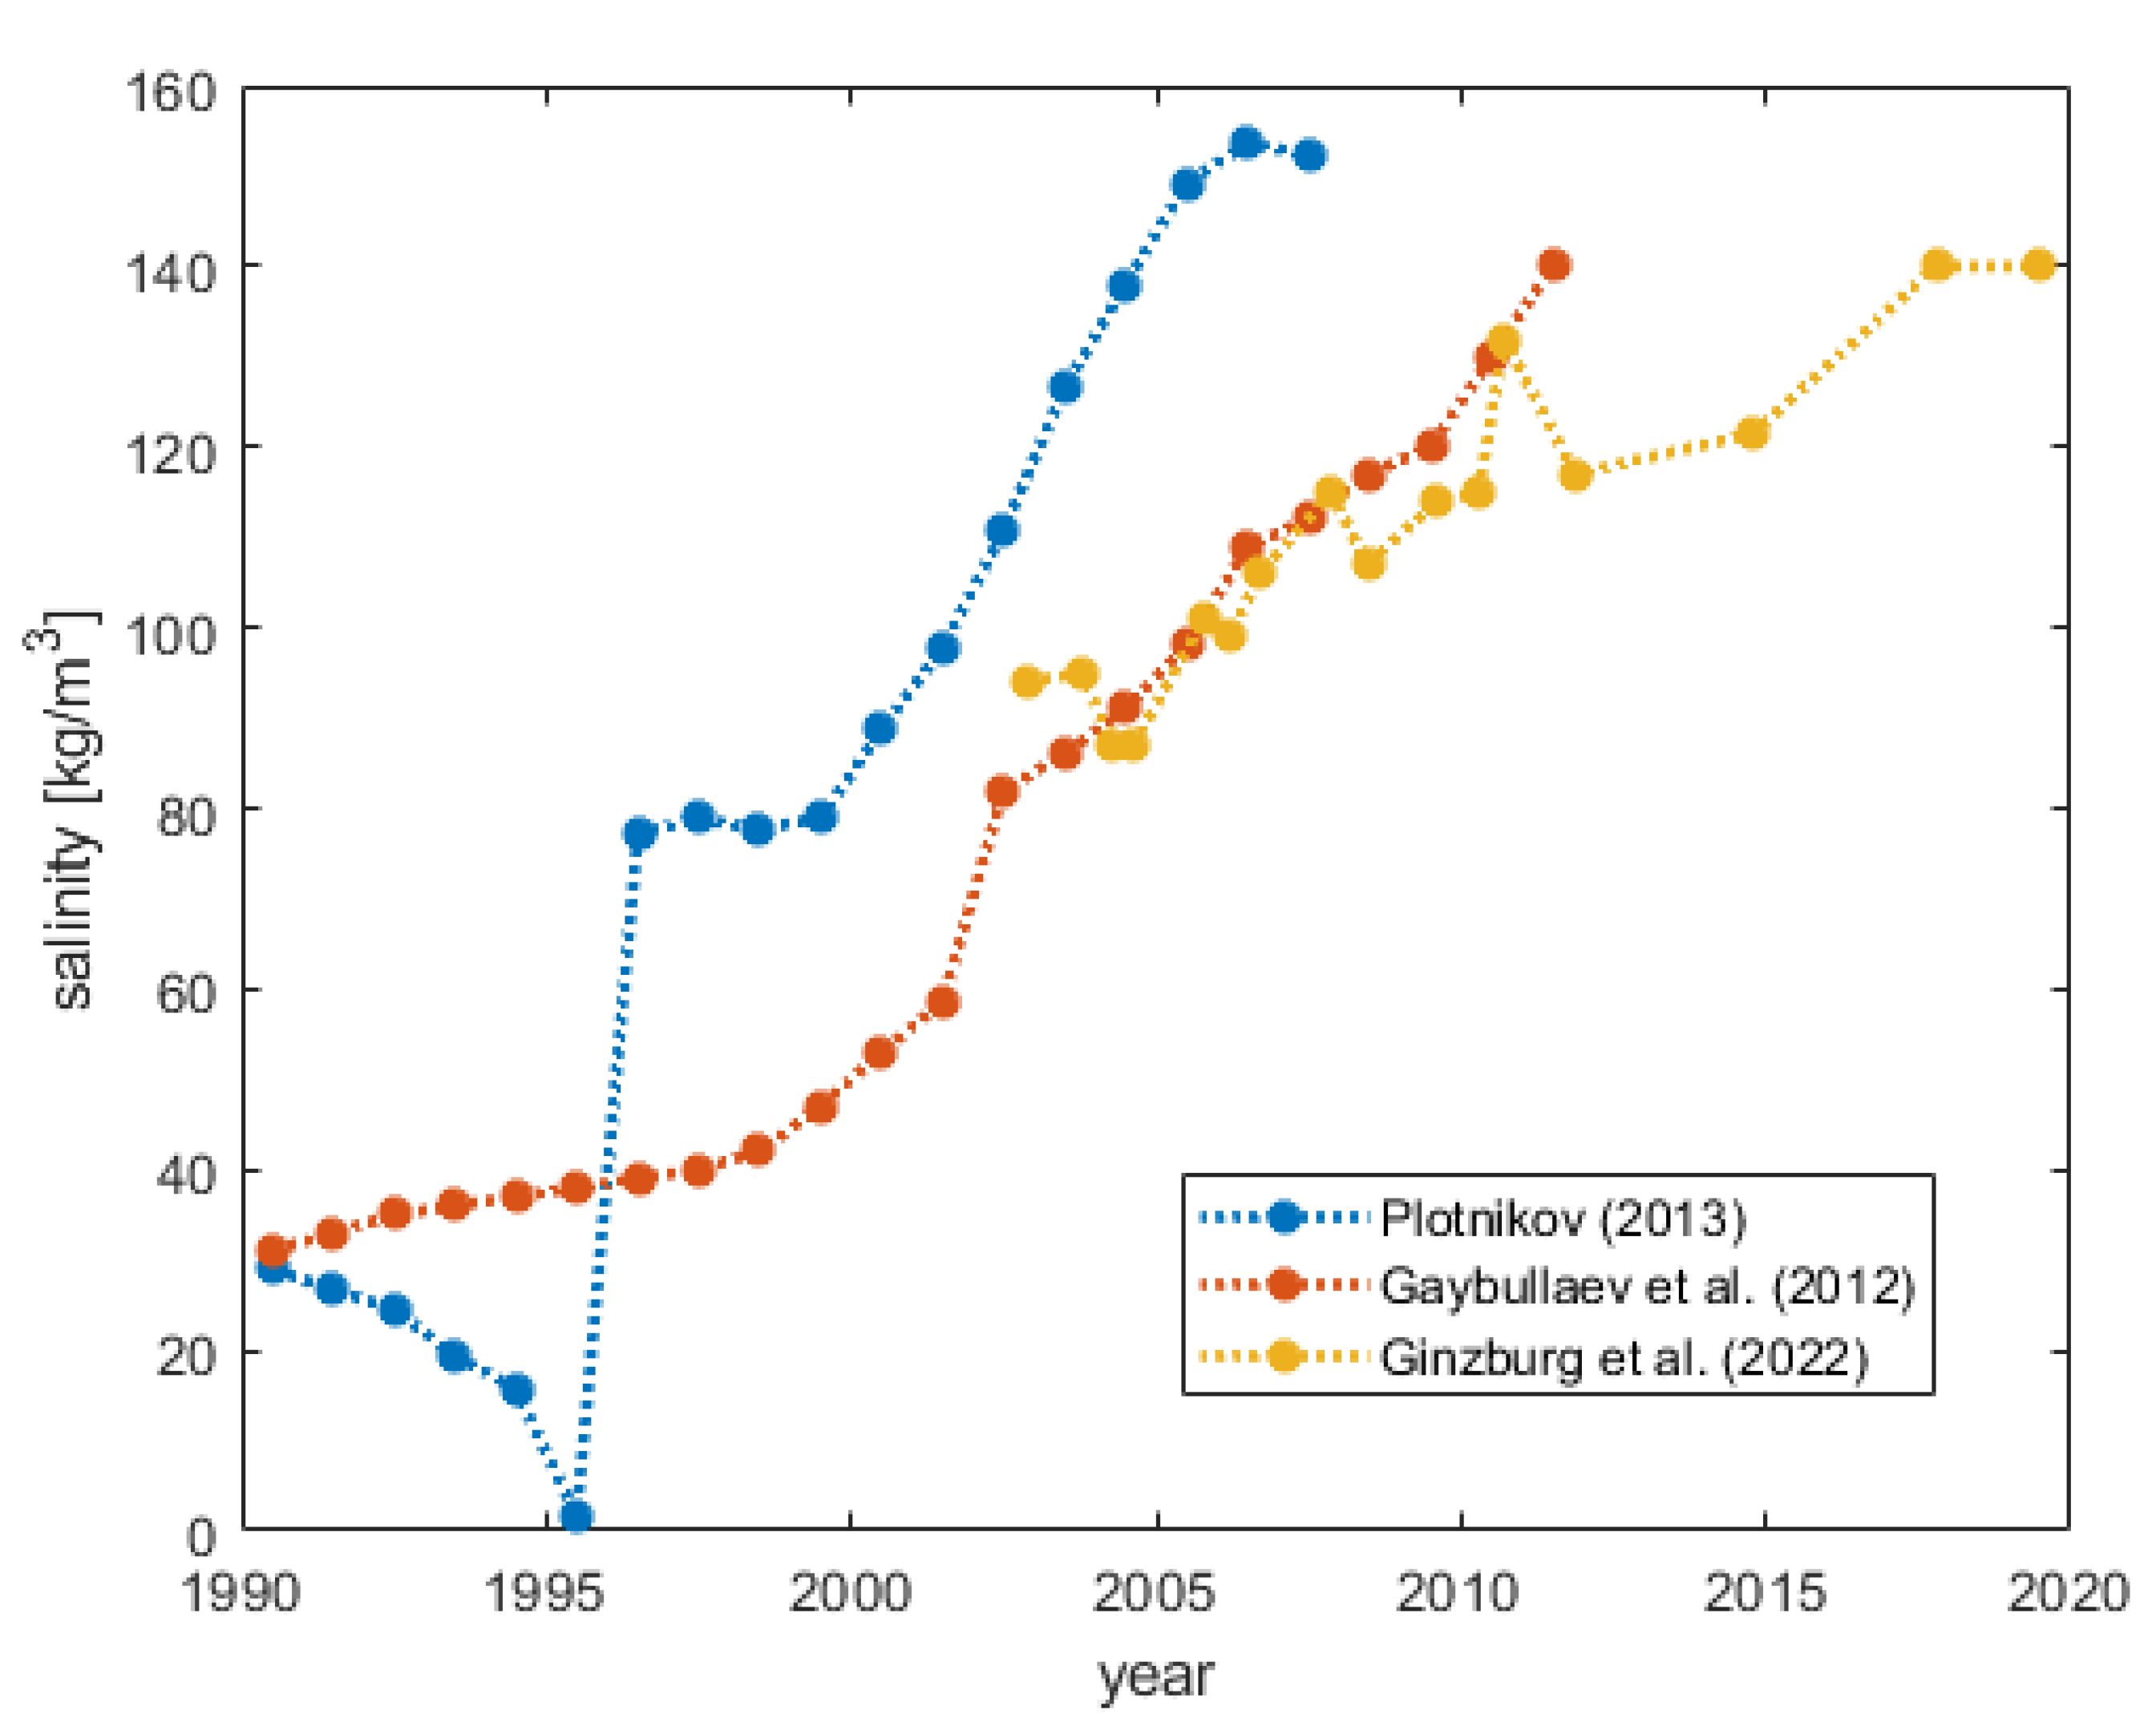
An attempt at modeling salinity was made based on available information. Note that salinity is not observed and published regularly; therefore, only inconsistent data are available, with significant gaps between epochs. Three different time series of salinity observations, presented by Plotnikov [46], Gaybullaev et al. [47], and Ginzburg et al. [48], have been utilized for the present study.
The source of the salinity values of Plotnikov [46] in Figure 3 is unclear; however, it provides estimates for the interval between 1960 and 2007, as well as for 1990 separately for the different basins of the Aral Sea. The water volume of the separated basins has been totaled to represent the Aral Sea as a single water body.
From 1957 to 2012, Gaybullaev et al. [47] used hydrological data of different kinds (runoff, evaporation, water volume, precipitation, and salinity) based on a vast number of sources, summarized in their Table 1. As for the actual source of the salinity data, it could not be traced.
A comprehensive collection of available data for the period of 2002–2021 on morphometric parameters and salinity for the western basin of the Large Aral Sea has been provided by Ginzburg et al. [48]. The time series consists of 16 epochs of salinity data based on data sources described in [41,42,49,50,51,52,53,54,55,56,57].
These models are shown in Figure 7, neglecting the historical data up to 1990. From 1990 to 1996, the time series of Plotnikov [46] differs relevantly from Gaybullaev et al. [47]; after that, both sources show a gradual increase from 1996 to 2005, with a bias of approximately 30–40 kg/m3 between them. The results of Ginzburg et al. [48] tend to be more consistent with those of Gaybullaev et al. [47]; nonetheless, considerable deviations can be observed at certain epochs, indicating that salinity data depend on the method and the place of the observations, and that they, consequently, cannot be considered reliable.
The average water temperature in the Aral Sea varies approximately between 4 °C and 26 °C, although relevant differences can be observed locally. In certain places, it can exceed even 45°C [1]. Before the desiccation process of the Aral Sea took place, its water was quite homogeneous [58], except near the estuaries of the Amu Darya and Syr Darya rivers. Currently, considerable differences in density and salinity, as well as the stratification of different density layers, can be observed in the various basins of the Aral Sea [42]. The strong stratification of salinity hinders the mixing of the different layers; therefore, exchange processes with the atmosphere and the surface affect only the topmost layer of the water. Accordingly, even excessive solar heat in the summer only warms up the surface layer and does not penetrate the deeper waters, leading to a very diverse temperature distribution [42]. As a result, the temperature of the Aral Sea has not been modeled. Instead, three scenarios were run, considering temperatures of 10 °C, 20 °C, and 30 °C with homogeneous distribution.
4. Results
In Földváry et al. [33], the gravity anomaly time series was determined for the period from April 2002 to November 2019. The present study has extended this range until January 2022. The correlation coefficient with the water volume variations for the shorter period resulted in 0.8636; moreover, for the extended period, it became 0.8988. Therefore, the longer time series yielded a more emphasized relationship.
Further development was the modeling of the impact of the mass variations of the Caspian Sea for the Aral Sea regions (Figure 4). By considering the Caspian Sea, the correlation increased to a value of 0.9013.
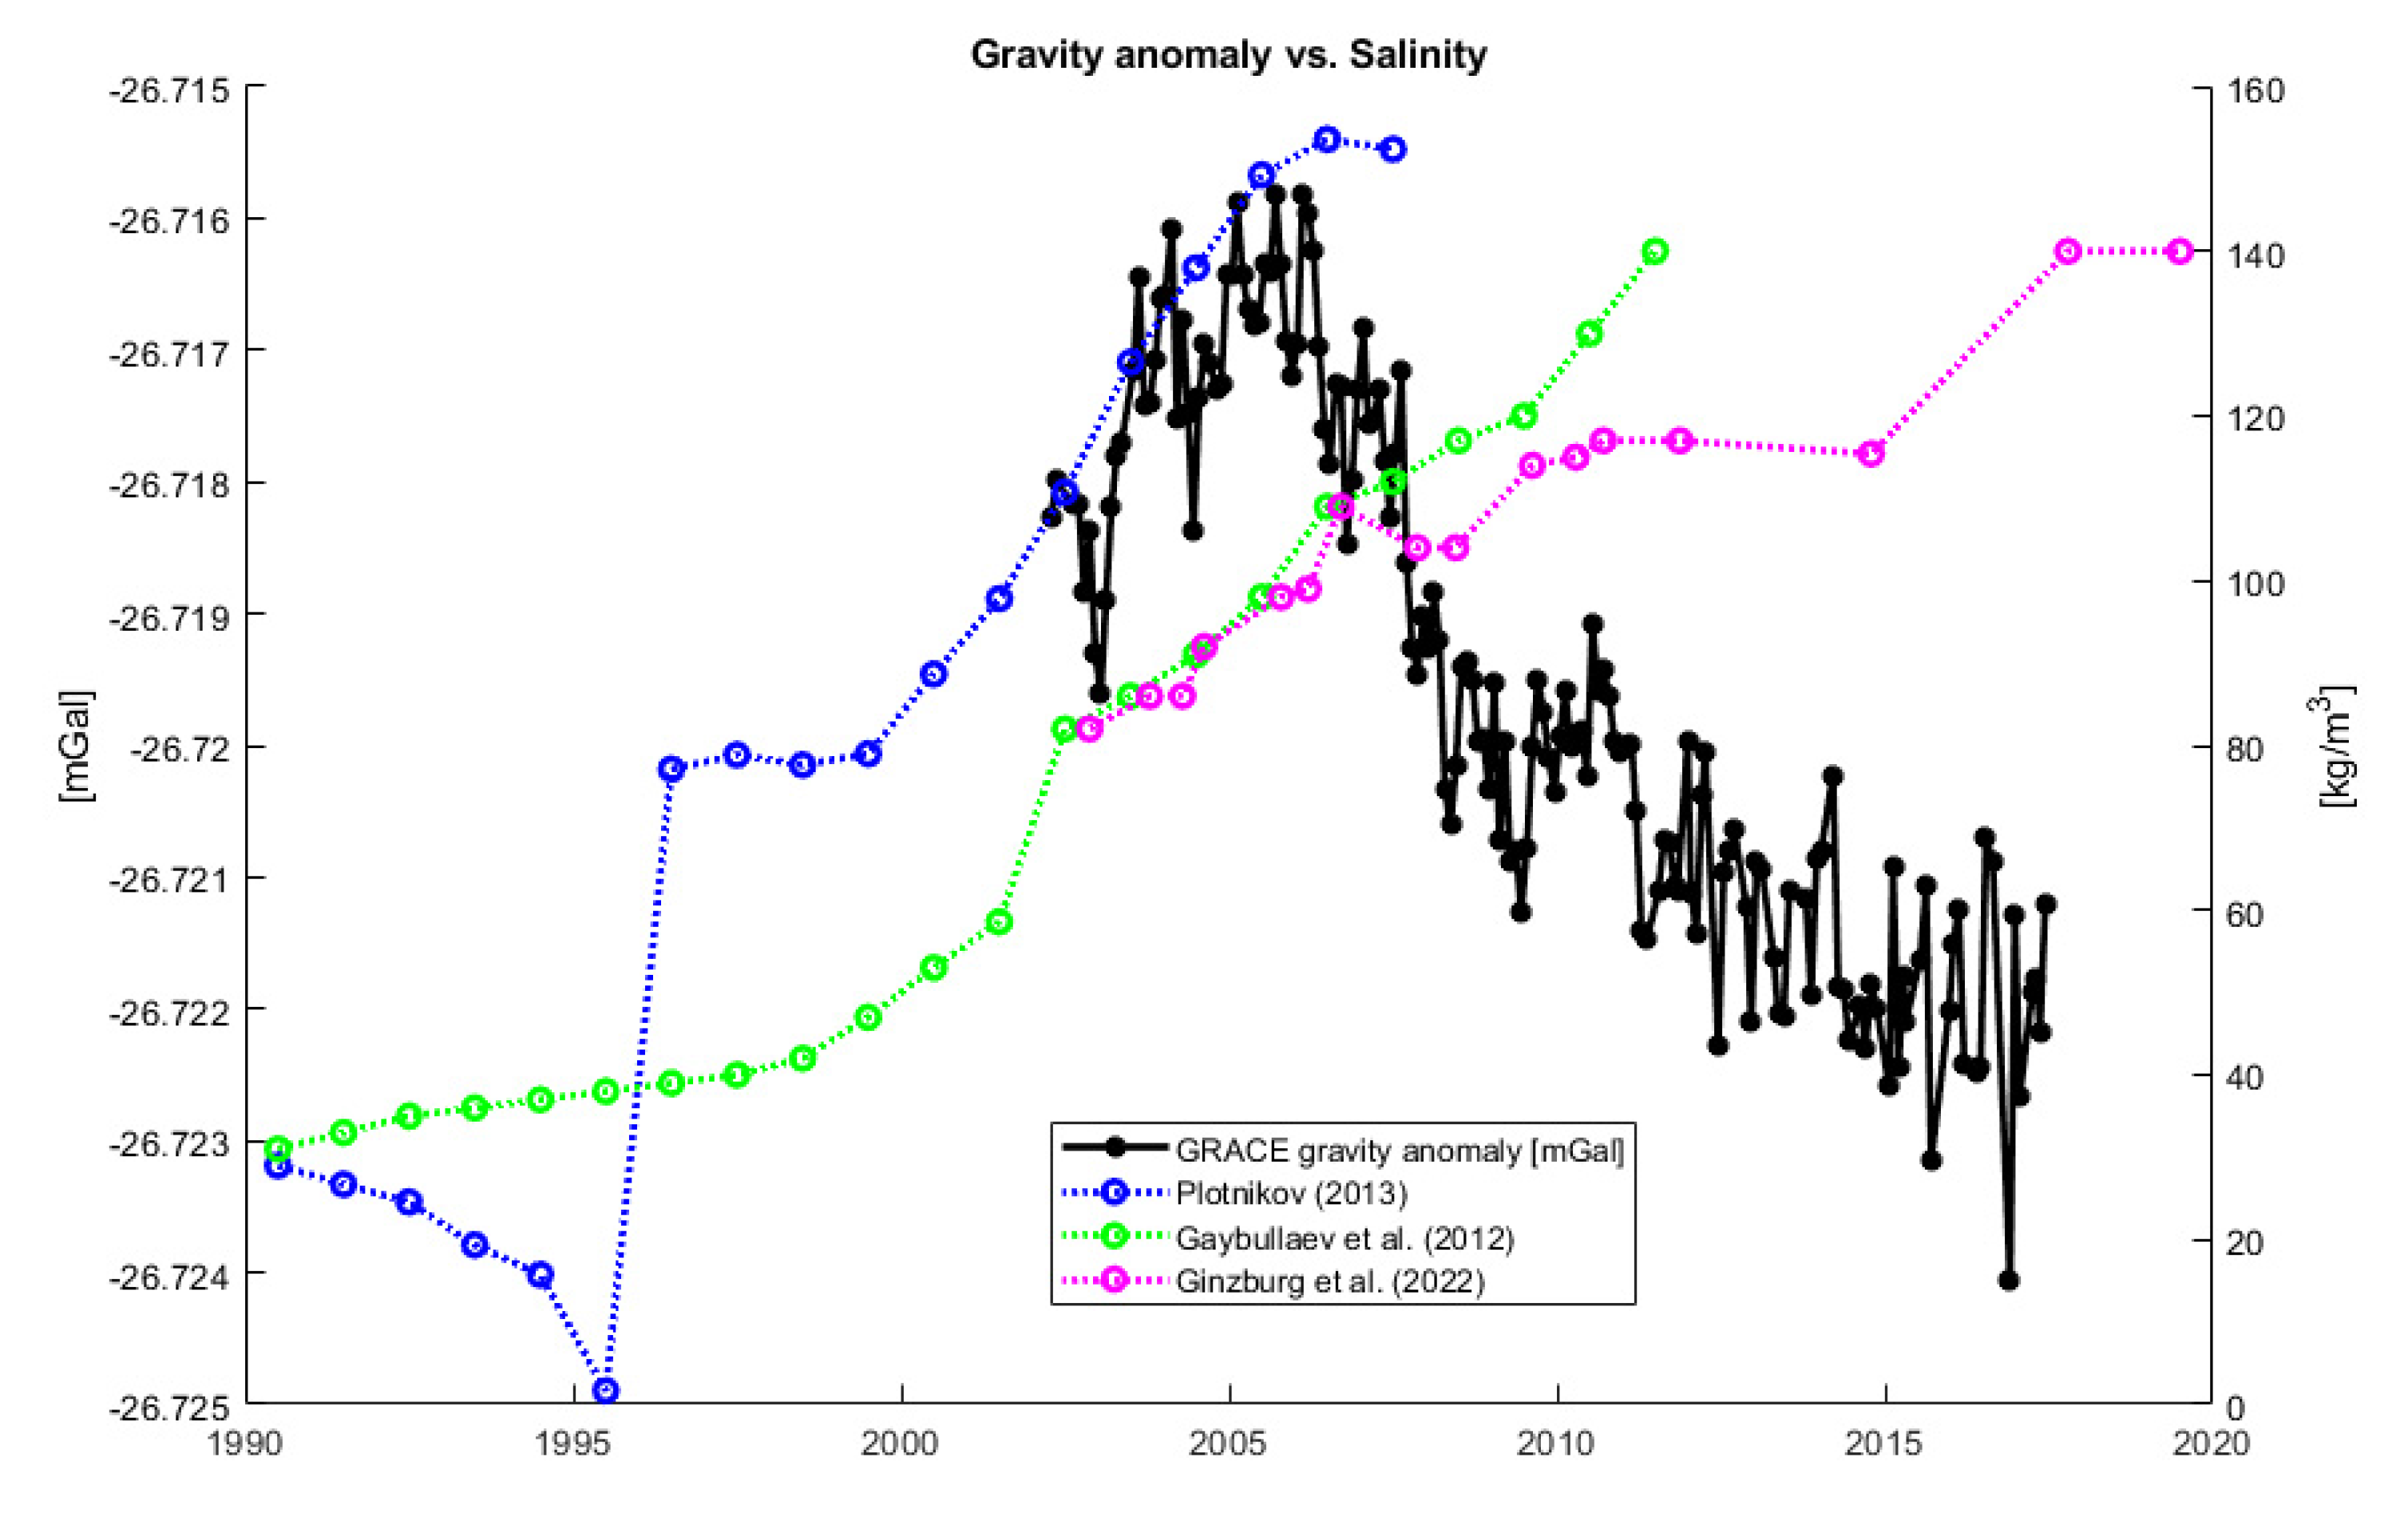
Further comparisons have been made between gravity anomaly and salinity/density/water mass change, respectively. The gravity anomaly time series spans from 2002 to 2022, and salinity data are available between 1960 and 2007 [46], 1957 and 2012 [47], and 2002 and 2021 [48]. As can be seen, the overlapping period covers only a few years. Figure 8 shows some parts of the mentioned data, including the overlapping period. According to Equation (1), the volume change is inversely proportional to density. Therefore, an increase in density may increase the relevance of smaller changes in the water volume. Figure 8 shows that the salinity increases between 2002 and 2005 in all three models, which suggests an increasing density and, consequently, an increase in the water mass change, which may account for some parts of the increase in the gravity anomaly observed by GRACE.
By using the formulation of Millero and Huang [43], density was estimated for both salinity models, considering temperature values of 10 °C, 20 °C, and 30 °C, as no reliable information on water temperature and distribution is available. Although the method of Millero and Huang [43] is well recognized, given that it is validated for salinity values of 5 to 70 kg/m3, for the 2002–2005 period, when salinity varies between approximately 80 and 150 kg/m3, it might result in incorrect estimates.
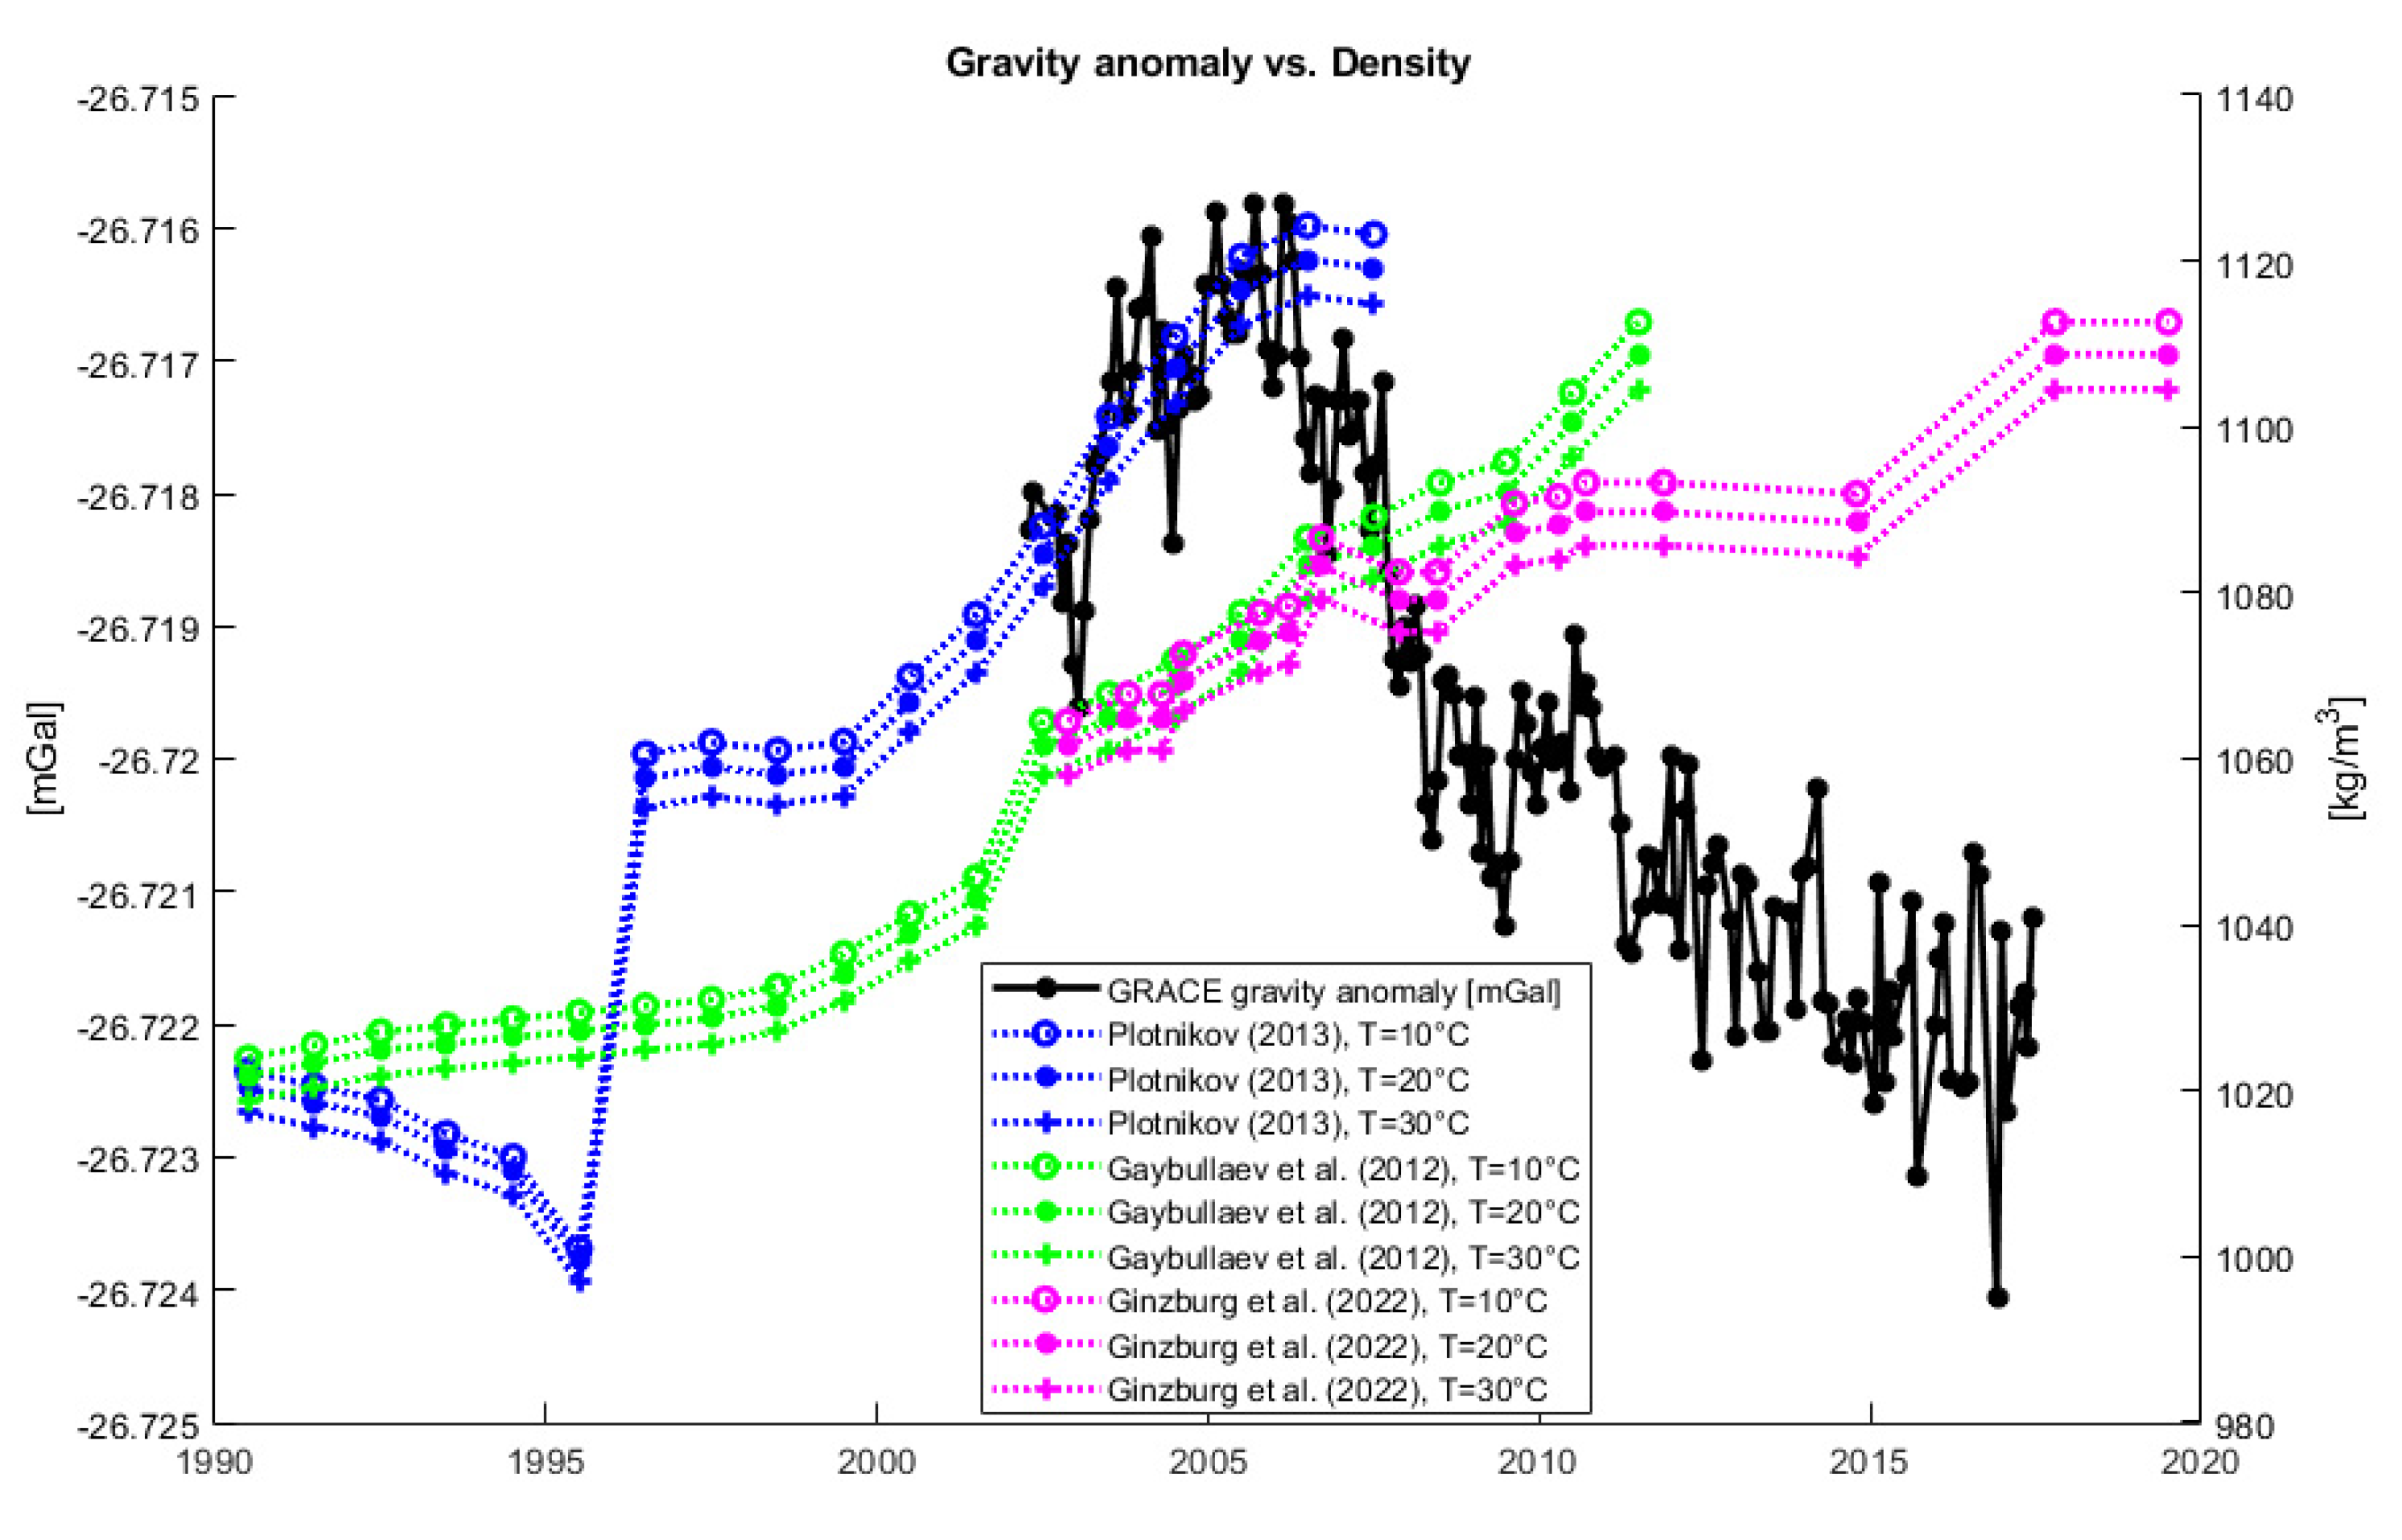
According to Figure 9, the characteristics of the density variations adhered to the salinity variations when the temperature (due to a lack of information) was considered to be constant in time. Different constant values for the temperature result in a bias of the density curve inversely. Therefore, a higher temperature provides a lower density estimate. In conclusion, if no reliable information on the temporal variations of the water temperature is available, variations of the density are linearly proportional to that of the salinity.
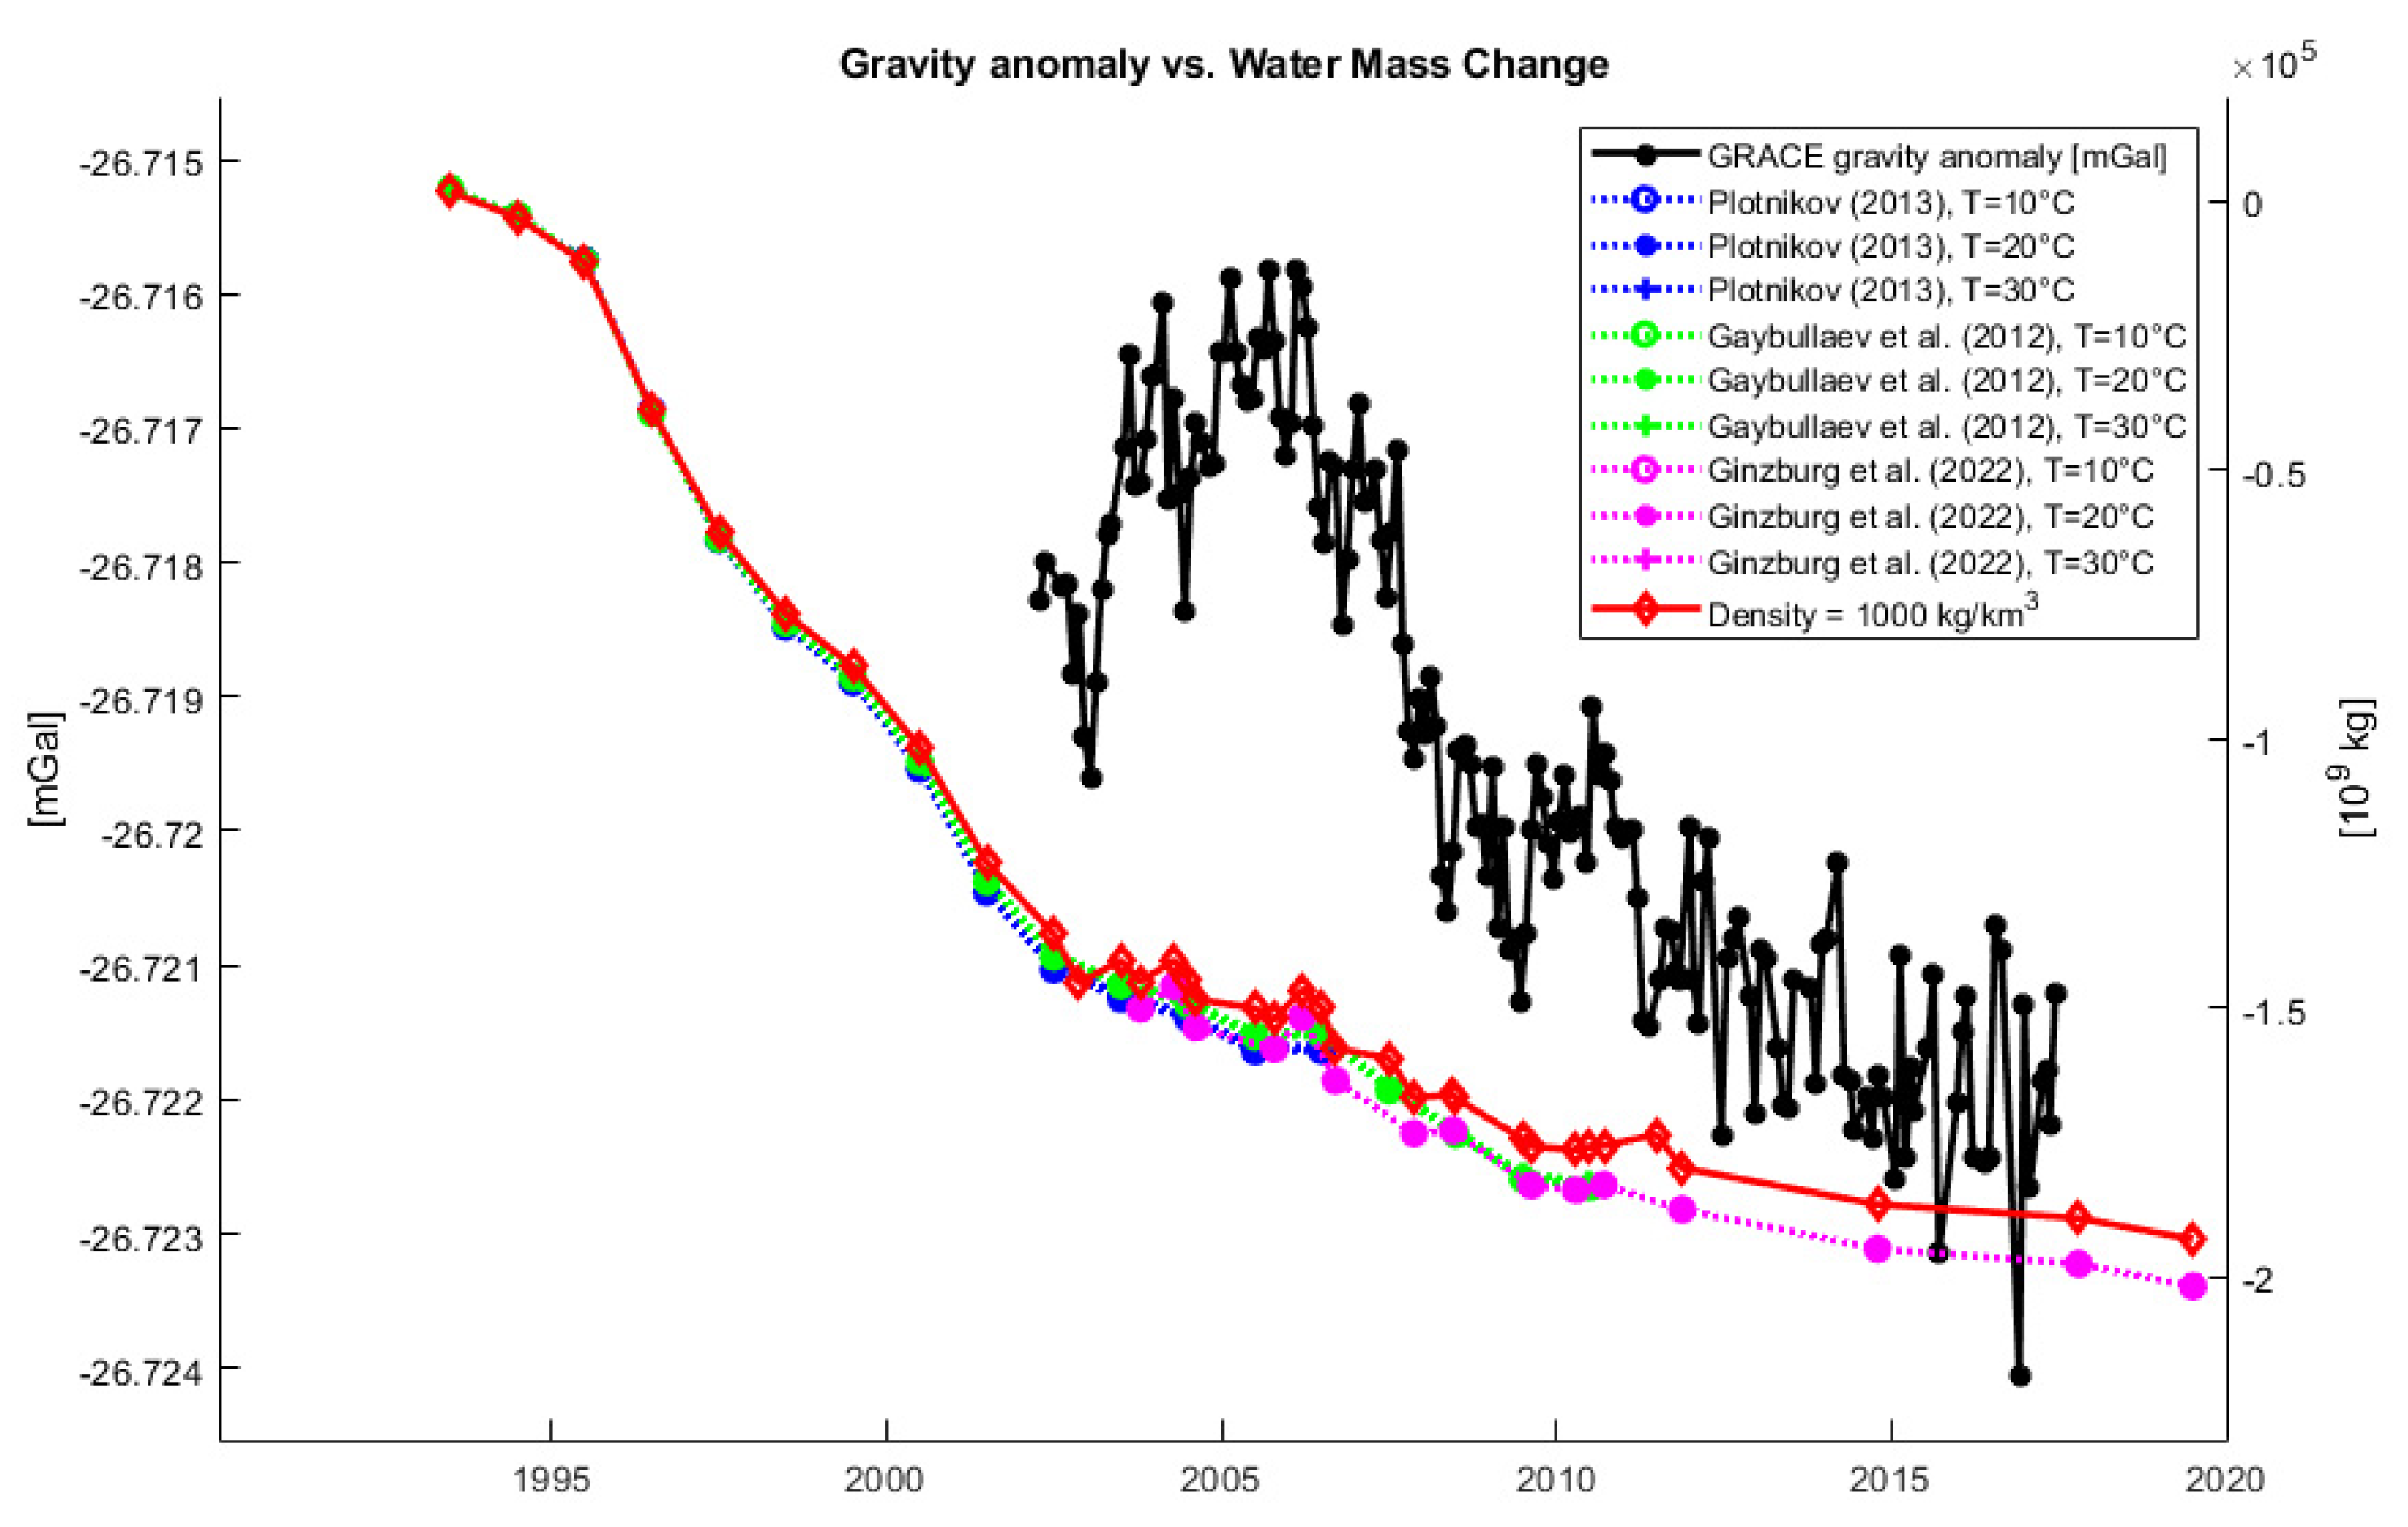
Subsequently, the water mass change was determined using Equation (1) and is displayed in Figure 10. No relevant difference due to the various constant temperatures was observed. However, because of the change in the density, a change in the steepness of the water mass change curves can be detected. As a reference, the water mass change curve with a constant density (1000 kg/m3) is included in Figure 10, which is equivalent to the water volume change (rescaled by a constant density).
The correlation between water volume change and gravity anomaly was found to be high in [33], yielding a correlation coefficient of 0.8636 for the whole period of the GRACE and GRACE-FO time series. This has been improved by extending the GRACE-FO and the water volume time series to January 2022 and therefore to 0.9013. However, the comparison between water mass change and gravity anomaly may rely on a rather sparse sampling, resulting in only 6 data pairs in the case of Plotnikov [46], 10 data pairs in the case of [47], and 16 data pairs in the case of [48] being included in the comparison. In the case of Plotnikov [46], no meaningful correlation values could be obtained, whereas, for the model of Gaybullaev et al. [47], with 10 data pairs, and Ginzburg et al. [48], with 16 data pairs, the correlation coefficients could be determined (Table 1).
The correlation coefficients in Table 1 indicate some tendencies. The similarity of the gravity anomaly and water volume time series was achieved by considering the whole time series and resulted in a correlation of 0.9013; however, when it was determined to those 10 and 16 data pairs, where density information was available, the correlation was found to be 0.83109 and 0.89952, respectively. Relative to this value, a slight improvement in the correlation was achieved by considering the salinity changes in the Aral basin, which is relevant for the salinity model of Ginzburg et al. [48]. This indicates that salinity variations have a meaningful impact on the gravity field.
5. Discussion and Conclusions
This study is a continuation and refinement of the work of Földváry et al. [33]. In the present study, the method of determining the gravity anomaly time series from the GRACE and GRACE-FO monthly solutions has been improved by considering the mass variations of the Caspian Sea. Beyond the methodological improvement, the basis of the comparison has been changed from water volume change to mass anomaly. This was achieved by determining density variations due to salinity and temperature changes that could be involved in the analysis. Note that no reliable information either on the salinity or on water temperature changes is available or accessible. Nevertheless, the tests suggest that an improvement in correlation due to such information might occur, although the relevance of the improvement should not be overestimated. All in all, the tests suggest that salinity changes influence the gravity field in a significant way; however, the signal is too weak to inversely obtain information from satellite-borne gravity observations on salinity variations.
One of the main challenges of the research presented is the lack of reliable seawater salinity data and their evolution over time, which are available mainly based on (previous) in situ measurements. Some researchers have analyzed soil samples from the dried seafloor of the South Aral Sea [59], and the distribution of the salinity has also been investigated in this region [60]. However, both the temporal and spatial resolution and the accuracy of the available salinity information are insufficient. This might be improved by using remote sensing images, as soil salinity can be determined rather routinely [61]. Because of the decline of the Aral Sea, the salt of the seawater remains in the soil, resulting in the high salinity of the exposed seabed. Therefore, the spatial distribution of soil salinity in the Aral Sea basin might provide information on the change of water salinity over time, as the soil salinity at a certain time evolves as a function of the water salinity at the same time. According to [61], apart from the delta of Syr Darya and Amu Darya, where the soil salinity was found to be relatively low, the soil salinity content shows an increasing trend from the former to the present coastline in the South Aral Sea, supporting the idea of juxtaposing time information on the change of the coastline with soil salinity to estimate water salinity content in the past.
Author Contributions
Conceptualization, L.F., K.A. and B.A.; methodology, L.F., K.A. and B.A.; software, L.F.; validation, K.A.; investigation, B.A.; writing—original draft preparation, L.F. and K.A.; writing—review and editing, K.A. and B.A.; visualization, L.F. and K.A. All authors have read and agreed to the published version of the manuscript.
Funding
This research received no external funding.
Data Availability Statement
Data sharing not applicable.
Conflicts of Interest
The authors declare no conflict of interest.
References
- Micklin, P.; Aladin, N.V.; Plotnikov, I. The Aral Sea: The Devastation and Partial Rehabilitation of a Great Lake; Springer Earth System Sciences: Berlin/Heidelberg, Germany, 2014; Volume 12, p. 453. [Google Scholar]
- Bettadpur, S. Gravity Recovery and Climate Experiment Level-2 Gravity Field Product User Handbook (Rev 4.0, 25 April 2018); GRACE 327-734 (CSR-GR-03-01); Center for Space Research, The University of Texas at Austin: Austin, TX, USA, 2018; p. 21. [Google Scholar]
- Yuan, D.N.; GRACE Follow-On Level-2 Gravity Field Product User Handbook (Rev 1.1, 2 July 2019). Jet Propulsion Laboratory, JPL D-103922. 2019; p. 20. Available online: https://archive.podaac.earthdata.nasa.gov/podaac-ops-cumulus-docs/gracefo/open/docs/GRACE-FO_L2_UserHandbook.pdf (accessed on 25 February 2023).
- Wahr, J. Time variable gravity from satellites. In Planets and Moons. Treatise on Geophysics, Volume 10; Schubert, G., Ed.; Elsevier: Amsterdam, The Netherlands, 2007; pp. 213–237. [Google Scholar]
- AbouAly, N.; Abdelmohsen, K.; Becker, M.; Mohamed, A.-M.S.; Abotalib, A.Z.; Saleh, M.; Zahran, K.H. Evaluation of annual and semiannual total mass variation over the Mediterranean Sea from satellite data. Arab. J. Geosci. 2021, 14, 1–13. [Google Scholar] [CrossRef]
- Othman, A.; Abdelmohsen, K. A Geophysical and Remote Sensing-Based Approach for Monitoring Land Subsidence in Saudi Arabia. In Applications of Space Techniques on the Natural Hazards in the MENA Region; Springer: Cham, Switzerland, 2022; pp. 477–494. [Google Scholar]
- Othman, A.; Sultan, M.; Becker, R.; Alsefry, S.; Alharbi, T.; Gebremichael, E.; Alharbi, H.; Abdelmohsen, K. Use of Geophysical and Remote Sensing Data for Assessment of Aquifer Depletion and Related Land Deformation. Surv. Geophys. 2018, 39, 543–566. [Google Scholar] [CrossRef] [PubMed]
- Sultan, M.; Sturchio, N.C.; Alsefry, S.; Emil, M.K.; Ahmed, M.; Abdelmohsen, K.; AbuAbdullah, M.M.; Yan, E.; Save, H.; Alharbi, T.; et al. Assessment of age, origin, and sustainability of fossil aquifers: A geochemical and remote sensing–based approach. J. Hydrol. 2019, 576, 325–341. [Google Scholar] [CrossRef]
- Barbosa, S.A.; Pulla, S.T.; Williams, G.P.; Jones, N.L.; Mamane, B.; Sanchez, J.L. Evaluating Groundwater Storage Change and Recharge Using GRACE Data: A Case Study of Aquifers in Niger, West Africa. Remote Sens. 2022, 14, 1532. [Google Scholar] [CrossRef]
- Sahour, H.; Sultan, M.; Abdellatif, B.; Emil, M.; Abotalib, A.Z.; Abdelmohsen, K.; Vazifedan, M.; Mohammad, A.T.; Hassan, S.M.; Metwalli, M.R.; et al. Identification of shallow groundwater in arid lands using multi-sensor remote sensing data and machine learning algorithms. J. Hydrol. 2022, 614, 128509. [Google Scholar] [CrossRef]
- Cui, L.; Song, Z.; Luo, Z.; Zhong, B.; Wang, X.; Zou, Z. Comparison of Terrestrial Water Storage Changes Derived from GRACE/GRACE-FO and Swarm: A Case Study in the Amazon River Basin. Water 2020, 12, 3128. [Google Scholar] [CrossRef]
- Tian, K.; Wang, Z.; Li, F.; Gao, Y.; Xiao, Y.; Liu, C. Drought Events over the Amazon River Basin (1993–2019) as Detected by the Climate-Driven Total Water Storage Change. Remote Sens. 2021, 13, 1124. [Google Scholar] [CrossRef]
- Cui, L.; Yin, M.; Huang, Z.; Yao, C.; Wang, X.; Lin, X. The Drought Events over the Amazon River Basin from 2003 to 2020 Detected by GRACE/GRACE-FO and Swarm Satellites. Remote Sens. 2022, 14, 2887. [Google Scholar] [CrossRef]
- Kiss, A.; Földváry, L. Seasonal hydrologic variations in the La Plata basin from GRACE gravity field models. Acta Geodyn. Geomater. 2017, 14, 145–152. [Google Scholar]
- Kiss, A.; Földváry, L. Multi-annual mass variations from GRACE monthly solution—Preliminary results. Acta Geodyn. Geomater. 2018, 15, 165–172. [Google Scholar] [CrossRef]
- Abdelmalik, K.W.; Abdelmohsen, K. GRACE and TRMM mission: The role of remote sensing techniques for monitoring spatio-temporal change in total water mass, Nile basin. J. Afr. Earth Sci. 2019, 160, 103596. [Google Scholar] [CrossRef]
- Abdelmohsen, K.; Sultan, M.; Ahmed, M.; Save, H.; Elkaliouby, B.; Emil, M.; Yan, E.; Abotalib, A.Z.; Krishnamurthy, R.V.; Abdelmalik, K. Response of deep aquifers to climate variability. Sci. Total Environ. 2019, 677, 530–544. [Google Scholar] [CrossRef] [PubMed]
- Abdelmohsen, K.; Sultan, M.; Save, H.; Abotalib, A.Z.; Yan, E. What can the GRACE seasonal cycle tell us about lake-aquifer interactions? Earth Sci. Rev. 2020, 211, 103392. [Google Scholar] [CrossRef]
- Ahmed, M.; Abdelmohsen, K. Quantifying modern recharge and depletion rates of the Nubian Aquifer in Egypt. Surv. Geophys. 2018, 39, 729–751. [Google Scholar] [CrossRef]
- Sahour, H.; Sultan, M.; Vazifedan, M.; Abdelmohsen, K.; Karki, S.; Yellich, J.A.; Gebremichael, E.; Alshehri, F.; Elbayoumi, T.M. Statistical Applications to Downscale GRACE-Derived Terrestrial Water Storage Data and to Fill Temporal Gaps. Remote Sens. 2020, 12, 533. [Google Scholar] [CrossRef]
- Elsaka, B.; Abdelmohsen, K.; Alshehri, F.; Zaki, A.; El-Ashquer, M. Mass Variations in Terrestrial Water Storage over the Nile River Basin and Mega Aquifer System as Deduced from GRACE-FO Level-2 Products and Precipitation Patterns from GPCP Data. Water 2022, 14, 3920. [Google Scholar] [CrossRef]
- Földváry, L. Mass-Change Acceleration in Antarctica from GRACE Monthly Gravity Field Solutions. In Geodesy for Planet Earth, Proceedings of IAG Symposium in Buenos Aires, IAG Symposia, Volume 131; Springer: Berlin/Heidelberg, Germany, 2012; pp. 591–597. [Google Scholar]
- Földváry, L.; Kiss, A.; Su, Z.X.; Wang, G.C.; Wang, L. Accuracy investigations of GRACE-borne ice mass variations in Antarctica. Earth Sci. Front. 2015, 22, 239–246. [Google Scholar]
- Kiss, A.; Földváry, L. Uncertainty of GRACE-borne long periodic and secular ice mass variations in Antarctica. Acta Geod. Geophys. 2017, 52, 497–510. [Google Scholar] [CrossRef]
- Church, J.; White, N.J.; Konikow, L.F.; Domingues, C.M.; Cogley, J.G.; Rignot, E.; Gregory, J.; van den Broeke, M.; Monaghan, A.; Velicogna, I. Revisiting the Earth’s sea-level and energy budgets from 1961 to 2008. Geophys. Res. Lett. 2011, 38, L18601. [Google Scholar] [CrossRef]
- Tamisiea, M.E.; Hill, W.M.; Ponte, R.M.; Davis, J.L.; Velicogna, I. Impact of self- attraction and loading on the annual cycle in sea level. J. Geophys. Res. 2010, 115, C07004. [Google Scholar] [CrossRef]
- Wang, Q.; Zheng, W.; Yin, W.; Kang, G.; Huang, Q.; Shen, Y. Improving the Resolution of GRACE/InSAR Groundwater Storage Estimations Using a New Subsidence Feature Weighted Combination Scheme. Water 2023, 15, 1017. [Google Scholar] [CrossRef]
- Zhong, D.; Wang, S.; Li, J. Spatiotemporal Downscaling of GRACE Total Water Storage Using Land Surface Model Outputs. Remote Sens. 2021, 13, 900. [Google Scholar] [CrossRef]
- Kumar, K.S.; Sridhar, V.; Varaprasad, B.J.S.; Chinnapa Reddy, K. Bridging the Data Gap between the GRACE Missions and Assessment of Groundwater Storage Variations for Telangana State, India. Water 2022, 14, 3852. [Google Scholar] [CrossRef]
- Fatolazadeh, F.; Eshagh, M.; Goïta, K.; Wang, S. A New Spatiotemporal Estimator to Downscale GRACE Gravity Models for Terrestrial and Groundwater Storage Variations Estimation. Remote Sens. 2022, 14, 5991. [Google Scholar] [CrossRef]
- Gemitzi, A.; Koutsias, N.; Lakshmi, V. A Spatial Downscaling Methodology for GRACE Total Water Storage Anomalies Using GPM IMERG Precipitation Estimates. Remote Sens. 2021, 13, 5149. [Google Scholar] [CrossRef]
- Abdelmohsen, K.; Sultan, M.; Save, H.; Abotalib, A.Z.; Yan, E.; Zahran, K.H. Buffering the impacts of extreme climate variability in the highly engineered Tigris Euphrates river system. Sci. Rep. 2022, 12, 1–13. [Google Scholar]
- Földváry, L.; Statov, V.; Mamutov, N. Applicability of GRACE and GRACE-FO for monitoring water mass changes of the Aral Sea and the Caspian Sea. In InterCarto. InterGIS. GI Support of Sustainable Development of Territories: Proceedings of the International Conference; Moscow University Press: Moscow, Russia, 2020; Volume 26, pp. 443–453. [Google Scholar]
- Cretaux, J.-F.; Letolle, R.; Bergé-Nguyen, M. History of Aral Sea level variability and current scientific debates. Glob. Planet. Change 2013, 110, 99–113. [Google Scholar] [CrossRef]
- Létolle, R.; Mainguet, M. Histoire de la mer d’Aral (Asie Centrale) depuis le dernier maximum glaciaire. Bull. Soc. Geol. Fr. 1997, 168, 387–398. [Google Scholar]
- Sorrel, P.; Popescu, S.-M.; Head, M.J.; Suc, J.-P.; Klotz, S.; Oberhänsl, H. Hydrographic development of the Aral Sea during the last 2000 years based on a quantitative analysis of dinoflagellate cysts. Palaeogeogr. Palaeoclimatol. Palaeoecol. 2006, 234, 304–327. [Google Scholar] [CrossRef]
- Boomer, I.; Wünnermann, B.; Mackay, A.W.; Austin, P.; Sorrel, P.; Reinhardt, C.; Kayser, D.; Guichard, F.; Fontugne, M. Advances in understanding the late Holocene history of the Aral Sea region. Quat. Int. 2009, 194, 79–90. [Google Scholar] [CrossRef]
- Turdimambetov, I.; Madreymov, A.; Földváry, L.; Oteuliev, M.; Kurbanov, M.; Utarbaeva, K.; Bekanov, K. Influence of Adverse Ecological Factors on the Incidence of Malignant Neoplasms. E3S Web Conf. 2021, 227, 02001. [Google Scholar] [CrossRef]
- Swenson, S.; Wahr, J. Post-processing removal of correlated errors in GRACE data. Geophys. Res. Lett. 2006, 33, L08402. [Google Scholar] [CrossRef]
- Holstein, H. Gravimagnetic anomaly formulas for polyhedra of spatially linear media. Geophysics 2003, 68, 157–167. [Google Scholar] [CrossRef]
- Izhitskiy, A.S.; Zavialov, P.O.; Sapozhnikov, P.V.; Kirillin, G.B.; Grossart, H.P.; Kalinina, O.Y.; Zalota, A.K.; Goncharenko, I.V.; Kurbaniyazov, A.K. Present state of the Aral Sea: Diverging physical and biological characteristics of the residual basins. Sci. Rep. 2016, 6, 23906. [Google Scholar] [CrossRef] [PubMed]
- Zavialov, P.O.; Kostianoy, A.G.; Emelianov, S.V.; Ni, A.A.; Ishniyazov, D.; Khan, V.M.; Kudyshkin, T.V. Hydrographic survey in the dying Aral Sea. Geophys. Res. Lett. 2003, 30, 1659. [Google Scholar] [CrossRef]
- Millero, F.J.; Huang, F. The density of seawater as a function of salinity (5 to 70 g kg−1) and temperature (273.15 to 363.15 K). Ocean. Sci. 2009, 5, 91–100. [Google Scholar] [CrossRef]
- Millero, F.J.; Poisson, A. International one-atmosphere equation of state of seawater. Deep. Sea Res. Part A Oceanogr. Res. Pap. 1981, 28, 625–629. [Google Scholar] [CrossRef]
- Cretaux, J.F.; Jelinski, W.; Calmant, S.; Kouraev, A.; Vuglinski, V.; Bergé-Nguyen, M.; Gennero, M.C.; Nino, F.; Abarca Del Rio, R.; Cazenave, A.; et al. SOLS: A lake database to monitor in the near real time water level and storage variations from remote sensing data. Adv. Space Res. 2011, 47, 1497–1507. [Google Scholar] [CrossRef]
- Plotnikov, I. Changes in the Species Composition of the Aral Sea Free-Living Invertebrates (Metazoa) Fauna. Proc. Zool. Inst. Russ. Acad. Sci. 2013, 3, 41–54. [Google Scholar]
- Gaybullaev, B.; Chen, S.C.; Gaybullaev, D. Changes in water volume of the Aral Sea after 1960. Appl. Water Sci. 2012, 2, 285–291. [Google Scholar] [CrossRef]
- Ginzburg, A.I.; Kostianoy, A.G.; Sheremet, N.A.; Izhitskiy, A.S.; Soloviev, D.M. The drying dynamics of the Western Large Aral Sea from satellite data (2002–2021). Sovrem. Probl. Distantsionnogo Zondirovaniya Zemli Iz Kosm. 2022, 19, 246–263. (In Russian) [Google Scholar] [CrossRef]
- Andrulionis, N.Y.; Zavialov, P.O. Laboratory studies of the main component composition of hypergaline lakes. Mar. Hydrophys. J. 2019, 35, 16–36. (In Russian) [Google Scholar]
- Andrulionis, N.Y.; Zavialov, P.O.; Izhitsky, A.S. Modern evolution of salt composition of waters in the western basin of the Large Aral Sea. Okeanologiya 2021, 61, 925–935. (In Russian) [Google Scholar]
- Izhitskiy, A.S.; Zavialov, P.O.; Roget, E.; Huang, H.-P.; Kurbaniyazov, A.K. On thermohaline structure and circulation of the Western Large Aral Sea from 2009 to 2011: Observations and modeling. J. Mar. Syst. 2014, 129, 234–247. [Google Scholar] [CrossRef]
- Zavialov, P.O.; Ginzburg, A.I.; Sapozhnikov, F.V.; Abdullaev, U.R.; Ambrosimov, A.K.; Andreev, N.I.; Validjanov, R.; Ishniyazov, D.P.; Koldaev, A.A.; Kudyshkin, T.V.; et al. Complex expeditionary research in the western part of the Aral Sea in October 2003. Okeanologiya 2004, 44, 632–635. (In Russian) [Google Scholar]
- Zavialov, P.O.; Arashkevich, A.G.; Grabovsky, A.B.; Dikarev, S.N.; Jalilov, G.; Evdokimov, Y.V.; Kudyshkin, T.V.; Kurbaniyazov, A.K.; Kurbaniyazov, S.K.; Matchanov, A.T.; et al. Expeditionary research in the western and eastern basins of the Aral Sea (October 2005). Oceanology 2006, 46, 946–950. (In Russian) [Google Scholar] [CrossRef]
- Zavialov, P.O.; Andrulionis, E.E.; Arashkevich, E.G.; Grabovsky, A.B.; Dikarev, S.N.; Kudyshkin, T.V.; Kurbaniyazov, A.K.; Ni, A.A.; Sapozhnikov, F.V. Expeditionary research in the western Aral Sea basin in September 2006. Okeanologiya 2008, 48, 648–654. (In Russian) [Google Scholar]
- Zavialov, P.O.; Ni, A.A.; Ishniyamazov, D.P.; Kudyshkin, T.V.; Kurbaniyazov, A.K.; Mukhamedzhanova, D. Ongoing changes in salt composition and dissolved gases in the Aral Sea. Aquat. Geochem. 2008, 15, 263–275. [Google Scholar] [CrossRef]
- Zavialov, P.O.; Ni, A.A.; Kudyshkin, T.V.; Kurbaniyazov, A.K.; Dikarev, S.N. Five years of field hydrographic research in the Large Aral Sea (2002–2006). J. Mar. Syst. 2009, 76, 263–271. [Google Scholar] [CrossRef]
- Zavialov, P.O.; Arashkevich, E.G.; Bastida, I.; Ginzburg, A.I.; Dikaryov, S.N.; Zhitina, L.S.; Izhitsky, A.S.; Ishniyazov, D.P.; Kostyanoy, A.G.; Kravtsova, V.I.; et al. Big Aral Sea in Early XXI Cent.: Physics, Biology, Chemistry; Science: Moscow, Russia, 2012; p. 227. (In Russian) [Google Scholar]
- Bortnik, V.N.; Chistyaeva, S.P. (Eds.) Hydrometeorology and Hydrochemistry of the USSR Seas, Vol. VII: The Aral Sea; Gidrometeoizdat: Leningrad, Russia, 1990; p. 196. (In Russian) [Google Scholar]
- An, J.; Chang, H.; Han, S.H.; Khamzina, A.; Son, Y. Changes in Basic Soil Properties and Enzyme Activities Along an Afforestation Series on the Dry Aral Sea Bed, Kazakhstan. For. Sci. Technol. 2020, 16, 26–31. [Google Scholar] [CrossRef]
- Kim, J.; Song, C.; Lee, S.; Jo, H.W.; Park, E.; Yu, H.; Cha, S.; An, J.; Son, Y.; Khamzina, A.; et al. Identifying Potential Vegetation Establishment Areas on the Dried Aral Sea Floor Using Satellite Images. Land Degrad. Dev. 2020, 31, 2749–2762. [Google Scholar] [CrossRef]
- Duan, Z.; Wang, X.; Sun, L. Monitoring and Mapping of Soil Salinity on the Exposed Seabed of the Aral Sea, Central Asia. Water 2022, 14, 1438. [Google Scholar] [CrossRef]
Figure 1.
The location map of the Aral Sea and the Caspian Sea.

Figure 2.
The linear trend of the gravity anomaly in the region of the Aral Sea and the Caspian Sea.
Figure 2.
The linear trend of the gravity anomaly in the region of the Aral Sea and the Caspian Sea.

Figure 3.
Simplified model (red box) of the Caspian Sea (blue curve) positioned in the geometrical center (red asterisk) to estimate its remote gravitational effect in the Aral Sea region.
Figure 3.
Simplified model (red box) of the Caspian Sea (blue curve) positioned in the geometrical center (red asterisk) to estimate its remote gravitational effect in the Aral Sea region.

Figure 4.
Gravity anomaly time series at a central point (60.4° N, 44.9° E) of the Aral Sea with the gravitational effect of the Caspian Sea at the same location.
Figure 4.
Gravity anomaly time series at a central point (60.4° N, 44.9° E) of the Aral Sea with the gravitational effect of the Caspian Sea at the same location.

Figure 5.
Gravity anomaly time series with seasonal (annual and semi-annual) component at the central point (60.4° N, 44.9° E) of the Aral Sea removed (black) vs. the original gravity anomaly time series (blue).
Figure 5.
Gravity anomaly time series with seasonal (annual and semi-annual) component at the central point (60.4° N, 44.9° E) of the Aral Sea removed (black) vs. the original gravity anomaly time series (blue).

Figure 6.
Water volume changes in the Aral Sea. Each value is considered to reflect a relative change with respect to the first epoch.
Figure 6.
Water volume changes in the Aral Sea. Each value is considered to reflect a relative change with respect to the first epoch.


Table 1.
Correlation between water mass change and gravity anomaly. The density is determined by using the salinity models obtained from Gaybullaev et al. [47] and Ginzburg et al. [48], with three different constant values for the temperature.
| Model Specification | Gaybullaev et al. [47] 2002–2005 (10 Data Pairs) | Ginzburg et al. [48] 2002–2020 (16 Data Pairs) |
|---|---|---|
| Density: 1000 kg/m3 | 0.83109 | 0.89952 |
| T = 10 °C | 0.83257 | 0.93382 |
| T = 20 °C | 0.83254 | 0.93381 |
| T = 30 °C | 0.83253 | 0.93381 |
Disclaimer/Publisher’s Note: The statements, opinions and data contained in all publications are solely those of the individual author(s) and contributor(s) and not of MDPI and/or the editor(s). MDPI and/or the editor(s) disclaim responsibility for any injury to people or property resulting from any ideas, methods, instructions or products referred to in the content. |
© 2023 by the authors. Licensee MDPI, Basel, Switzerland. This article is an open access article distributed under the terms and conditions of the Creative Commons Attribution (CC BY) license (https://creativecommons.org/licenses/by/4.0/).
Share and Cite
MDPI and ACS Style
Földváry, L.; Abdelmohsen, K.; Ambrus, B. Water Density Variations of the Aral Sea from GRACE and GRACE-FO Monthly Solutions. Water 2023, 15, 1725. https://doi.org/10.3390/w15091725
AMA Style
Földváry L, Abdelmohsen K, Ambrus B. Water Density Variations of the Aral Sea from GRACE and GRACE-FO Monthly Solutions. Water. 2023; 15(9):1725. https://doi.org/10.3390/w15091725
Chicago/Turabian StyleFöldváry, Lóránt, Karem Abdelmohsen, and Bence Ambrus. 2023. "Water Density Variations of the Aral Sea from GRACE and GRACE-FO Monthly Solutions" Water 15, no. 9: 1725. https://doi.org/10.3390/w15091725
Note that from the first issue of 2016, this journal uses article numbers instead of page numbers. See further details here.