
Spinning Submerged Filter Adsorber versus Packed Bed Adsorber for the Continuous Removal of Antibiotics from Wastewater with Activated Carbon


Abstract
: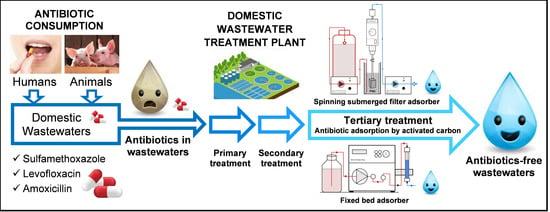
1. Introduction
2. Materials and Methods
2.1. Materials
2.2. Obtention and Physicochemical Properties Determination of Activated Carbons
2.3. Chemical Analyses of Wastewater and Antibiotics
2.4. Adsorption Isotherm Batch Studies
2.5. Adsorption Kinetics Batch Studies
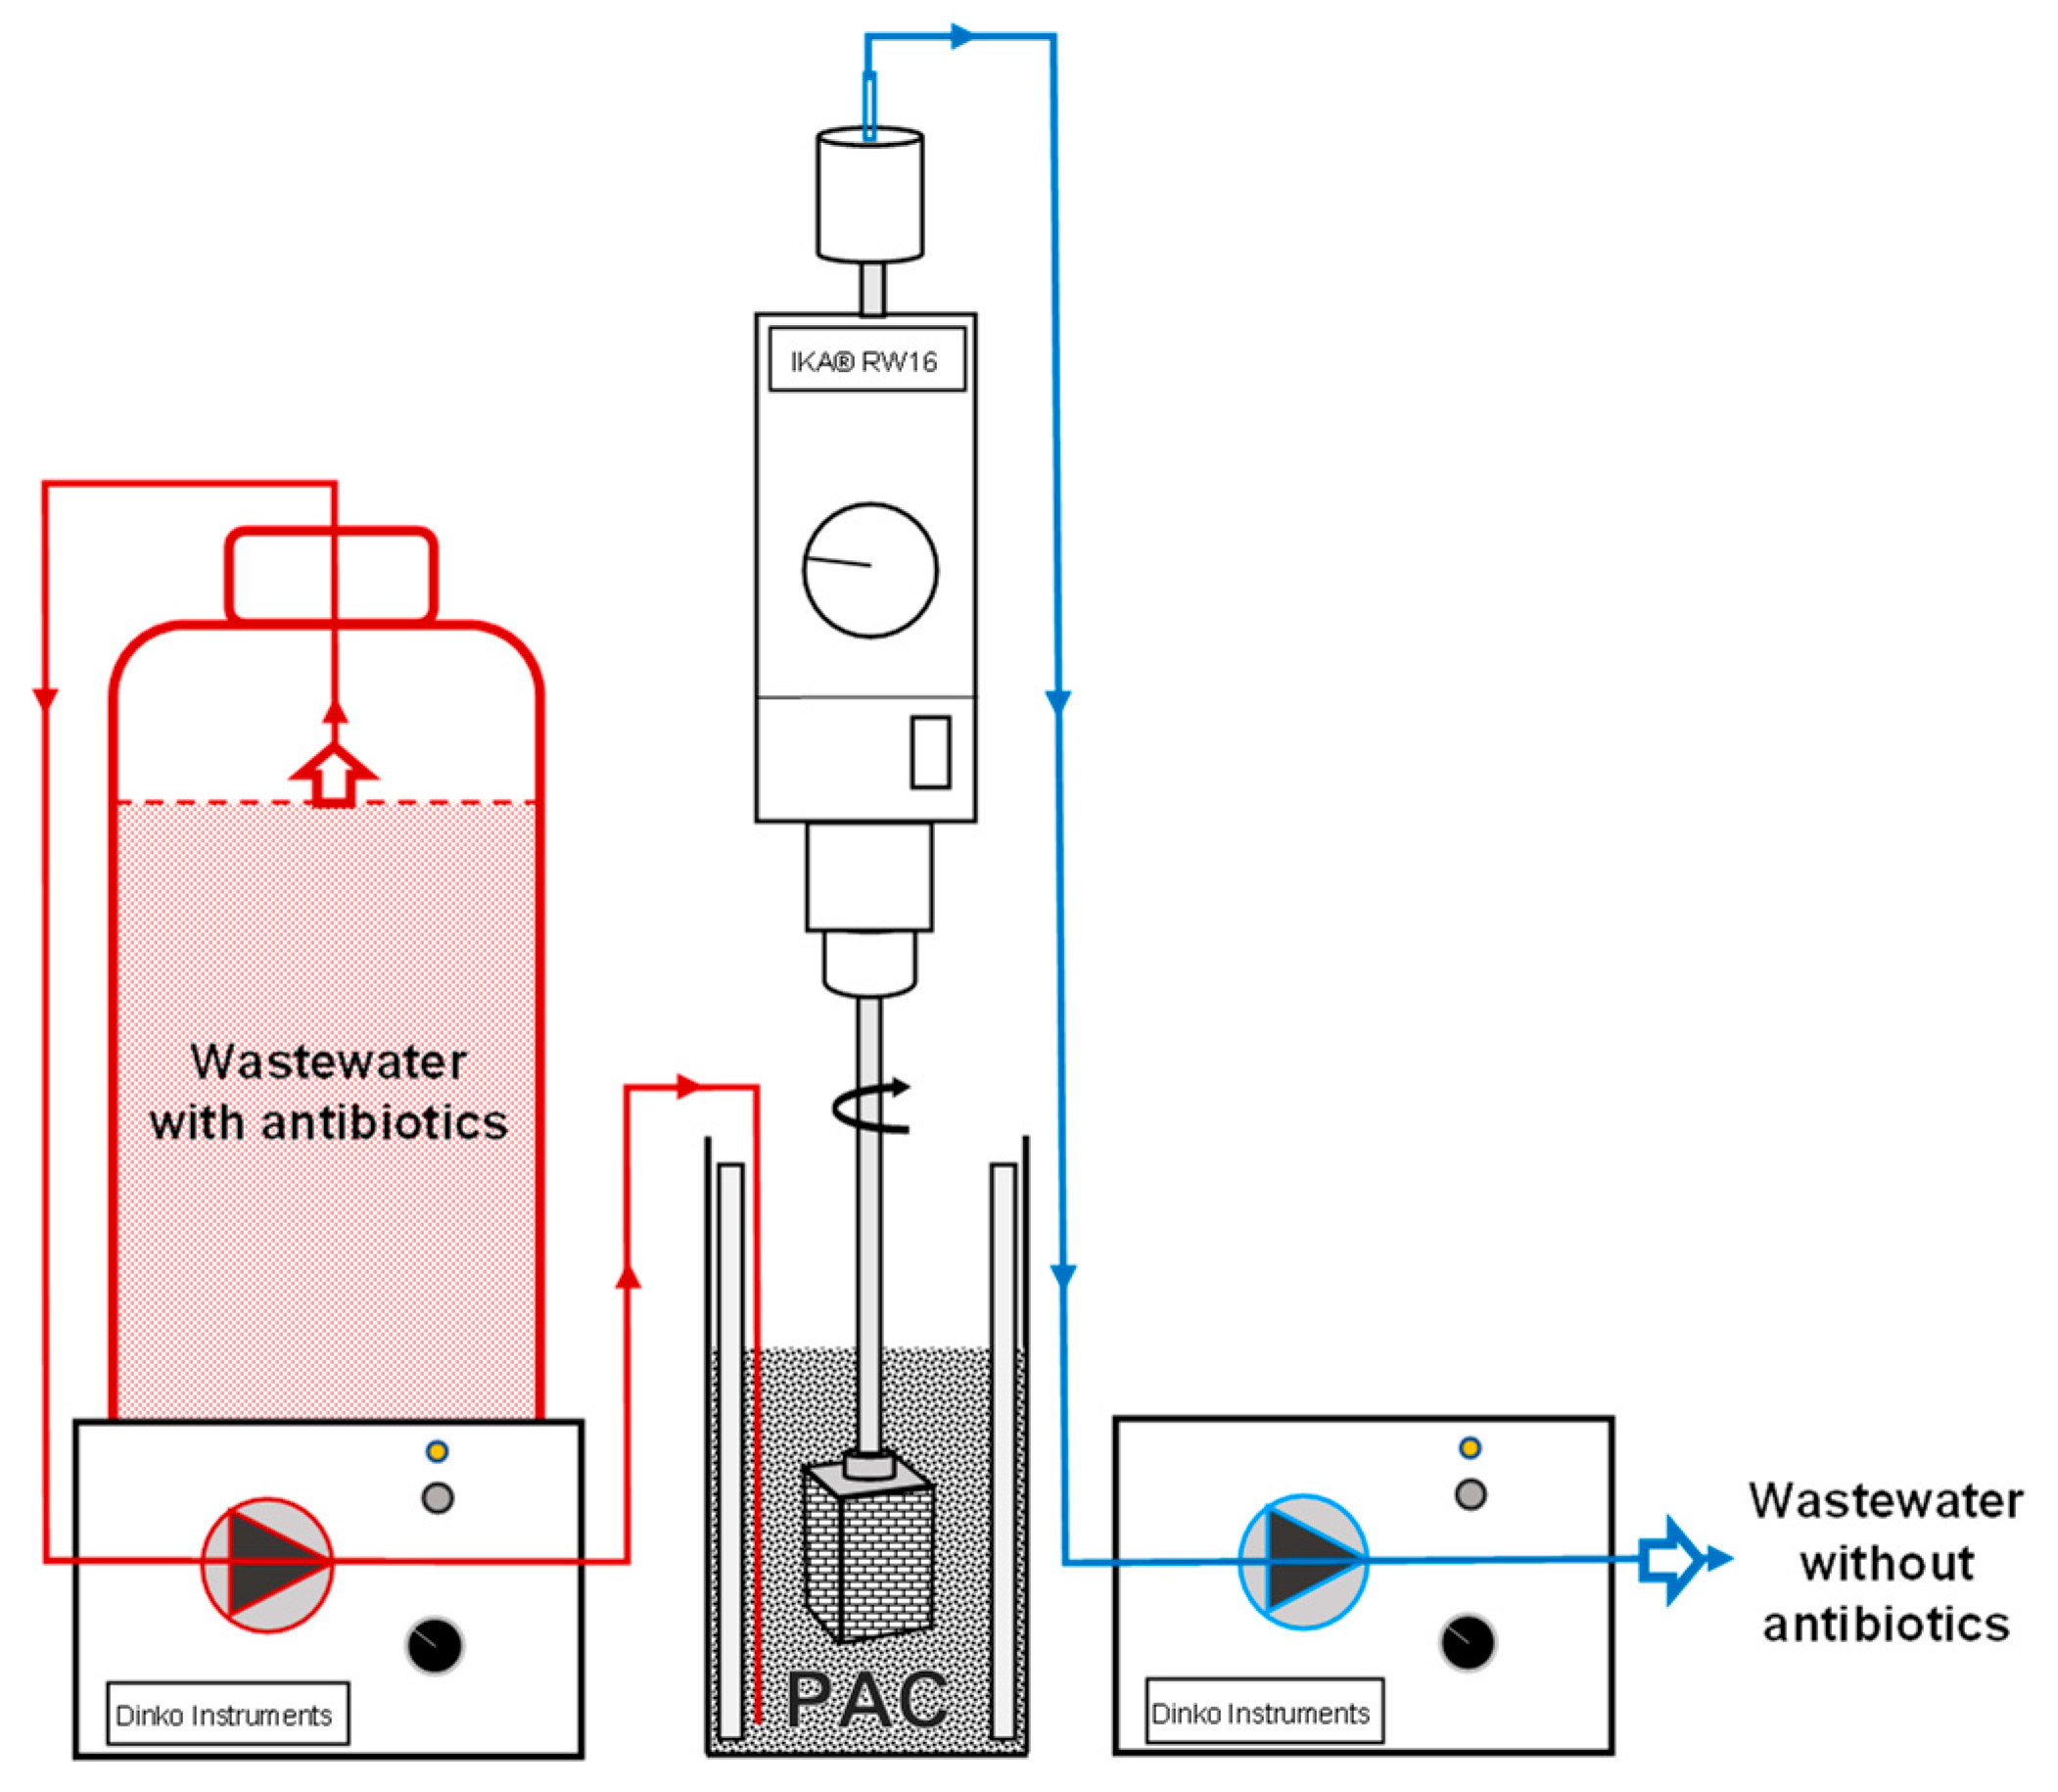
2.6. Continuous Operation of Fixed Bed and Spinning Submerged Filter Adsorbers
3. Results and Discussion
3.1. Isotherm Adsorptions of Antibiotics in Activated Carbons
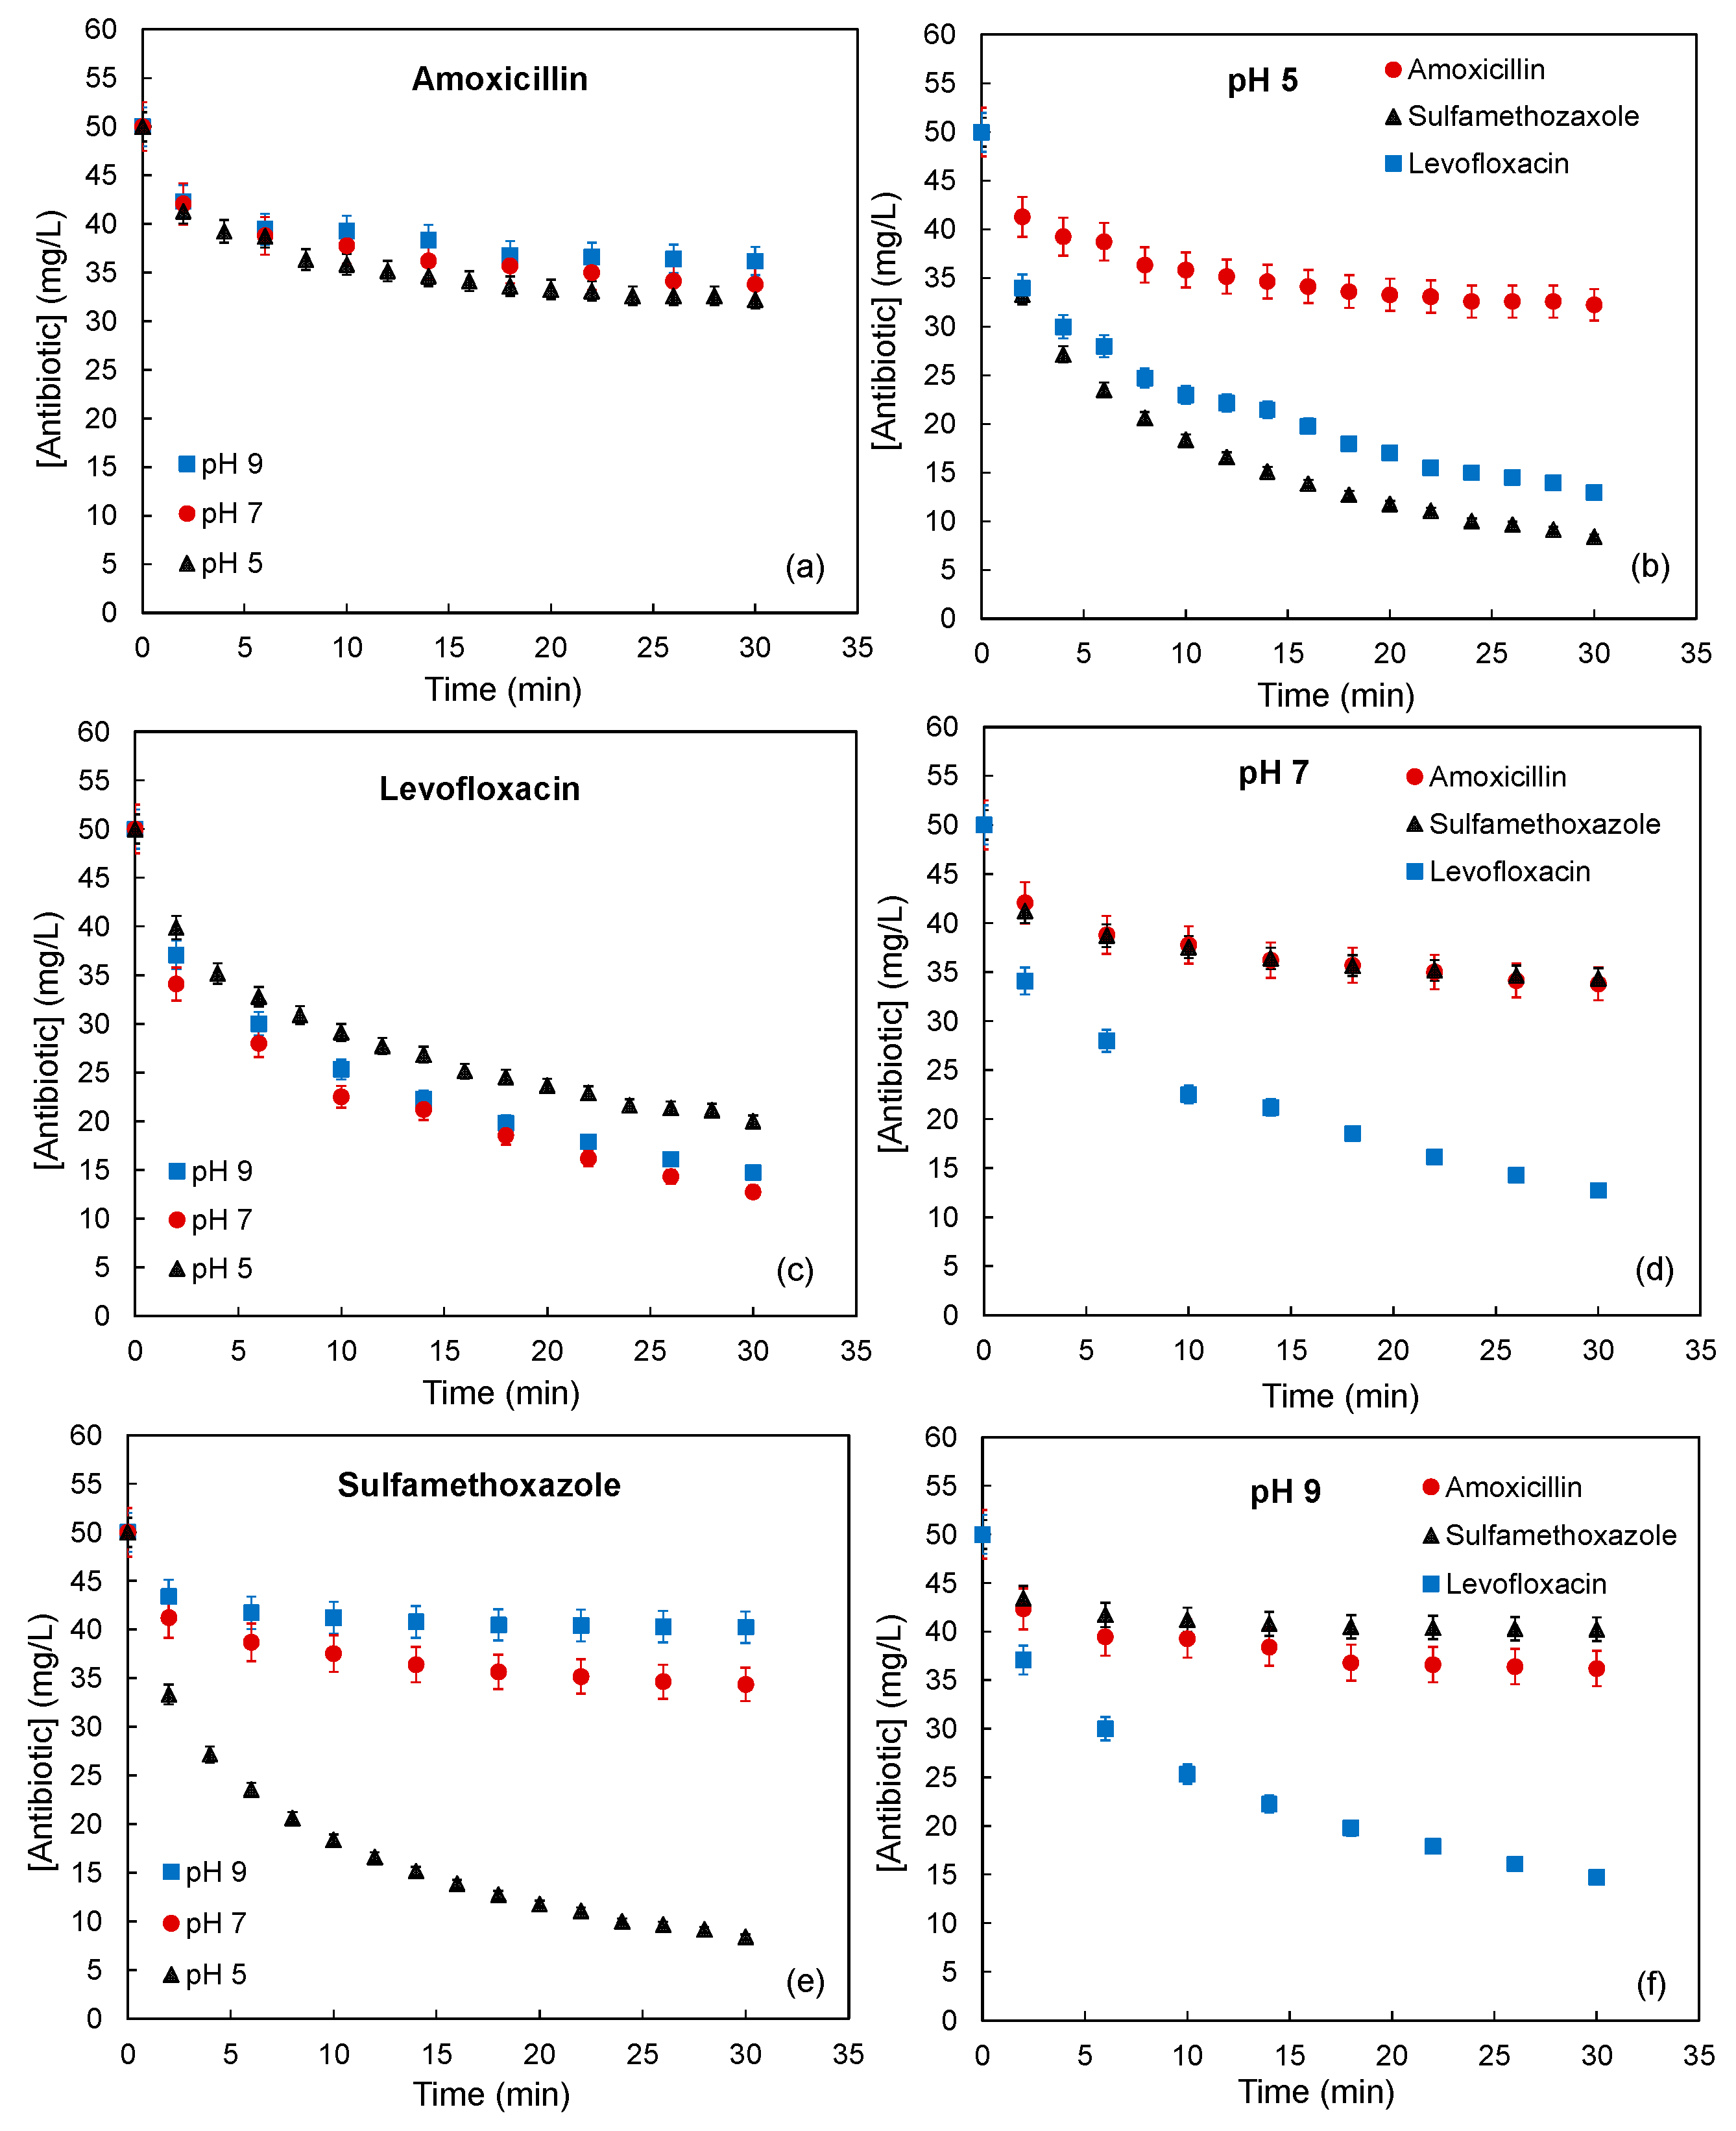
3.2. Effect of pH in Antibiotic Adsorption Kinetics on Activated Carbon
3.3. Effect of PAC Concentration in Antibiotic Adsorption Kinetics on PAC
3.4. Effect of Antibiotic Concentration in Antibiotic Adsorption Kinetics on PAC
3.5. Fixed Bed Adsorber
3.5.1. Evaluation of Activated Carbon Particle Size on Fixed Bed Operation Conditions
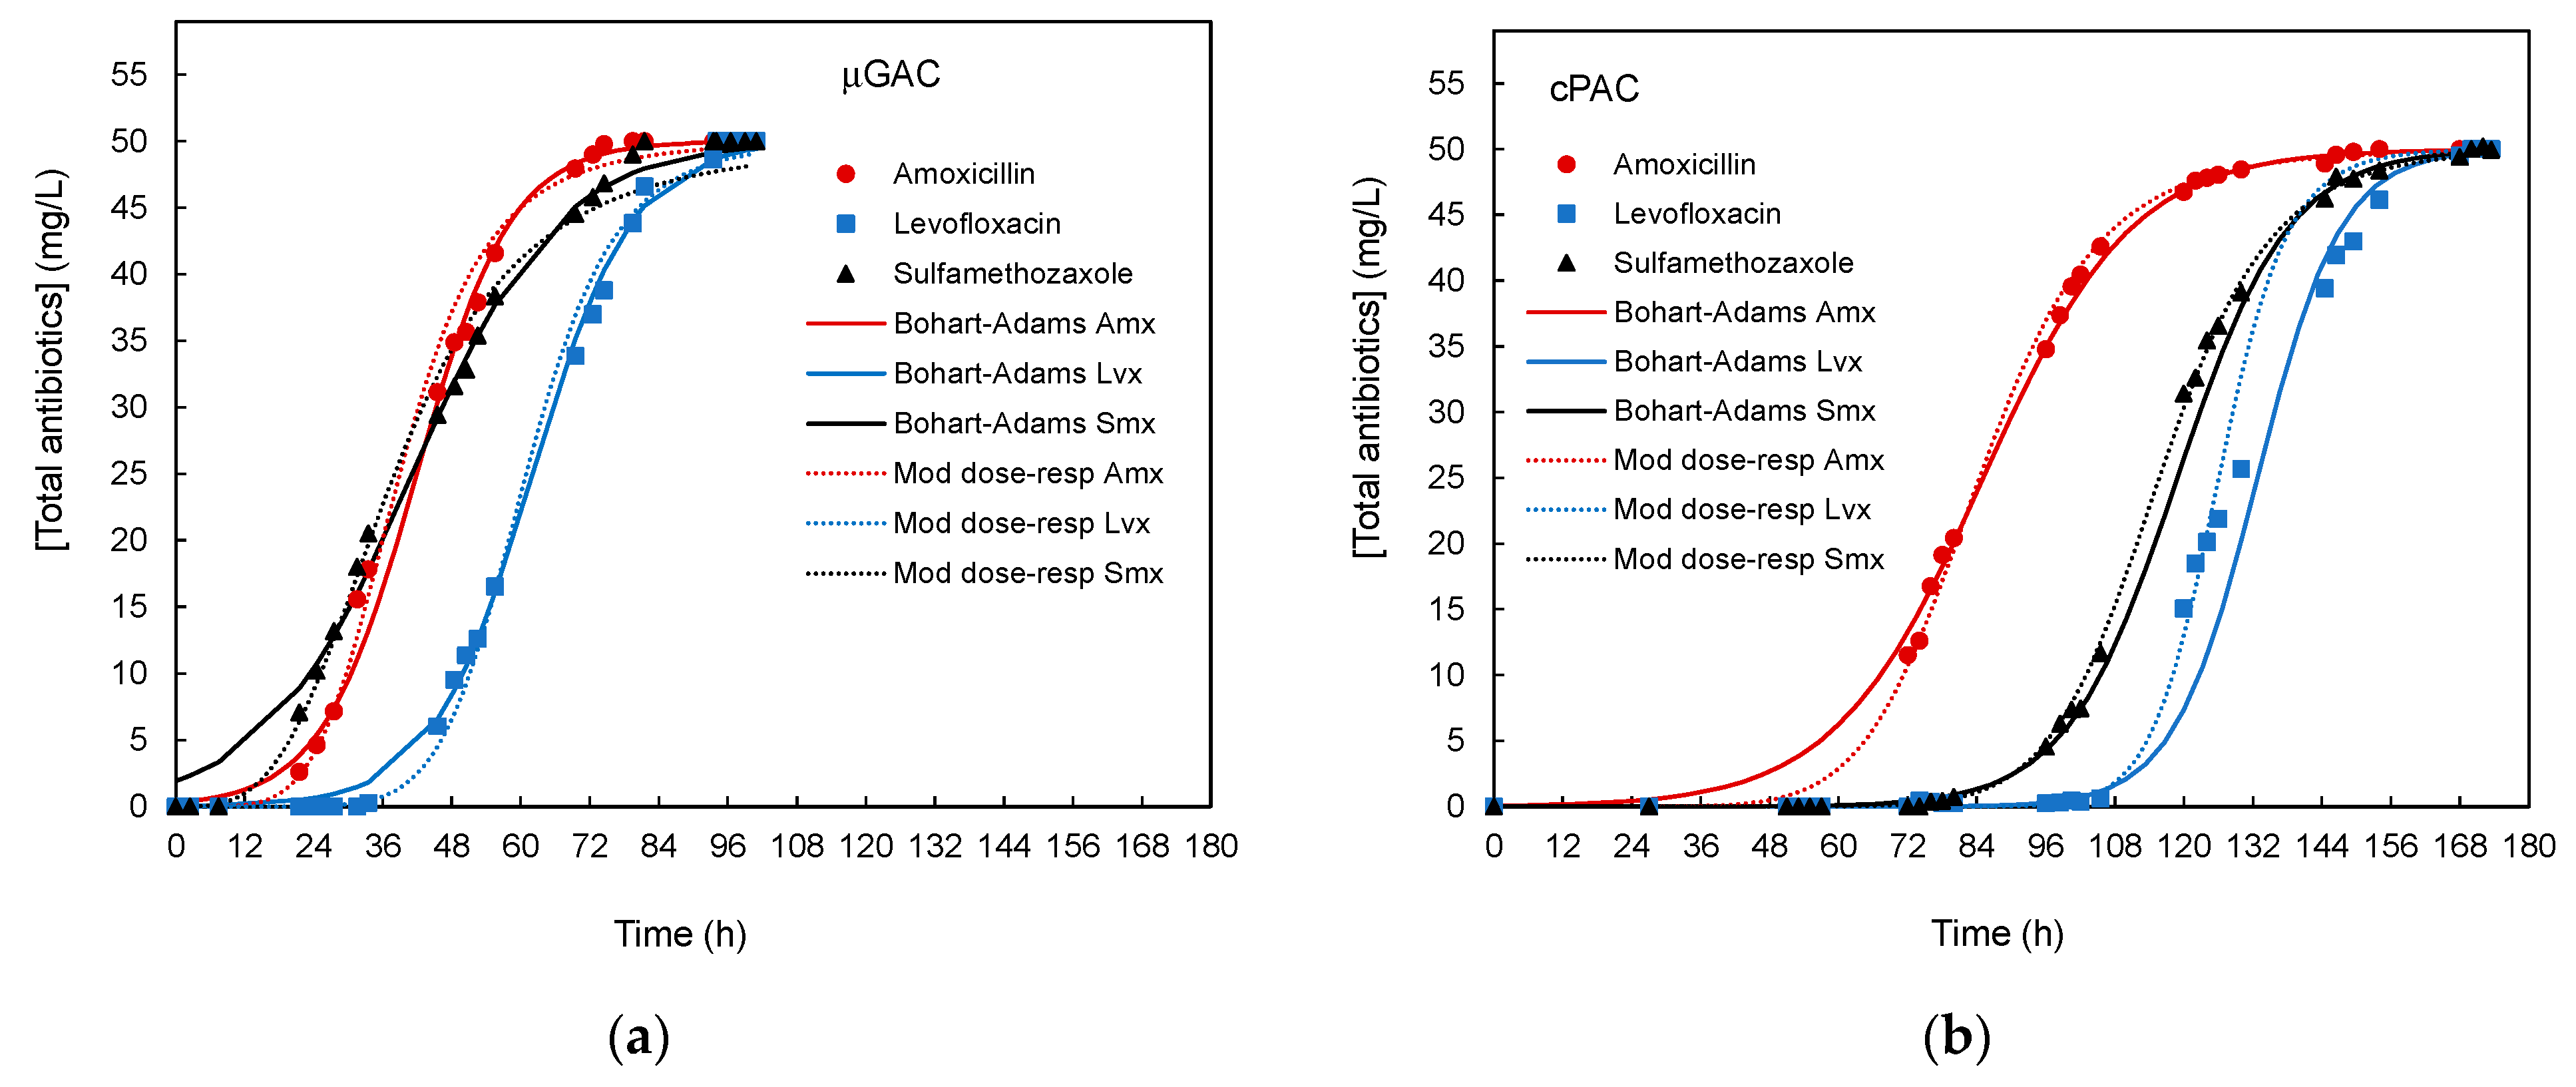
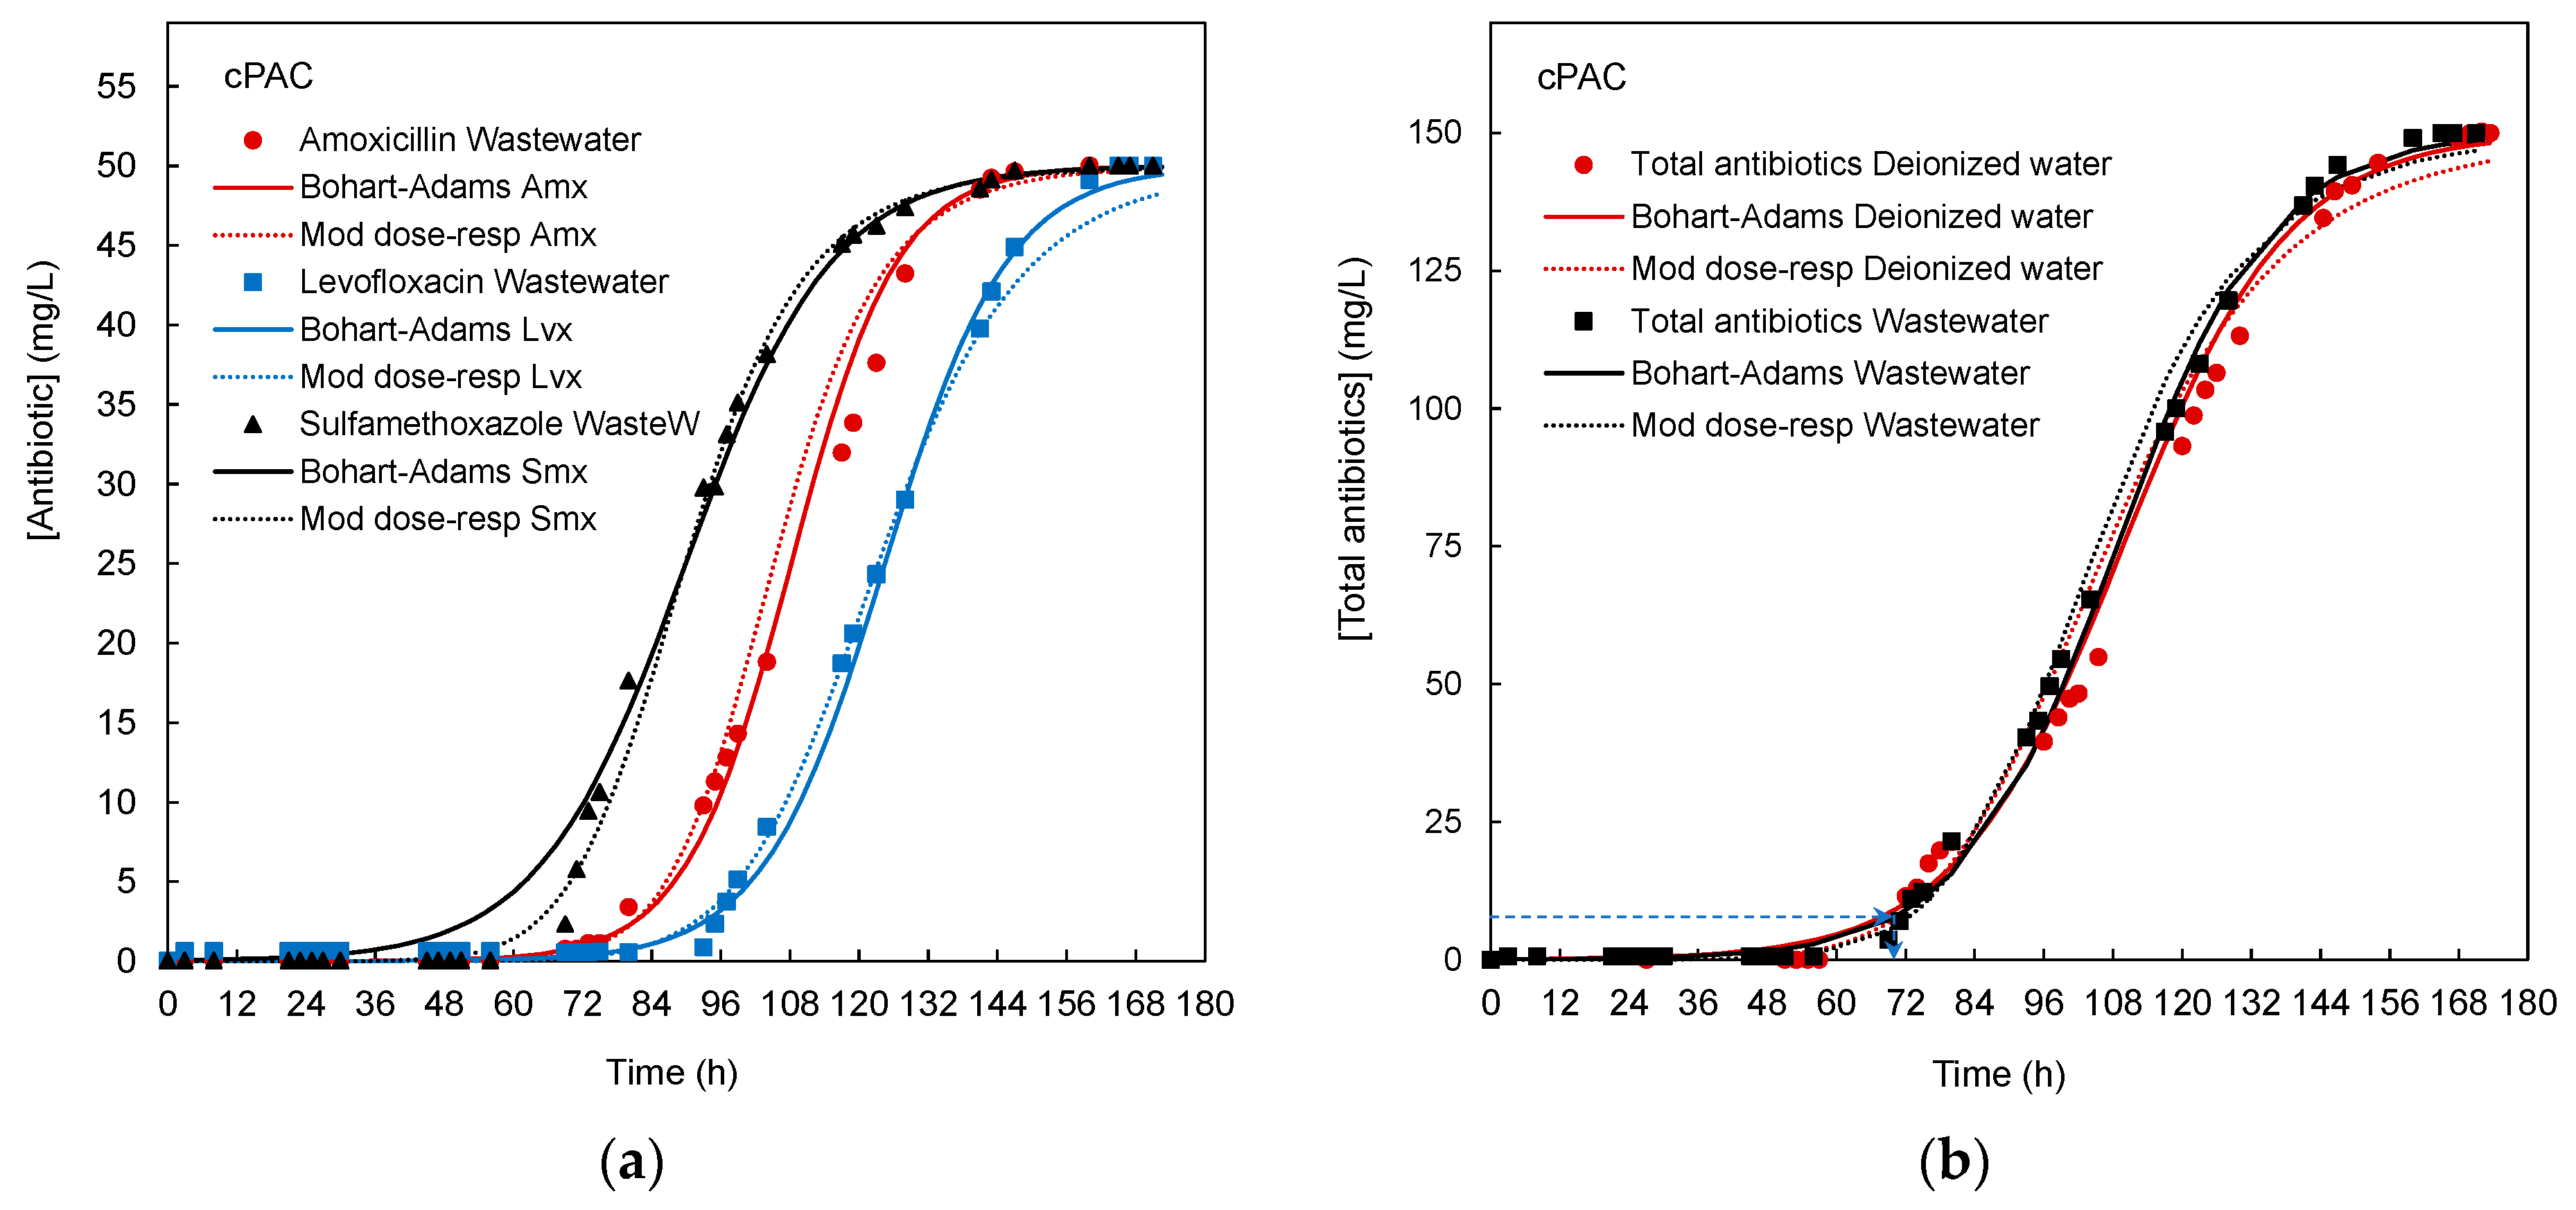
3.5.2. Continuous Removal of Antibiotics with a Fixed Bed Packed with μGAC or cPAC
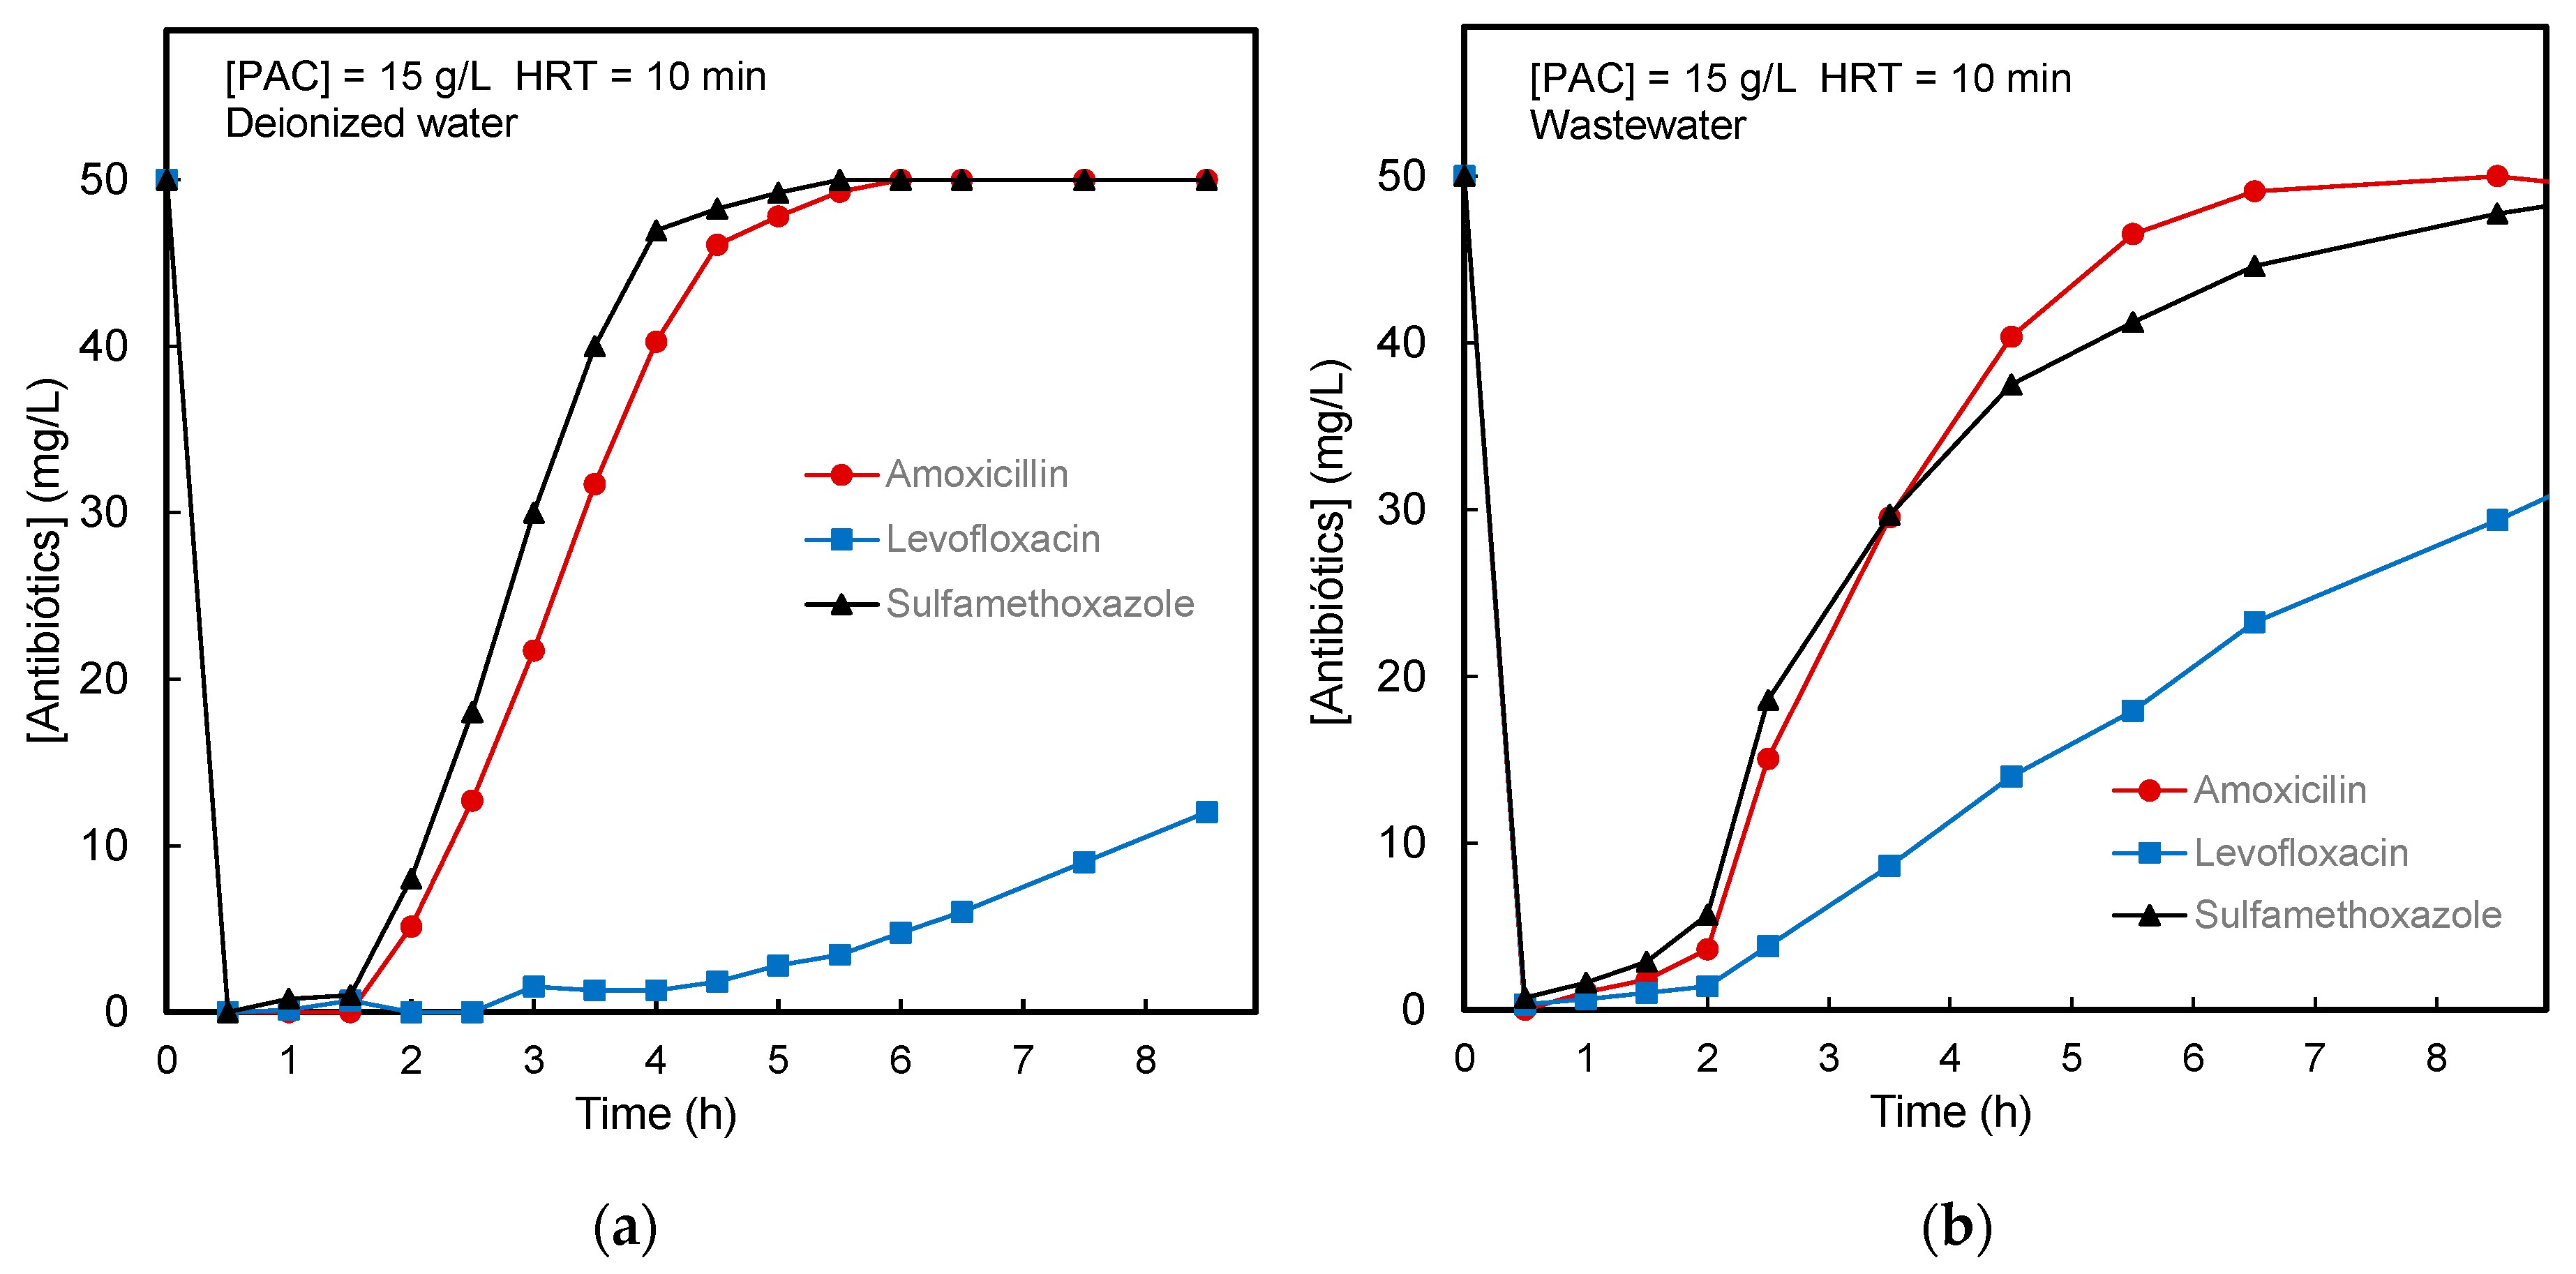
3.6. Continuous Removal of Antibiotics with a Spinning Submerged Filter Adsorber with PAC
4. Conclusions
Supplementary Materials
Author Contributions
Funding
Data Availability Statement
Conflicts of Interest
References
- Kovalakova, P.; Cizmas, L.; McDonald, T.J.; Marsalek, B.; Feng, M.; Sharma, V.K. Occurrence and toxicity of antibiotics in the aquatic environment: A review. Chemosphere 2020, 251, 126351. [Google Scholar] [CrossRef] [PubMed]
- Khan, M.T.; Shah, I.A.; Ihsanullah, I.; Naushad, M.; Ali, S.; Shah, S.H.A.; Mohammad, A.W. Hospital wastewater as a source of environmental contamination: An overview of management practices, environmental risks, and treatment processes. J. Water Process Eng. 2021, 41, 101990. [Google Scholar] [CrossRef]
- Omuferen, L.O.; Maseko, B.; Olowoyo, J.O. Occurrence of antibiotics in wastewater from hospital and convectional wastewater treatment plants and their impact on the effluent receiving rivers: Current knowledge between 2010 and 2019. Environ. Monit. Assess. 2022, 194, 306. [Google Scholar] [CrossRef]
- Wang, J.; Libing, C.; László, W.; Erzsébet, T. Occurrence and fate of antibiotics, antibiotic resistant genes (ARGs) and antibiotic resistant bacteria (ARB) in municipal wastewater treatment plant: An overview. Sci. Total Environ. 2020, 744, 140997. [Google Scholar] [CrossRef] [PubMed]
- Balakrishna, K.; Rath, A.; Praveenkumarreddy, Y.; Guruge, K.S.; Subedi, B. A review of the occurrence of pharmaceuticals and personal care products in Indian water bodies. Ecotoxicol. Environ. Saf. 2017, 137, 113–120. [Google Scholar] [CrossRef] [PubMed]
- European Parliament. Commission Implementing Decision (EU) 2020/1161 of 4 August 2020 Establishing a Watch List of Substances for Union-Wide Monitoring in the Field of Water Policy Pursuant to Directive 2008/105/EC of the European Parliament and of the Council; European Parliament: Strasbourg, France, 2020. [Google Scholar]
- Oberoi, A.S.; Jia, Y.; Zhang, H.; Khanal, S.K.; Lu, H. Insights into the Fate and Removal of Antibiotics in Engineered Biological Treatment Systems: A Critical Review. Environ. Sci. Technol. 2019, 53, 7234–7264. [Google Scholar] [CrossRef] [PubMed]
- Sagaseta de Ilurdoz, M.; Sadhwani, J.J.; Reboso, J.V. Antibiotic removal processes from water & wastewater for the protection of the aquatic environment—A review. J. Water Process Eng. 2022, 45, 102474. [Google Scholar] [CrossRef]
- Ghazal, H.; Koumaki, E.; Hoslett, J.; Malamis, S.; Katsou, E.; Barcelo, D.; Jouhara, H. Insights into current physical, chemical and hybrid technologies used for the treatment of wastewater contaminated with pharmaceuticals. J. Clean. Prod. 2022, 361, 132079. [Google Scholar] [CrossRef]
- Kosek, K.; Luczkiewicz, A.; Fudala-Książek, S.; Jankowska, K.; Szopińska, M.; Svahn, O.; Tränckner, J.; Kaiser, A.; Langas, V.; Björklund, E. Implementation of advanced micropollutants removal technologies in wastewater treatment plants (WWTPs)—Examples and challenges based on selected EU countries. Environ. Sci. Policy 2020, 112, 213–226. [Google Scholar] [CrossRef]
- Pal, S.; Ahamed, Z.; Pal, P. Removal of antibiotics and pharmaceutically active compounds from water environment: Experiments towards industrial scale up. Sep. Purif. Technol. 2022, 295, 121249. [Google Scholar] [CrossRef]
- Rout, P.R.; Zhang, T.C.; Bhunia, P.; Surampalli, R.Y. Treatment technologies for emerging contaminants in wastewater treatment plants: A review. Sci. Total Environ. 2021, 753, 141990. [Google Scholar] [CrossRef] [PubMed]
- Rashid, R.; Shafiq, I.; Akhter, P.; Iqbal, M.J.; Hussain, M. A state-of-the-art review on wastewater treatment techniques: The effectiveness of adsorption method. Environ. Sci. Pollut. Res. 2021, 28, 9050–9066. [Google Scholar] [CrossRef] [PubMed]
- Juela, D.M. Promising adsorptive materials derived from agricultural and industrial wastes for antibiotic removal: A comprehensive review. Sep. Purif. Technol. 2022, 284, 120286. [Google Scholar] [CrossRef]
- Grela, A.; Kuc, J.; Klimek, A.; Matusik, J.; Pamuła, J.; Franus, W.; Urbański, K.; Bajda, T. Erythromycin Scavenging from Aqueous Solutions by Zeolitic Materials Derived from Fly Ash. Molecules 2023, 28, 798. [Google Scholar] [CrossRef]
- Isaeva, V.I.; Vedenyapina, M.D.; Kurmysheva, A.Y.; Weichgrebe, D.; Nair, R.R.; Nguyen, N.P.T.; Kustov, L.M. Modern Carbon–Based Materials for Adsorptive Removal of Organic and Inorganic Pollutants from Water and Wastewater. Molecules 2021, 26, 6628. [Google Scholar] [CrossRef]
- Mangla, D.; Sharma, A.; Ikram, S. Critical review on adsorptive removal of antibiotics: Present situation, challenges and future perspective. J. Hazard. Mater. 2022, 425, 127946. [Google Scholar] [CrossRef]
- Ahmed, M.J.; Hameed, B.H. Removal of emerging pharmaceutical contaminants by adsorption in a fixed-bed column: A review. Ecotoxicol. Environ. Saf. 2018, 149, 257–266. [Google Scholar] [CrossRef]
- Mulder, M.; Antakyali, D.; Ante, S. Costs of Removal of Micropollutants from Effluents of Municipal Wastewater Treatment Plants—General Cost Estimates for the Netherlands Based on Implemented Full Scale Post Treatments of Effluents of Wastewater Treatment Plants in Germany and Switzerland; STOWA and Waterboard the Dommel: Amersfoort, The Netherlands, 2015. [Google Scholar]
- Paredes, L.; Alfonsin, C.; Allegue, T.; Omil, F.; Carballa, M. Integrating granular activated carbon in the post-treatment of membrane and settler effluents to improve organic micropollutants removal. Chem. Eng. J. 2018, 345, 79–86. [Google Scholar] [CrossRef]
- Guillossou, R.; Roux, J.L.; Mailler, R.; Vulliet, E.; Morlay, C.; Nauleau, F.; Gasperi, J.; Rocher, V. Organic micropollutants in a large wastewater treatment plant: What are the benefits of an advanced treatment by activated carbon adsorption in comparison to conventional treatment? Chemosphere 2019, 218, 1050–1060. [Google Scholar] [CrossRef]
- Nasrollahi, N.; Vatanpour, V.; Khataee, A. Removal of antibiotics from wastewaters by membrane technology: Limitations, successes, and future improvements. Sci. Total Environ. 2022, 838, 156010. [Google Scholar] [CrossRef]
- Morsch, P.; Fuchs, S.; Möhlendick, L.; Süsser, M.; Nirschl, H. Elimination of micropollutants from municipal wastewater by adsorption on powdered activated carbon and separation by innovative precoat filtration. Part 1: Adsorption capacity of activated carbons and initial filtration investigations. Sep. Purif. Technol. 2021, 277, 119052. [Google Scholar] [CrossRef]
- Obón, J.M.; Angosto, J.M.; González-Soto, F.; Ascua, A.; Fernández-López, J.A. Prototyping a spinning adsorber submerged filter for continuous removal of wastewater contaminants. J. Water Process Eng. 2022, 45, 102515. [Google Scholar] [CrossRef]
- Adriaenssens, N.; Bruyndonckx, R.; Versporten, A.; Hens, N.; Monnet, D.L. Consumption of quinolones in the community, European Union/European Economic Area, 1997–2017. J. Antimicrob. Chemother. 2021, 76, 37–44. [Google Scholar] [CrossRef]
- Sinha, P.; Datar, A.; Jeong, C.; Deng, X.; Chung, Y.G.; Lin, L.C. Surface area determination of porous materials using the Brunauer–Emmett–Teller (BET) method: Limitations and improvements. J. Phys. Chem. C 2019, 123, 20195–20209. [Google Scholar] [CrossRef]
- Ašperger, D.; Tišler, V.; Zrnčić, M.; Pavlović, D.M.; Babić, S.; Horvat, A.J.M.; Kaštelan-Macan, M. HPLC–DAD–FLD Determination of Veterinary Pharmaceuticals in Pharmaceutical Industry Wastewater with Precolumn Derivatization Using Fluorescamine. Chromatographia 2014, 77, 1059–1066. [Google Scholar] [CrossRef]
- Chu, K.H. Breakthrough curve analysis by simplistic models of fixed bed adsorption: In defense of the century-old Bohart-Adams model. Chem. Eng. J. 2020, 380, 122513. [Google Scholar] [CrossRef]
- Katsigiannis, A.; Noutsopoulos, C.; Mantziaras, J.; Gioldasi, M. Removal of emerging pollutants through Granular Activated Carbon. Chem. Eng. J. 2015, 280, 49–57. [Google Scholar] [CrossRef]
- Biswal, B.K.; Balasubramanian, R. Adsorptive removal of sulfonamides, tetracyclines and quinolones from wastewater and water using carbon-based materials: Recent developments and future directions. J. Clean. Prod. 2022, 349, 131421. [Google Scholar] [CrossRef]
- Yu, F.; Li, Y.; Han, S.; Ma, J. Adsorptive removal of antibiotics from aqueous solution using carbon materials. Chemosphere 2016, 153, 365–385. [Google Scholar] [CrossRef]
- Chakhtouna, H.; Benzeid, H.; Zari, N.; Qaiss, A.E.K.; Bouhfid, R. Functional CoFe2O4-modified biochar derived from banana pseudostem as an efficient adsorbent for the removal of amoxicillin from water. Sep. Purif. Technol. 2021, 266, 118592. [Google Scholar] [CrossRef]
- Putra, E.K.; Pranowo, R.; Sunarso, J.; Indraswati, N.; Ismadji, S. Performance of activated carbon and bentonite for adsorption of amoxicillin from wastewater: Mechanisms, isotherms and kinetics. Water Res. 2009, 43, 2419–2430. [Google Scholar] [CrossRef] [PubMed]
- Moussavi, G.; Alahabadi, A.; Yaghmaeian, K.; Eskandari, M. Preparation, characterization and adsorption potential of the NH4Cl-induced activated carbon for the removal of amoxicillin antibiotic from water. Chem. Eng. J. 2013, 217, 119–128. [Google Scholar] [CrossRef]
- Xu, Z.; Xiang, Y.; Zhou, H.; Yang, J.; He, Y.; Zhu, Z.; Zhou, Y. Manganese ferrite modified biochar from vinasse for enhanced adsorption of levofloxacin: Effects and mechanisms. Environ. Pollut. 2021, 272, 115968. [Google Scholar] [CrossRef] [PubMed]
- Wu, Q.; Zhang, Y.; Cui, M.H.; Liu, H.; Liu, H.; Zheng, Z.; Zheng, W.; Zhang, C.; Wen, D. Pyrolyzing pharmaceutical sludge to biochar as an efficient adsorbent for deep removal of fluoroquinolone antibiotics from pharmaceutical wastewater: Performance and mechanism. J. Hazard Mater. 2022, 426, 127798. [Google Scholar] [CrossRef] [PubMed]
- Wang, Z.; Jang, H.M. Comparative study on characteristics and mechanism of levofloxacin adsorption on swine manure biochar. Bioresour. Technol. 2022, 351, 127025. [Google Scholar] [CrossRef] [PubMed]
- Yao, Y.; Zhang, Y.; Gao, B.; Chen, R.; Wu, F. Removal of sulfamethoxazole (SMX) and sulfapyridine (SPY) from aqueous solutions by biochars derived from anaerobically digested bagasse. Environ. Sci. Pollut. Res. 2018, 25, 25659–25667. [Google Scholar] [CrossRef]
- Huang, J.; Zimmerman, A.R.; Chen, H.; Gao, B. Ball milled biochar effectively removes sulfamethoxazole and sulfapyridine antibiotics from water and wastewater. Environ. Pollut. 2020, 258, 113809. [Google Scholar] [CrossRef]
- Serna-Carrizales, J.C.; Collins-Martínez, V.H.; Flórez, E.; Gómez-Duran, C.F.A.; Palestino, G.; Ocampo-Pérez, R. Adsorption of sulfamethoxazole, sulfadiazine and sulfametazine in single and ternary systems on activated carbon. Experimental and DFT computations. J. Mol. Liq. 2021, 324, 114740. [Google Scholar] [CrossRef]
- Moral-Rodríguez, A.; Leyva-Ramos, R.; Ocampo-Pérez, R.; Mendoza-Barron, J.; Serratos-Alvarez, I.; Salazar-Rabago, J. Removal of ronidazole and sulfamethoxazole from water solutions by adsorption on granular activated carbon: Equilibrium and intraparticle diffusion mechanisms. Adsorption 2016, 22, 89–103. [Google Scholar] [CrossRef]
- Diaz, E.; Manzano, F.J.; Villamil, J.; Rodriguez, J.J.; Mohedano, F.A. Low-cost activated grape seed-derived hydrochar through hydrothermal carbonization and chemical activation for sulfamethoxazole adsorption. Appl. Sci. 2019, 9, 5127. [Google Scholar] [CrossRef]
- Alves, T.C.; Cabrera-Codony, A.; Barceló, D.; Rodriguez-Mozaz, S.; Pinheiro, A.; González-Olmos, R. Influencing factors on the removal of pharmaceuticals from water with micro-grain activated carbon. Water Res. 2018, 144, 402–412. [Google Scholar] [CrossRef]
- Guillossou, R.; Le Roux, J.; Mailler, R.; Morlay, C.; Vulliet, E.; Nauleau, F.; Rocher, V.; Gasperi, J. Influence of the properties of 7 micro-grain activated carbons on organic micropollutants removal from wastewater effluent. Chemosphere 2020, 243, 125306. [Google Scholar] [CrossRef] [PubMed]
- Fundneider, T.; Acevedo Alonso, V.; Abbt-Braun, G.; Wick, A.; Albrecht, D.; Lackner, S. Empty bed contact time: The key for micropollutant removal in activated carbon filters. Water Res. 2021, 191, 116765. [Google Scholar] [CrossRef] [PubMed]
- Benstoem, F.; Nahrstedt, A.; Boehler, M.; Knopp, G.; Montag, D.; Siegrist, H.; Pinnekamp, J. Performance of granular activated carbon to remove micropollutants from municipal wastewater—A meta-analysis of pilot- and large-scale studies. Chemosphere 2017, 185, 105–118. [Google Scholar] [CrossRef]
- Mestre, A.S.; Campinas, M.; Viegas, R.M.C.; Mesquita, E.; Carvalho, A.P.; Rosa, M.J. Chapter 17—Activated carbons in full-scale advanced wastewater treatment. In Advanced Materials for Sustainable Environmental Remediation; Giannakoudakis, D., Meili, L., Anastopoulos, I., Eds.; Elsevier: Amsterdam, The Netherlands, 2022; pp. 433–475. [Google Scholar] [CrossRef]
- Hu, Q.; Xie, Y.; Zhang, Z. Modification of breakthrough models in a continuous-flow fixed-bed column: Mathematical characteristics of breakthrough curves and rate profiles. Sep. Purif. Technol. 2020, 238, 116399. [Google Scholar] [CrossRef]
- Darweesh, T.M.; Ahmed, M.J. Batch and fixed bed adsorption of levofloxacin on granular activated carbon from date (Phoenix dactylifera L.) stones by KOH chemical activation. Environ. Toxicol. Pharmacol. 2017, 50, 159–166. [Google Scholar] [CrossRef] [PubMed]
- Espina de Franco, M.A.; Bonfante de Carvalho, C.; Marques Bonetto, M.; de Pelegrini Soares, R.; Amaral Féris, L. Removal of amoxicillin from water by adsorption onto activated carbon in batch process and fixed bed column: Kinetics, isotherms, experimental design and breakthrough curves modelling. J. Clean. Prod. 2017, 161, 947–956. [Google Scholar] [CrossRef]
- Zietzschmann, F.; Stützer, C.; Jekel, M. Granular activated carbon adsorption of organic micro-pollutants in drinking water and treated wastewater—Aligning breakthrough curves and capacities. Water Res. 2016, 92, 180–187. [Google Scholar] [CrossRef] [PubMed]
- Evers, M.; Lange, R.L.; Heinz, E.; Wichern, M. Simultaneous powdered activated carbon dosage for micropollutant removal on a municipal wastewater treatment plant compared to the efficiency of a post treatment stage. J. Water Process Eng. 2022, 47, 102755. [Google Scholar] [CrossRef]
- Campinas, M.; Viegas, R.M.C.; Almeida, C.M.M.; Martins, A.; Silva, C.; Mesquita, E.; Coelho, M.R.; Silva, S.; Cardoso, V.V.; Benoliel, M.J.; et al. Powdered activated carbon full-scale addition to the activated sludge reactor of a municipal wastewater treatment plant: Pharmaceutical compounds control and overall impact on the process. J. Water Process Eng. 2022, 49, 102975. [Google Scholar] [CrossRef]
- Kårelid, V.; Larsson, G.; Björlenius, B. Pilot-scale removal of pharmaceuticals in municipal wastewater: Comparison of granular and powdered activated carbon treatment at three wastewater treatment plants. J. Environ. Manag. 2017, 193, 491–502. [Google Scholar] [CrossRef] [PubMed]


| Isotherm Model Parameters | ||||||||
|---|---|---|---|---|---|---|---|---|
| Langmuir | Freundlich | |||||||
| AC | Antibiotic | qmax | qmax | KL | R2 | KF | nF | R2 |
| (mg/g) | (mmol/g) | (L/mg) | (mg(n−1)/n/g∙L1/n) | |||||
| μGAC | Amoxicillin | 116 | 0.317 | 0.31 | 0.7685 | 47.51 | 4.12 | 0.9464 |
| Levofloxacin | 150 | 0.415 | 10.20 | 0.8703 | 128.61 | 20.97 | 0.9424 | |
| Sulfamethoxazole | 193 | 0.762 | 0.08 | 0.9671 | 29.23 | 2.24 | 0.989 | |
| cPAC | Amoxicillin | 171 | 0.468 | 0.24 | 0.9790 | 55.24 | 3.29 | 0.9823 |
| Levofloxacin | 246 | 0.681 | 3.96 | 0.8125 | 171.42 | 8.96 | 0.9476 | |
| Sulfamethoxazole | 234 | 0.924 | 0.10 | 0.9823 | 44.21 | 2.48 | 0.9941 | |
| PAC | Amoxicillin | 172 | 0.471 | 0.50 | 0.8081 | 71.27 | 3.71 | 0.9813 |
| Levofloxacin | 299 | 0.827 | 3.57 | 0.8095 | 216.47 | 8.96 | 0.9476 | |
| Sulfamethoxazole | 225 | 0.888 | 0.25 | 0.8393 | 76.99 | 3.57 | 0.9636 | |
| Pseudo-First-Order Model Parameters | Pseudo-Second-Order Model Parameters | ||||||||
|---|---|---|---|---|---|---|---|---|---|
| Antibiotic | [PAC] (g/L) | qe (mg/g) | K1 (min−1) | R2 | qe (mg/g) | qe (mmol/g) | K2 (g/mg min) | K2 qe2 (mmol/g min) | R2 |
| Amoxicillin | 0.25 | 131.3 | 0.40961 | 0.975 | 147.6 | 0.404 | 0.00365 | 0.217 | 0.992 |
| 0.35 | 118.7 | 0.45433 | 0.947 | 126.1 | 0.345 | 0.00547 | 0.238 | 0.989 | |
| 0.50 | 89.4 | 0.63766 | 0.984 | 95.8 | 0.262 | 0.01053 | 0.265 | 0.998 | |
| Levofloxacin | 0.25 | 184.5 | 0.33143 | 0.972 | 205.6 | 0.568 | 0.00223 | 0.260 | 0.992 |
| 0.35 | 136.5 | 0.47790 | 0.982 | 151.5 | 0.419 | 0.00427 | 0.271 | 0.983 | |
| 0.50 | 96.9 | 0.60975 | 0.986 | 104.9 | 0.290 | 0.00951 | 0.289 | 0.998 | |
| Sulfamethoxazole | 0.25 | 175.7 | 0.16557 | 0.964 | 197.2 | 0.778 | 0.00113 | 0.173 | 0.989 |
| 0.35 | 128.6 | 0.24814 | 0.861 | 138.7 | 0.547 | 0.00303 | 0.230 | 0.929 | |
| 0.50 | 92.5 | 0.55086 | 0.952 | 104.0 | 0.410 | 0.00606 | 0.259 | 0.994 | |
| [Antibiotic] (mg/L) | qe (mg/g) | qe (mmol/g) | K2 (g/mg min) | K2 qe2 (mmol/g min) | R2 | |
|---|---|---|---|---|---|---|
| Amoxicillin | 100 | 163.1 | 0.446 | 0.00088 | 0.064 | 0.988 |
| 50 | 95.8 | 0.262 | 0.01053 | 0.264 | 0.998 | |
| 25 | 50.5 | 0.138 | 0.05905 | 0.412 | 0.996 | |
| Levofloxacin | 100 | 211.4 | 0.585 | 0.00186 | 0.229 | 0.998 |
| 50 | 104.9 | 0.290 | 0.00951 | 0.289 | 0.998 | |
| 25 | 50.6 | 0.140 | 0.15867 | 1.125 | 0.999 | |
| Sulfamethoxazole | 100 | 142.5 | 0.562 | 0.00371 | 0.297 | 0.996 |
| 50 | 104.0 | 0.410 | 0.00606 | 0.258 | 0.988 | |
| 25 | 50.5 | 0.199 | 0.06285 | 0.633 | 0.996 | |
Disclaimer/Publisher’s Note: The statements, opinions and data contained in all publications are solely those of the individual author(s) and contributor(s) and not of MDPI and/or the editor(s). MDPI and/or the editor(s) disclaim responsibility for any injury to people or property resulting from any ideas, methods, instructions or products referred to in the content. |
© 2023 by the authors. Licensee MDPI, Basel, Switzerland. This article is an open access article distributed under the terms and conditions of the Creative Commons Attribution (CC BY) license (https://creativecommons.org/licenses/by/4.0/).
Share and Cite
Obón, J.M.; Fernández-López, J.A.; Alacid, M.; Angosto, J.M. Spinning Submerged Filter Adsorber versus Packed Bed Adsorber for the Continuous Removal of Antibiotics from Wastewater with Activated Carbon. Water 2023, 15, 1726. https://doi.org/10.3390/w15091726
Obón JM, Fernández-López JA, Alacid M, Angosto JM. Spinning Submerged Filter Adsorber versus Packed Bed Adsorber for the Continuous Removal of Antibiotics from Wastewater with Activated Carbon. Water. 2023; 15(9):1726. https://doi.org/10.3390/w15091726
Chicago/Turabian StyleObón, José M., José A. Fernández-López, Mercedes Alacid, and José M. Angosto. 2023. "Spinning Submerged Filter Adsorber versus Packed Bed Adsorber for the Continuous Removal of Antibiotics from Wastewater with Activated Carbon" Water 15, no. 9: 1726. https://doi.org/10.3390/w15091726