
Monitoring Surface Water Area Changes in the Aral Sea Basin Using the Google Earth Engine Cloud Platform
 , ,
, ,  and
and 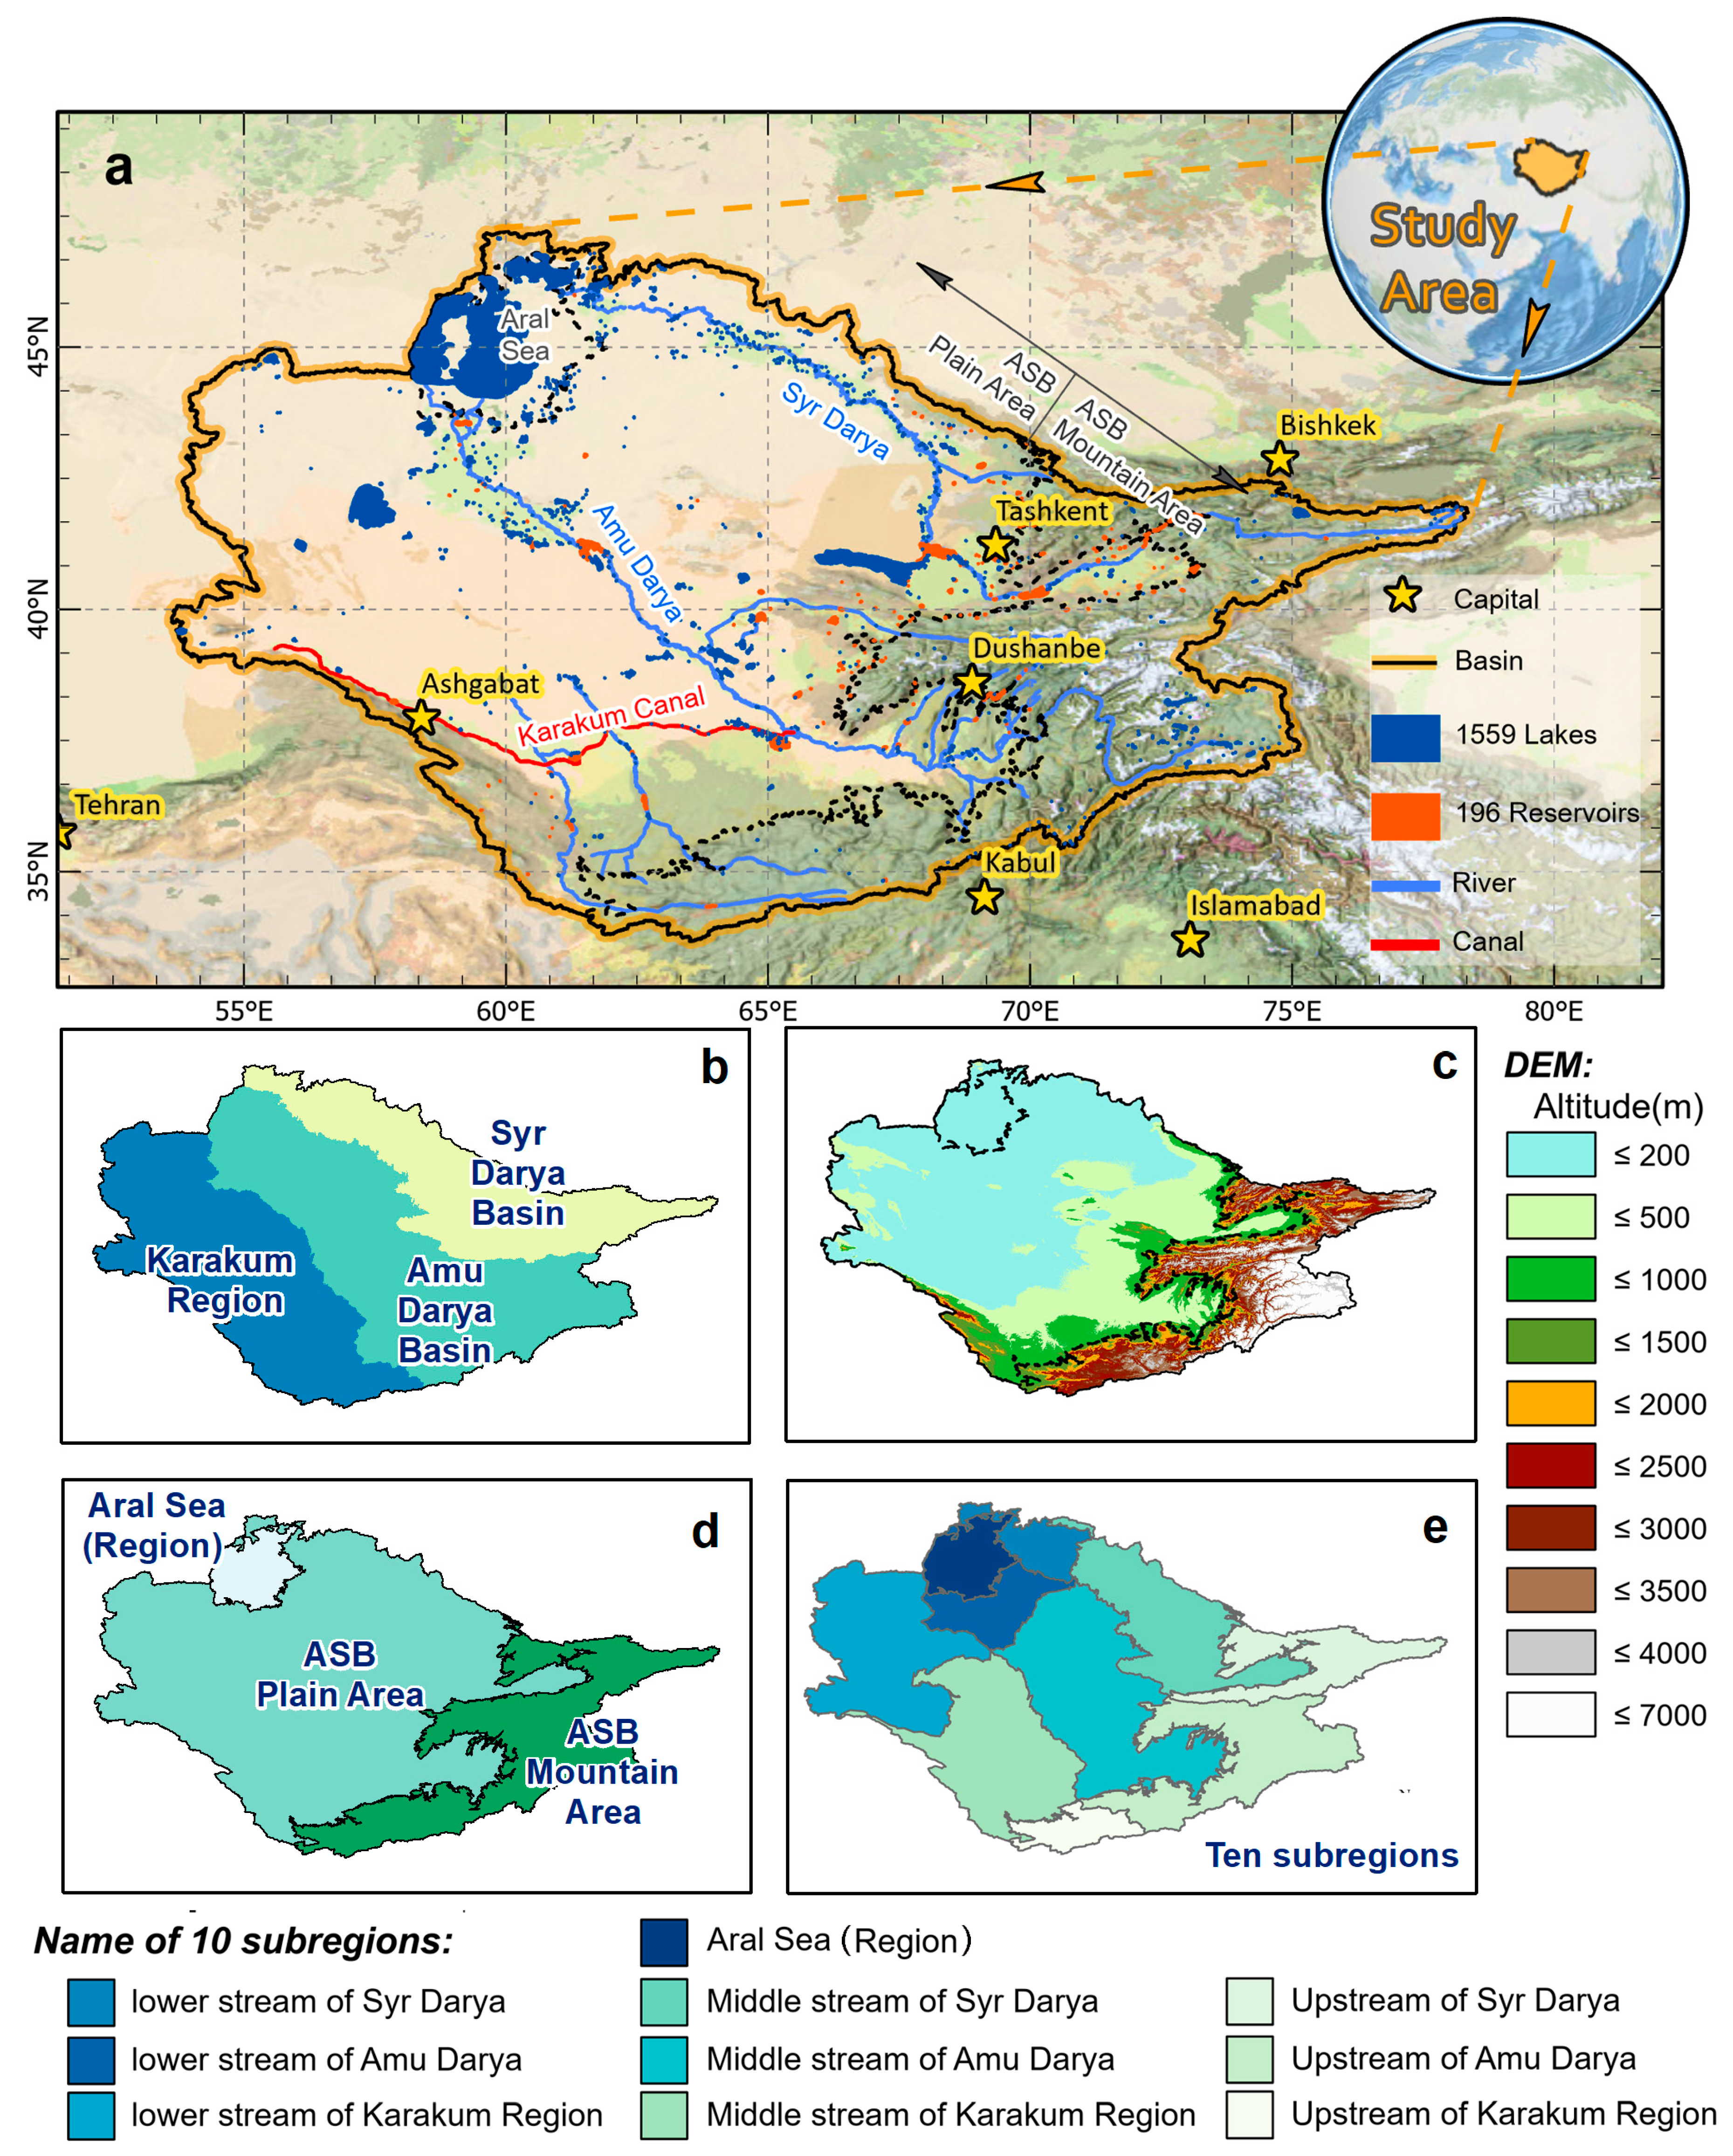
Abstract
:1. Introduction
2. Materials and Methods
2.1. Study Area
2.2. Data Sources
2.2.1. The Geo-Referenced Dams Databases
2.2.2. The HydroLAKES Database
2.2.3. The JRC GSW Dataset
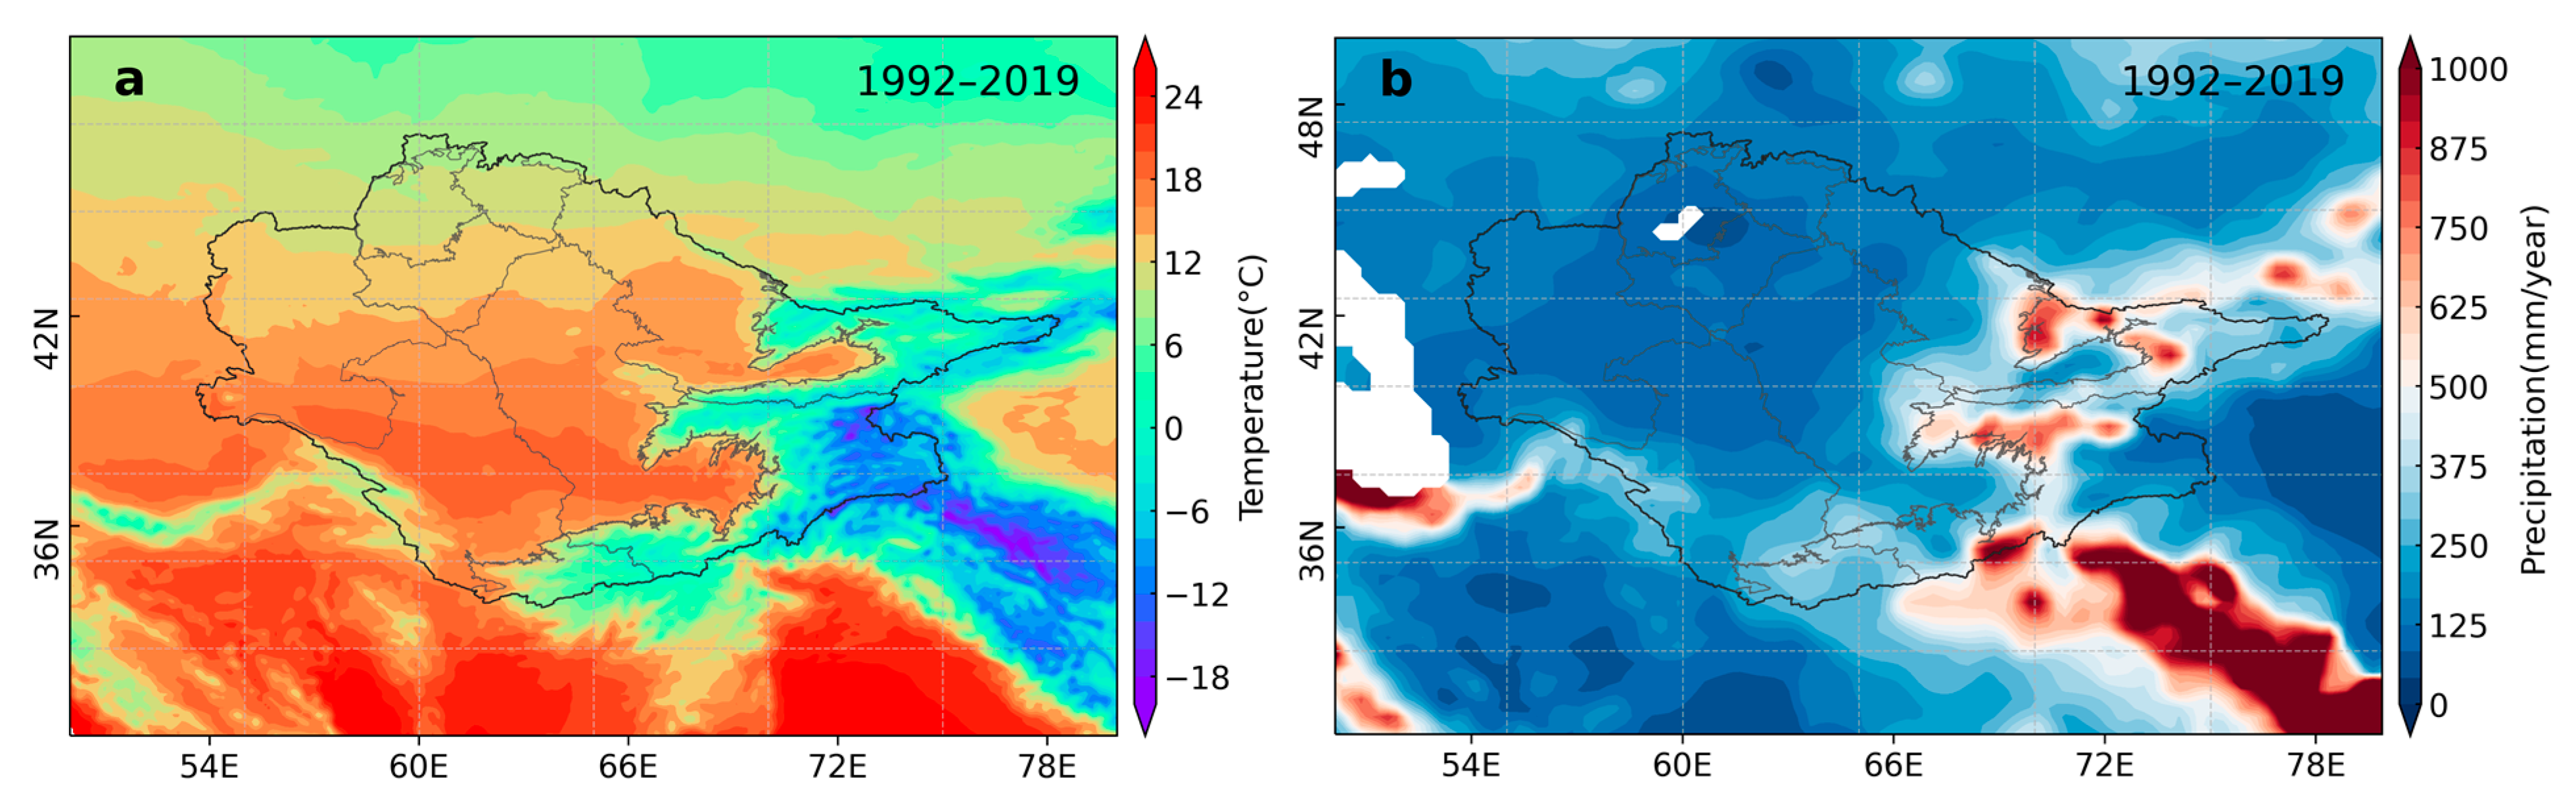
2.2.4. Other Relevant Data
2.3. Methods
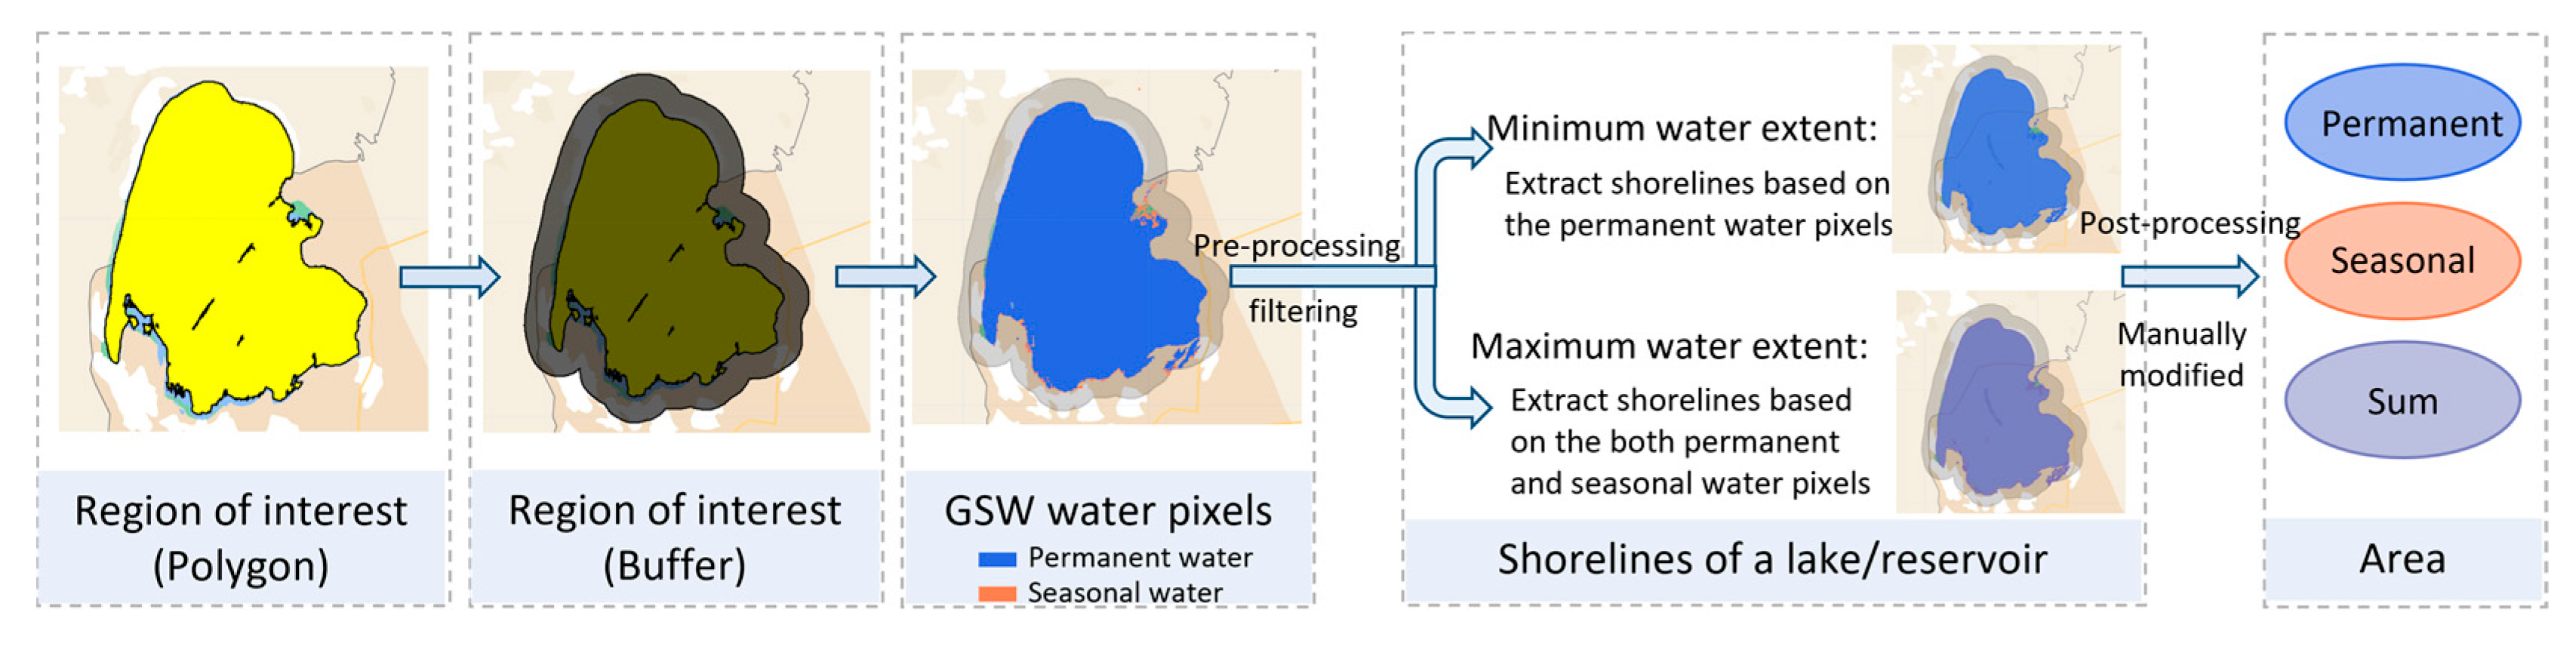
2.3.1. The Definition of the Permanent Water and Seasonal Water
2.3.2. Lake and Reservoir Area Extraction
2.3.3. Theil–Sen Slope
2.3.4. Transition Matrix of the LCLU Maps
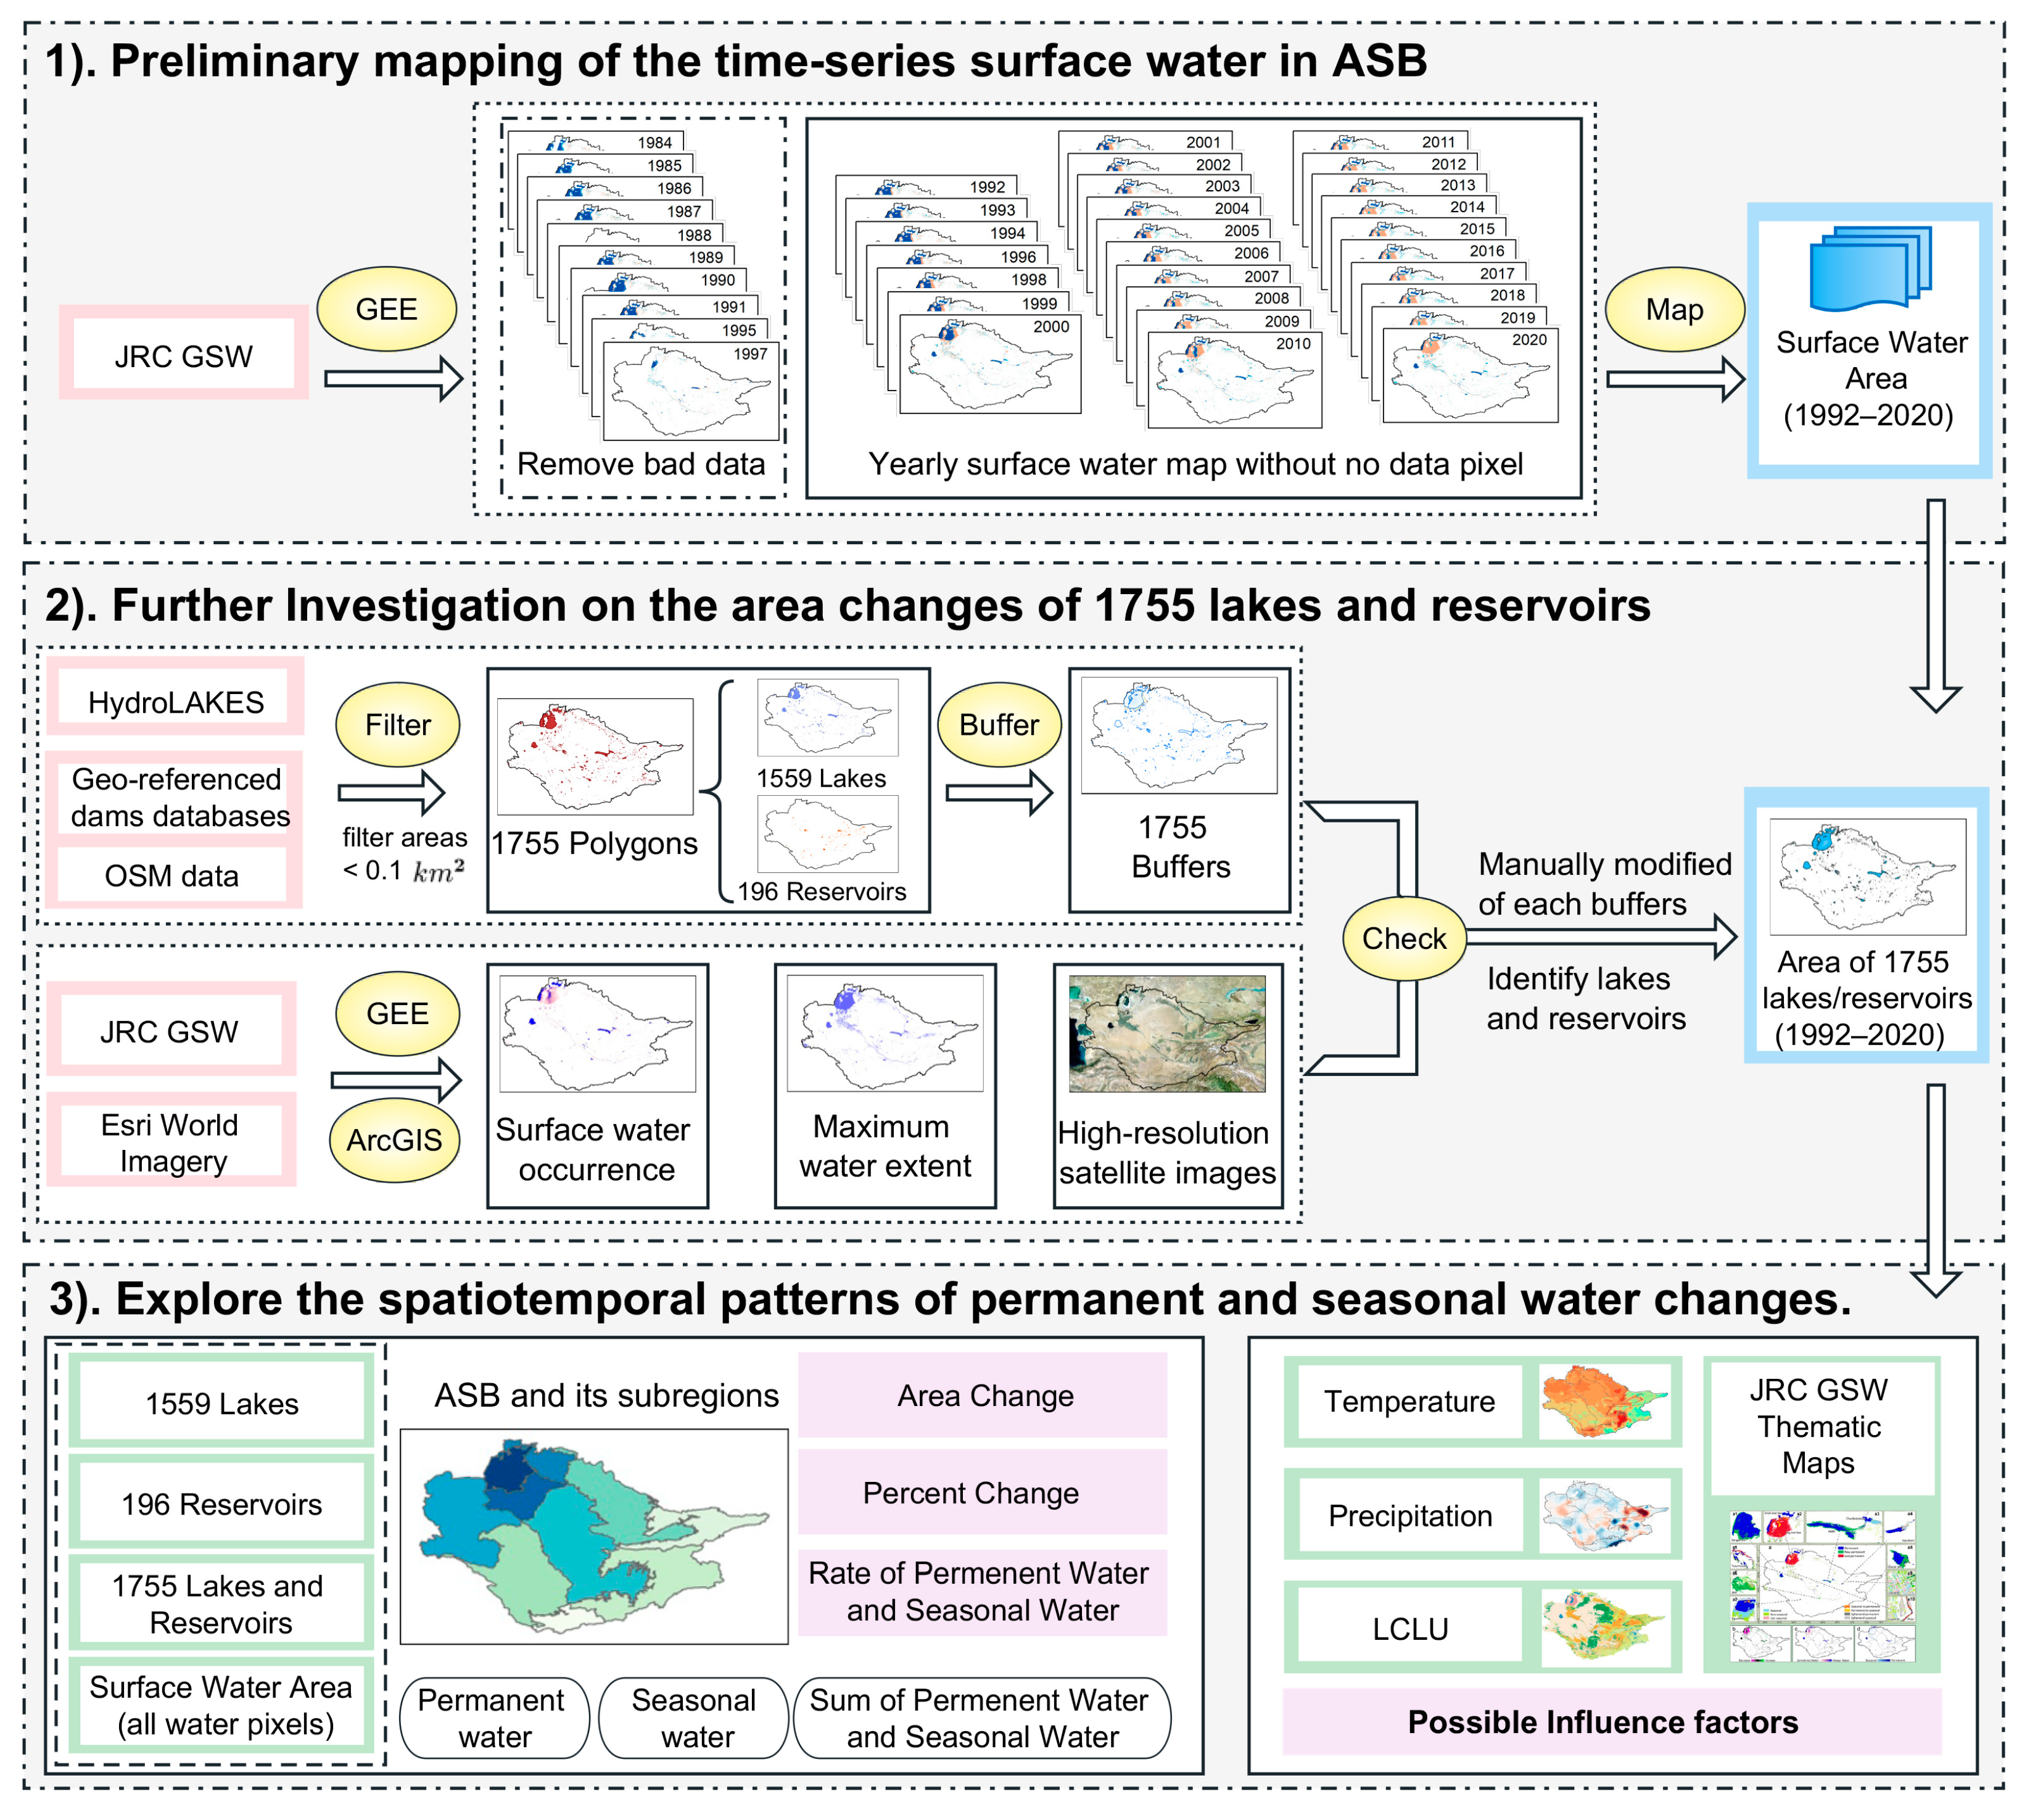
2.3.5. Flowchart of This Study
- (1)
- Preliminary Mapping of the Time-Series Surface Water in ASB
- (2)
- Further Investigation on the Area Changes of 1755 Lakes/Reservoirs

- (3)
- Explore the spatiotemporal patterns of permanent and seasonal water changes
3. Results
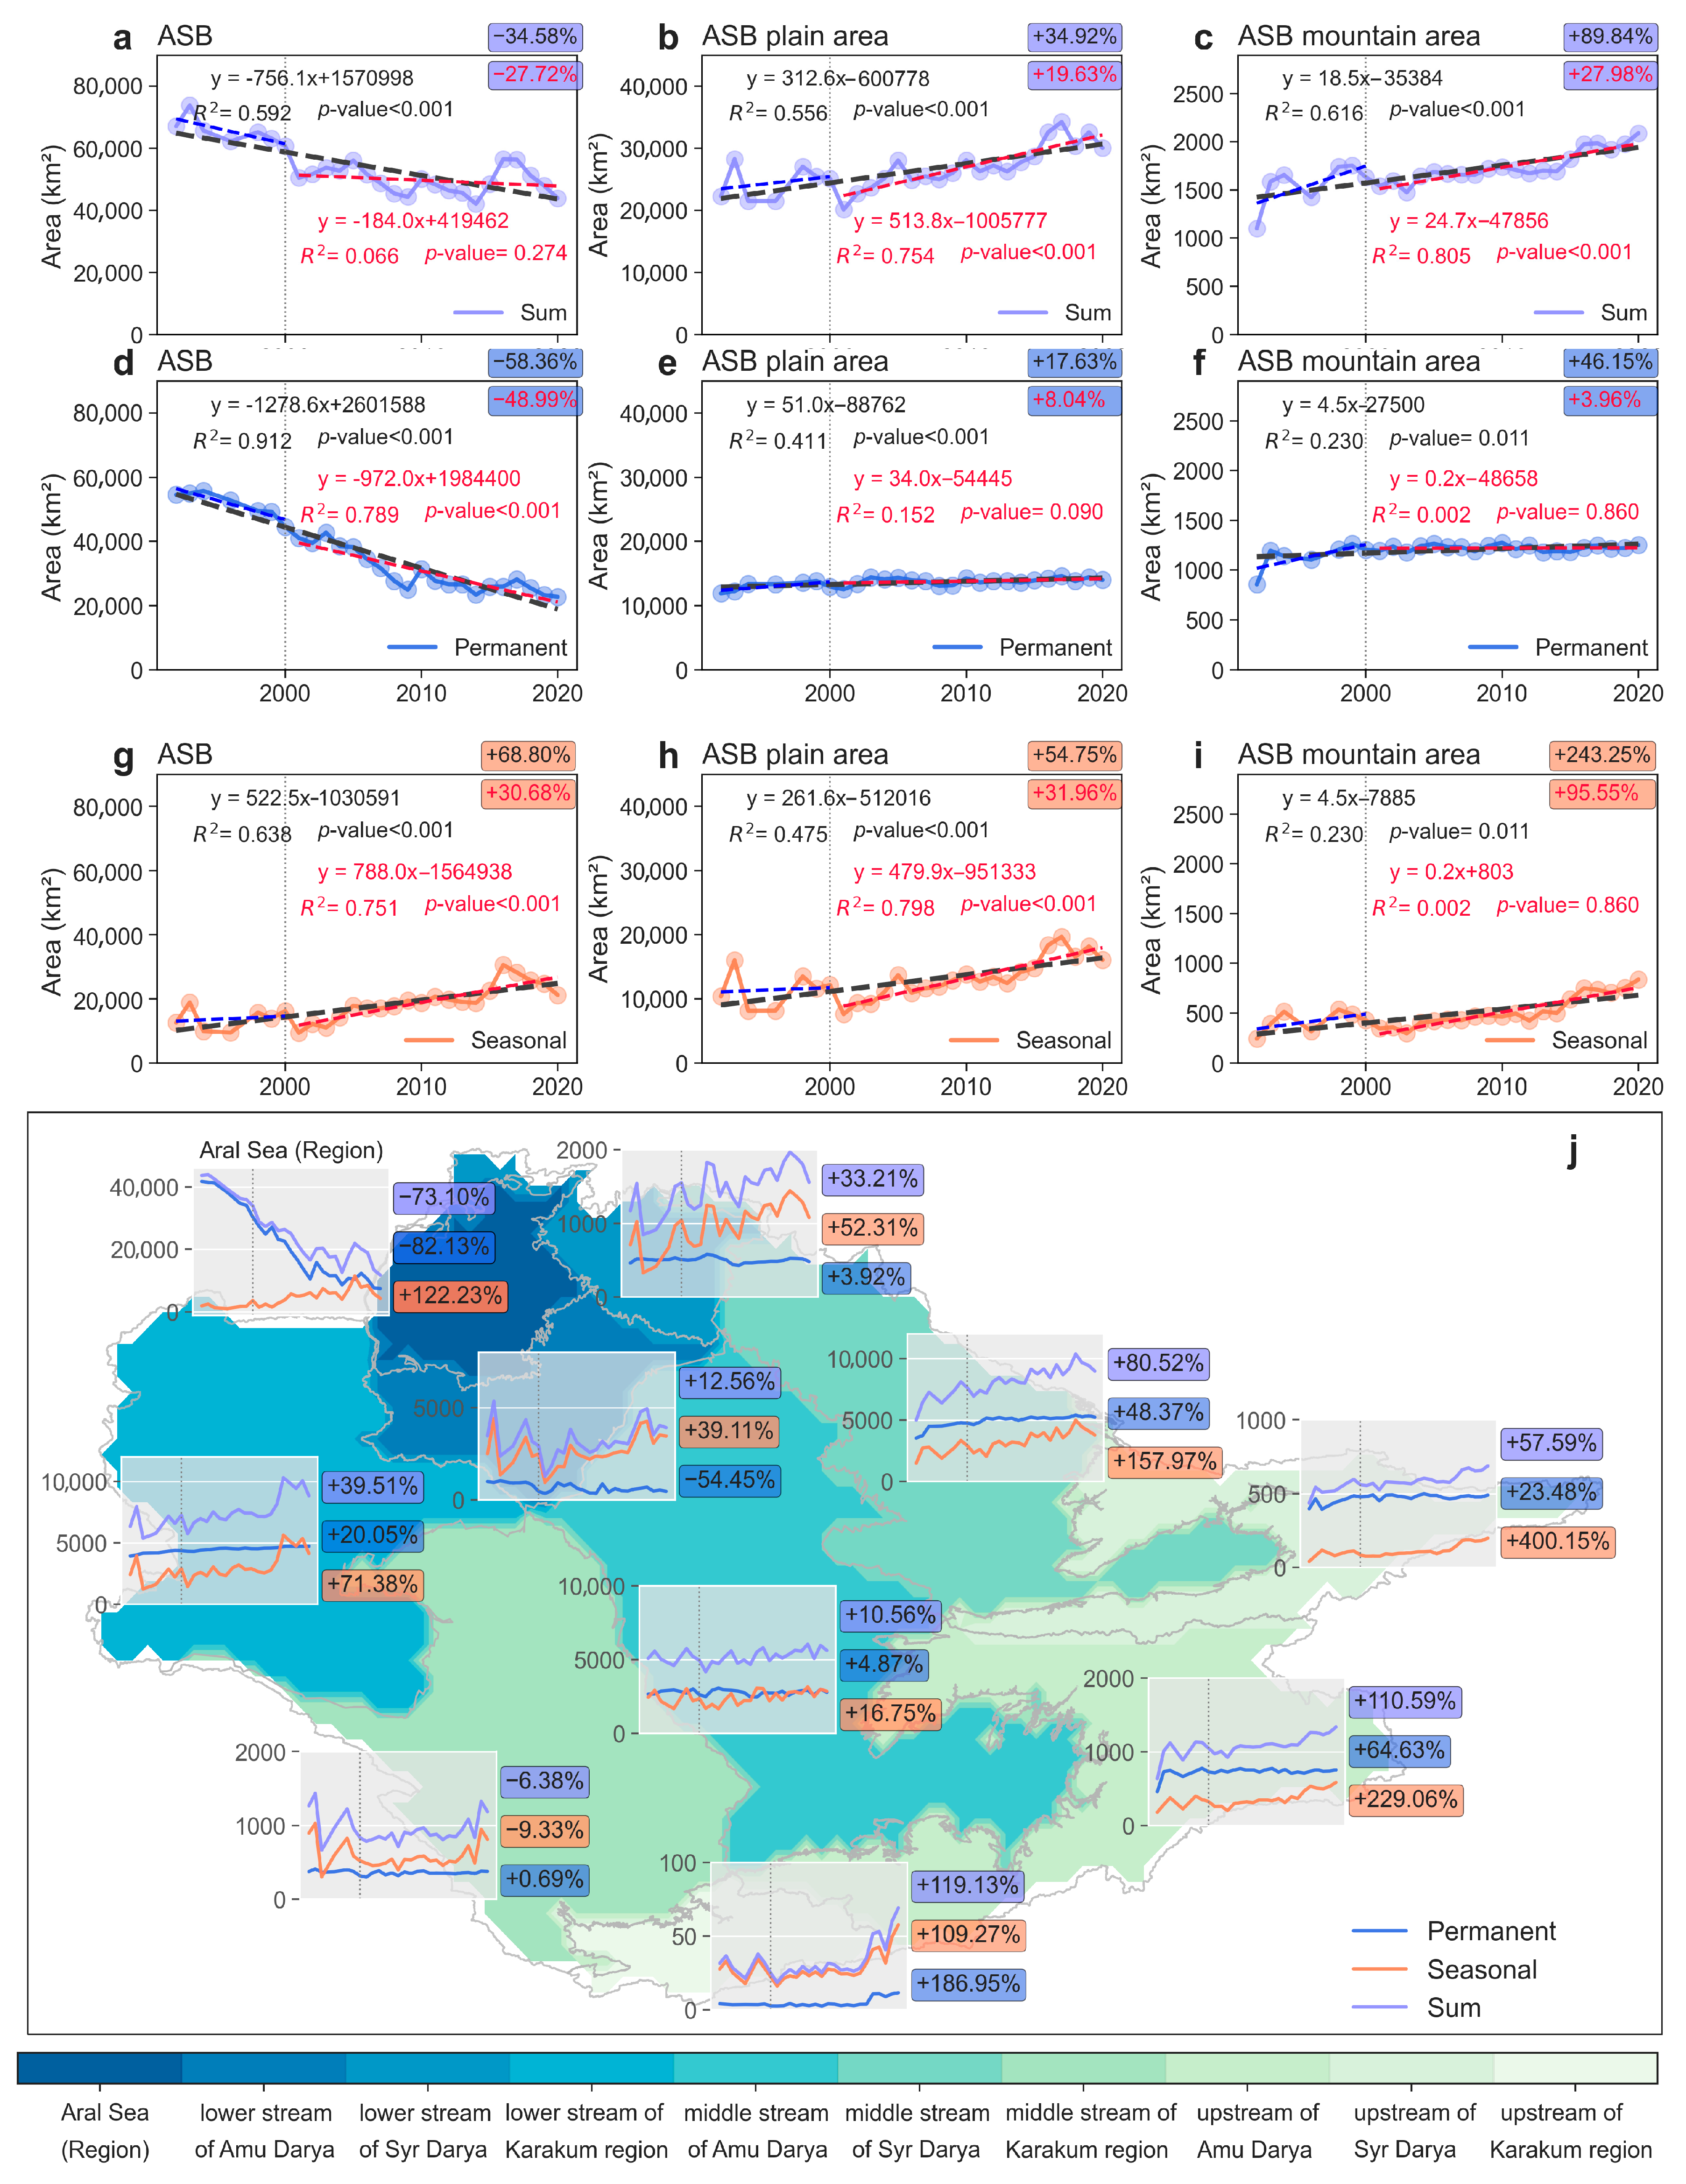
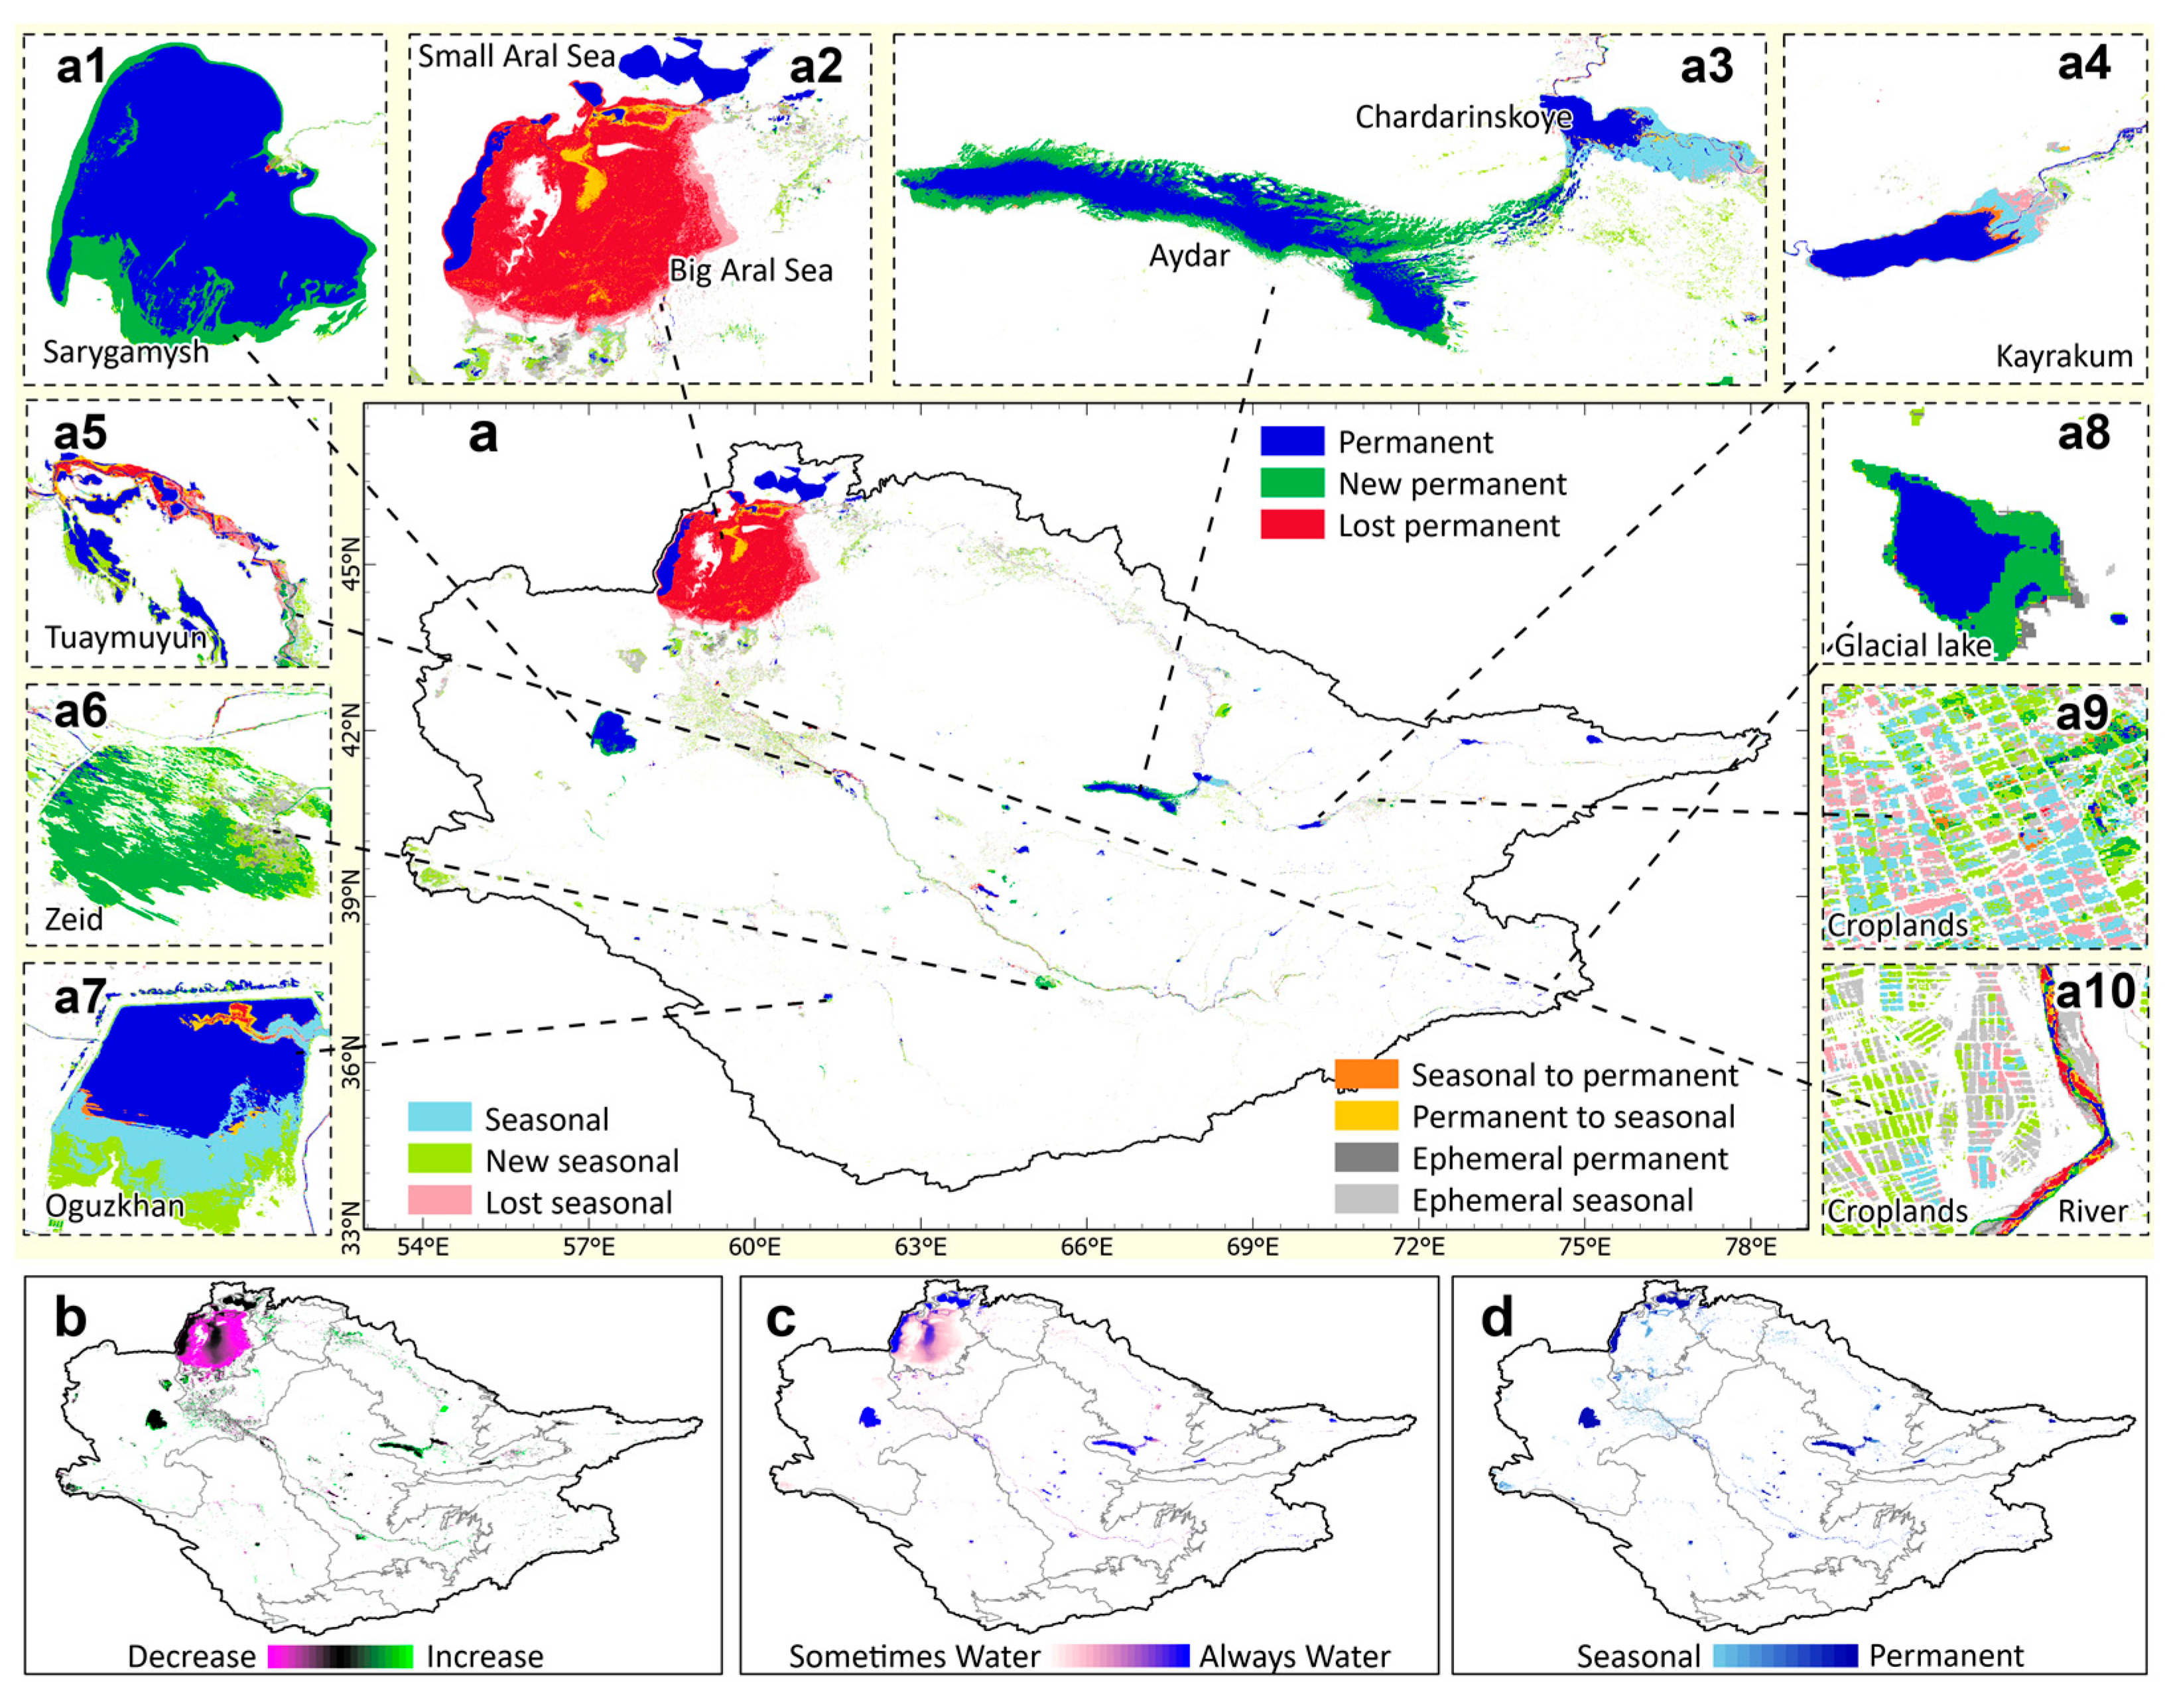
3.1. Spatiotemporal Distribution Change of Surface Water (All Water Pixels)
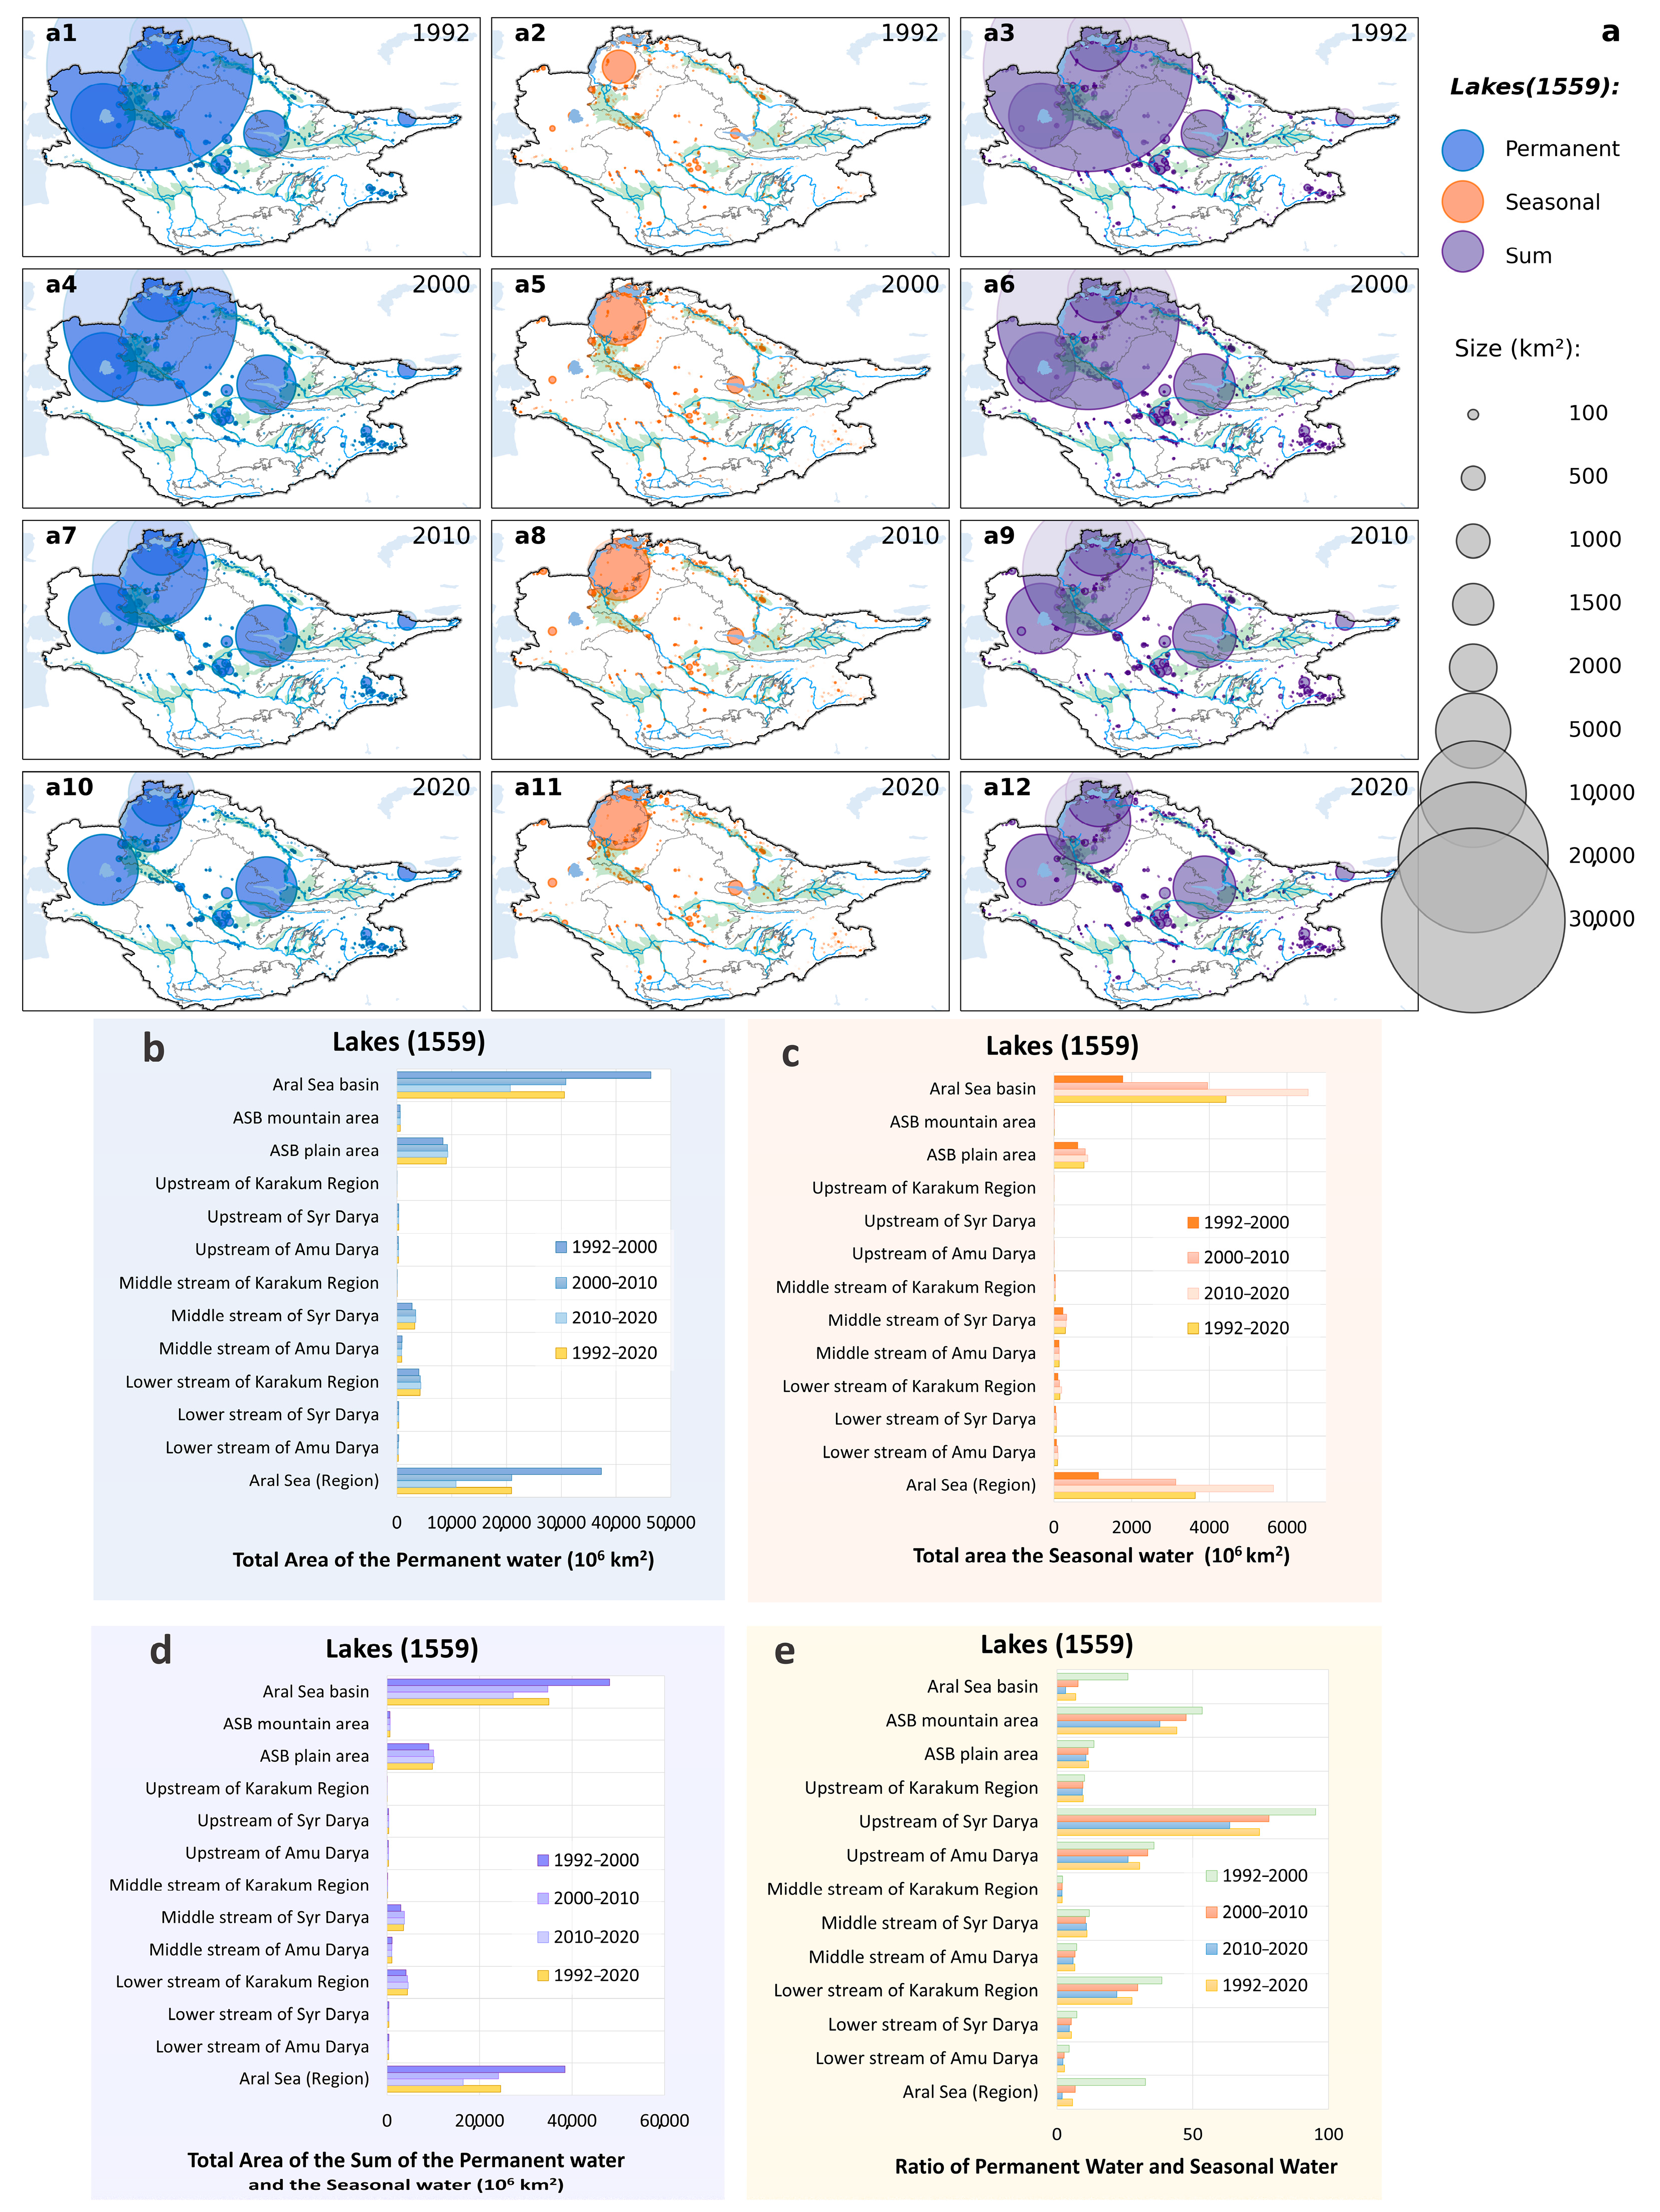
3.2. Changes in Lakes
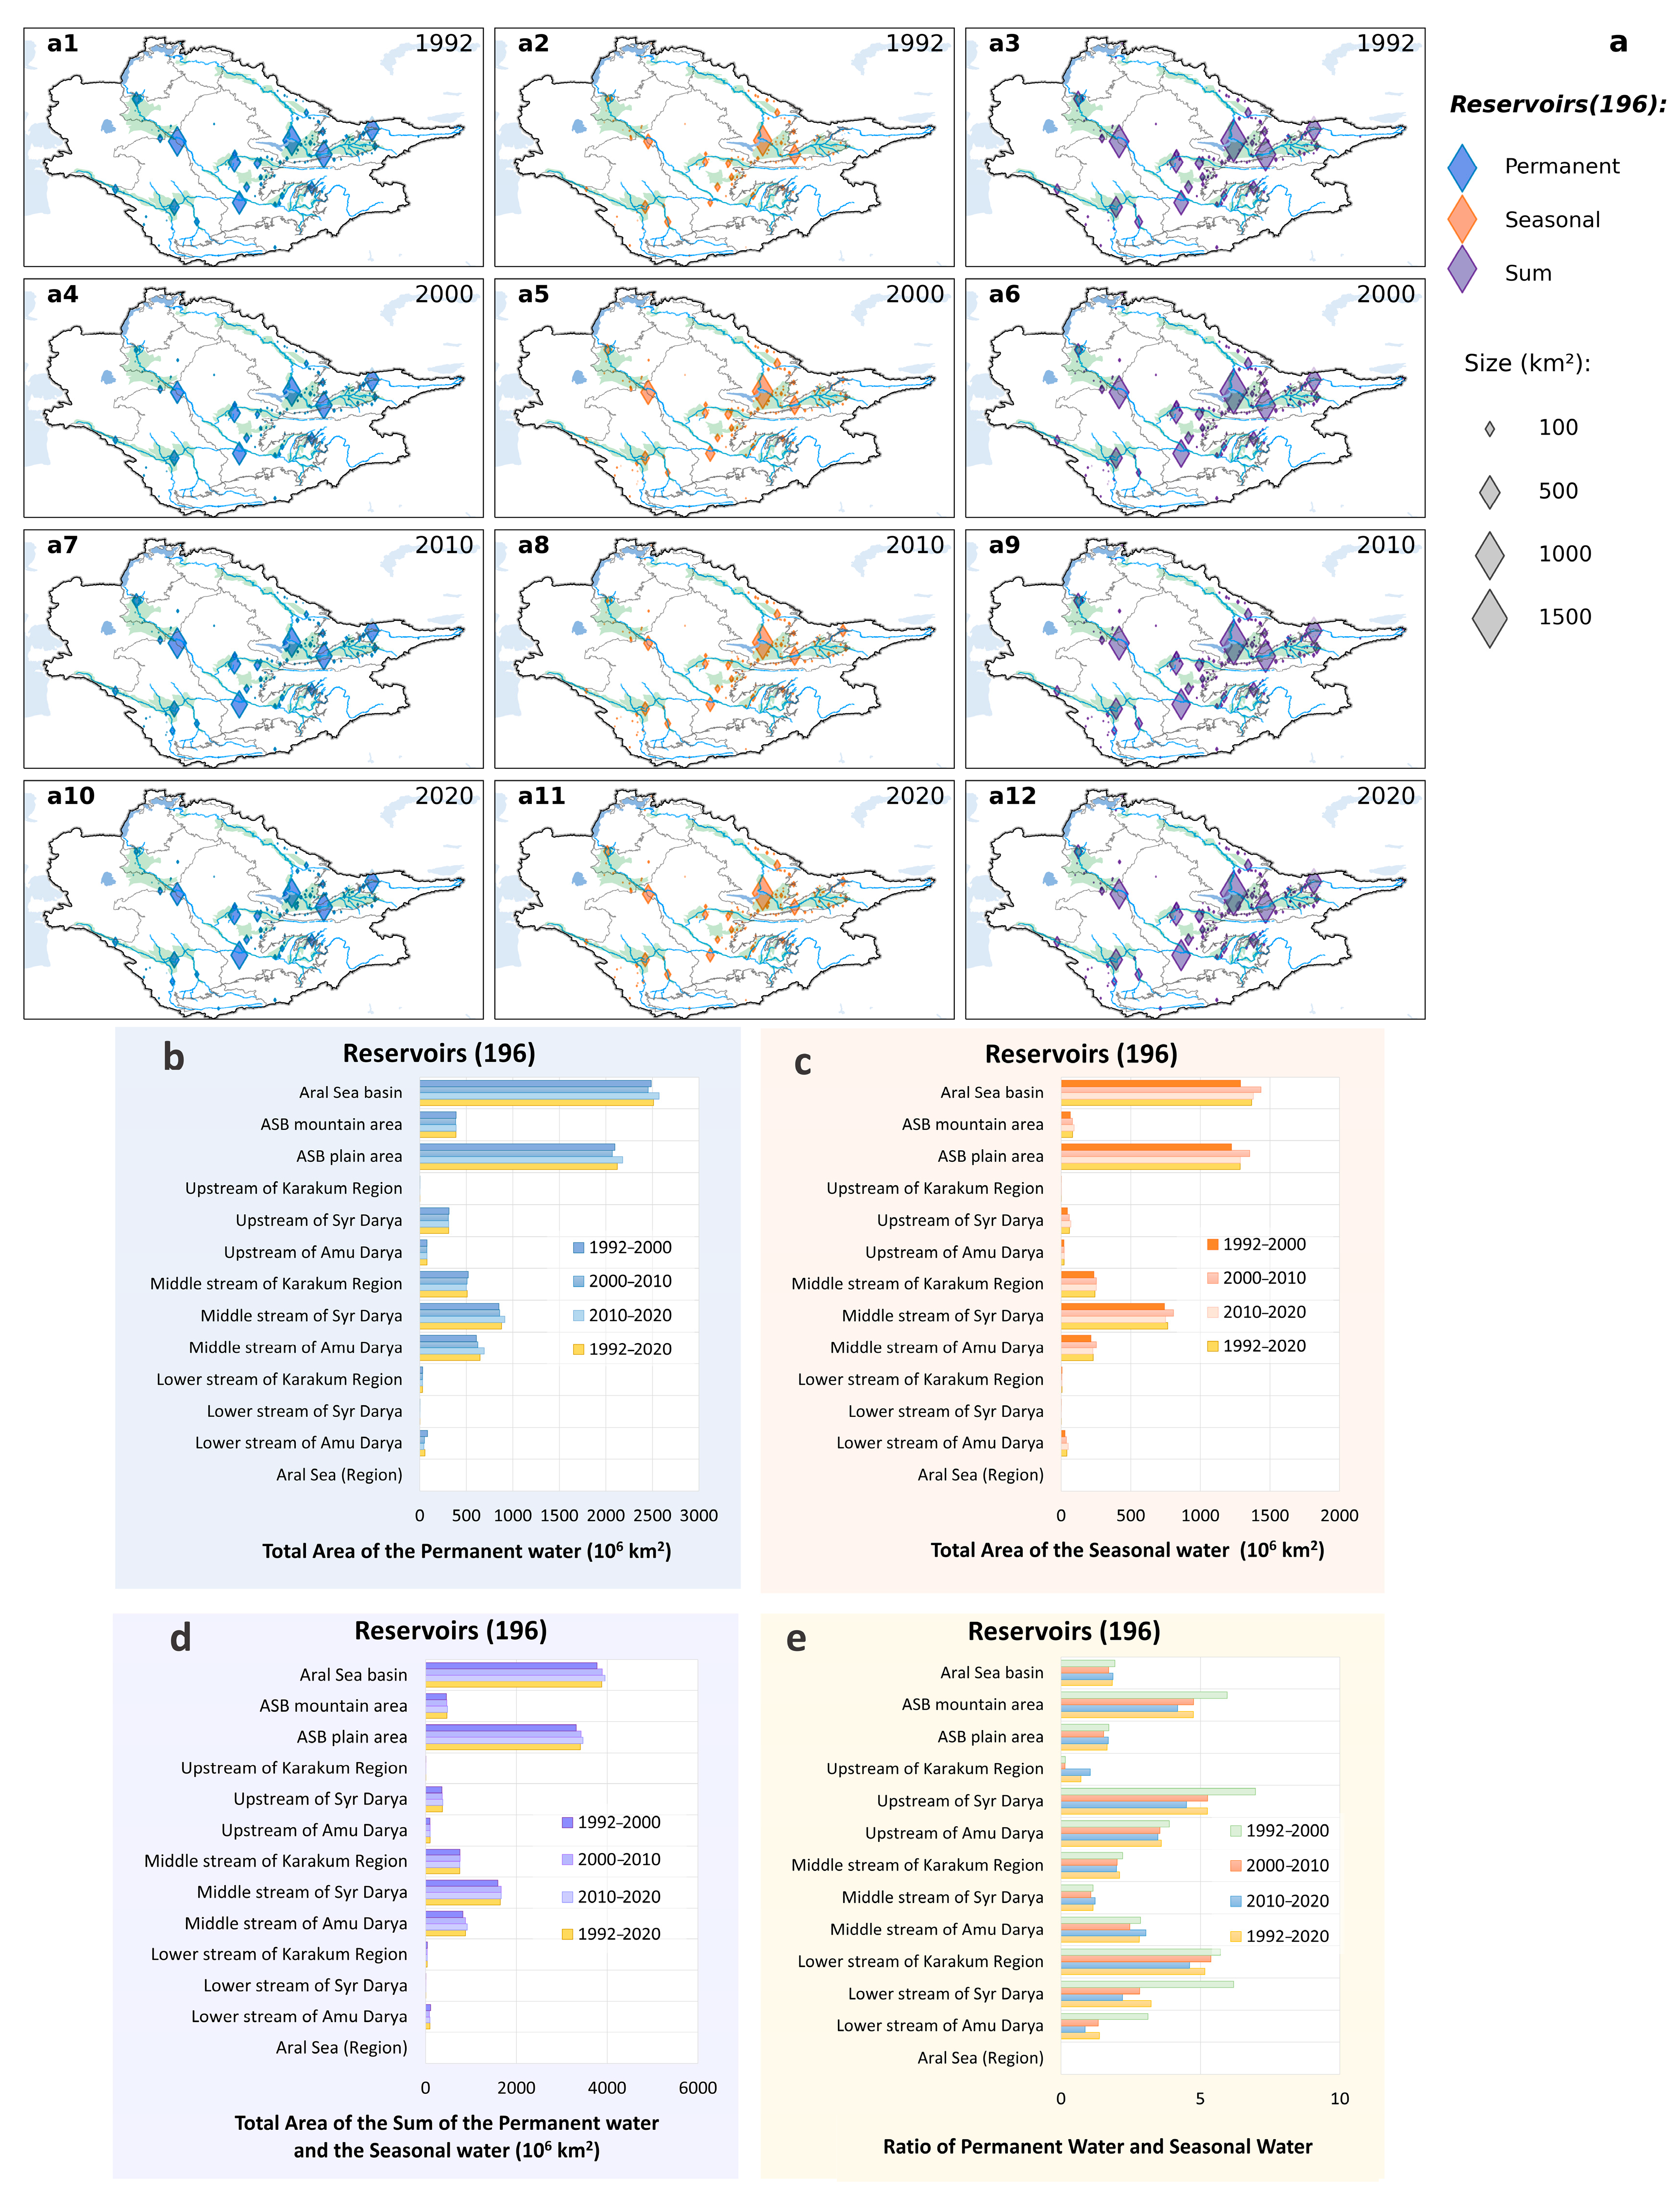
3.3. Changes in Reservoirs

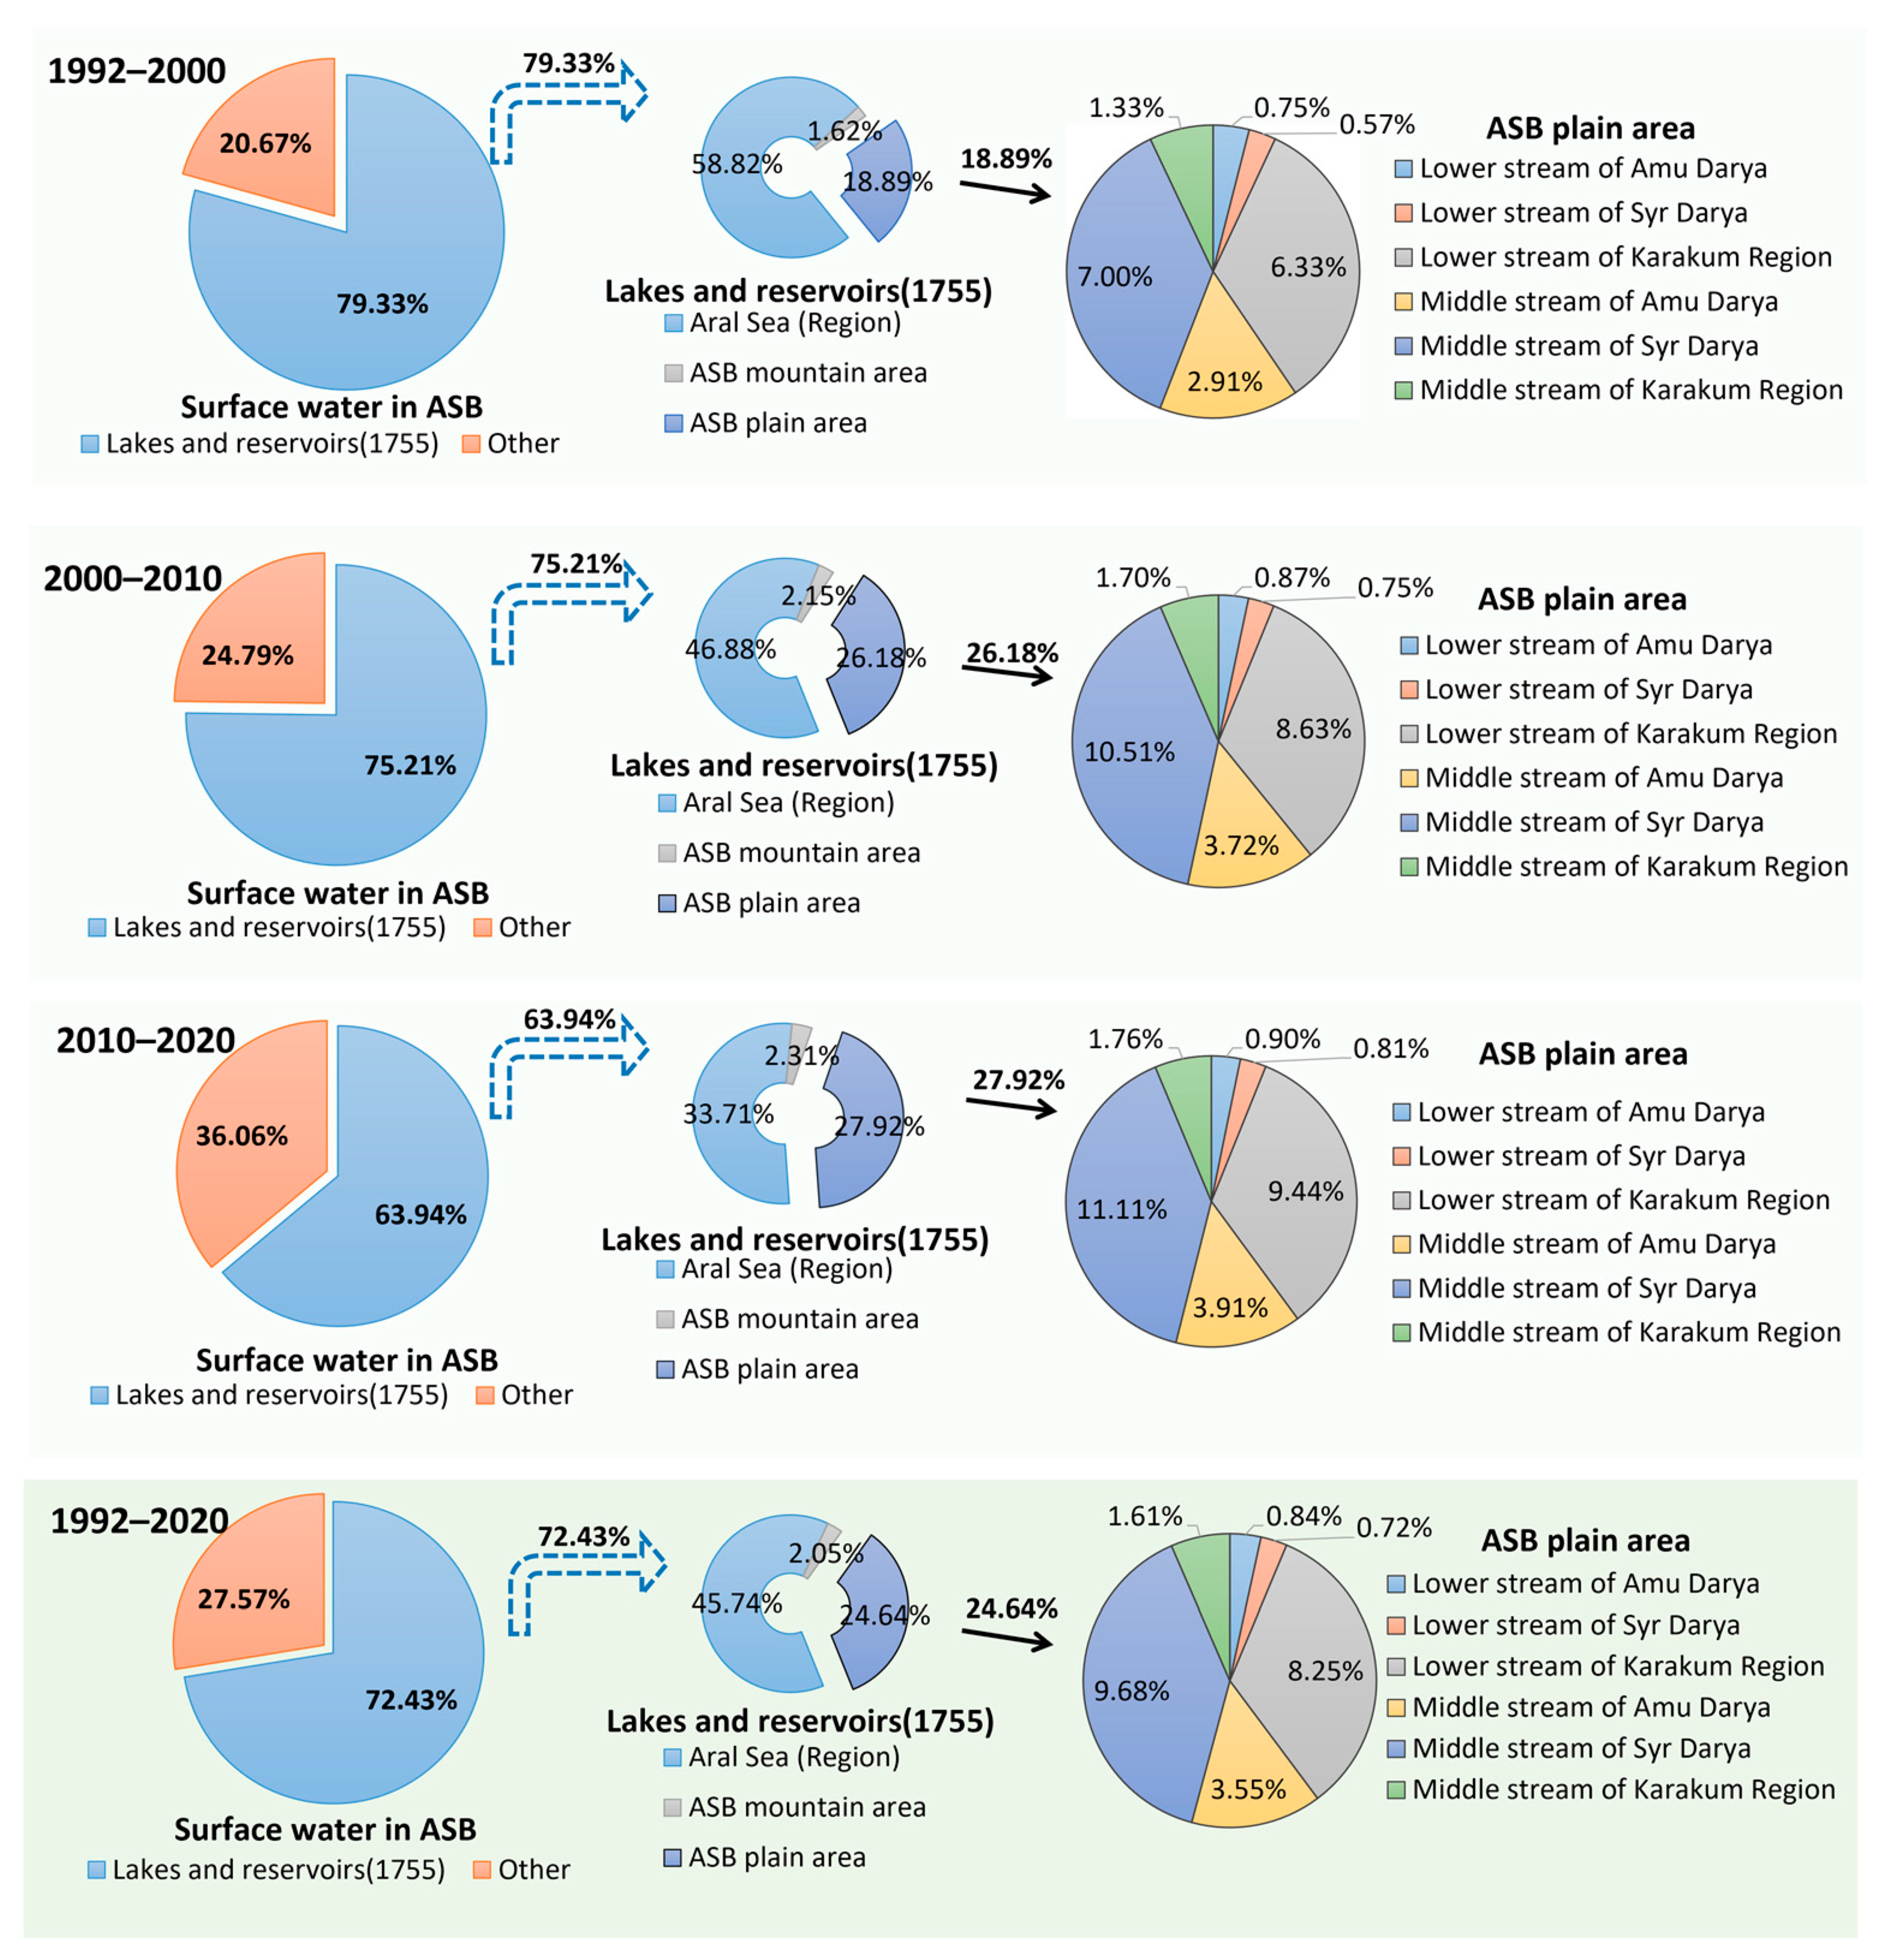
3.4. Surface Water Structure in ASB
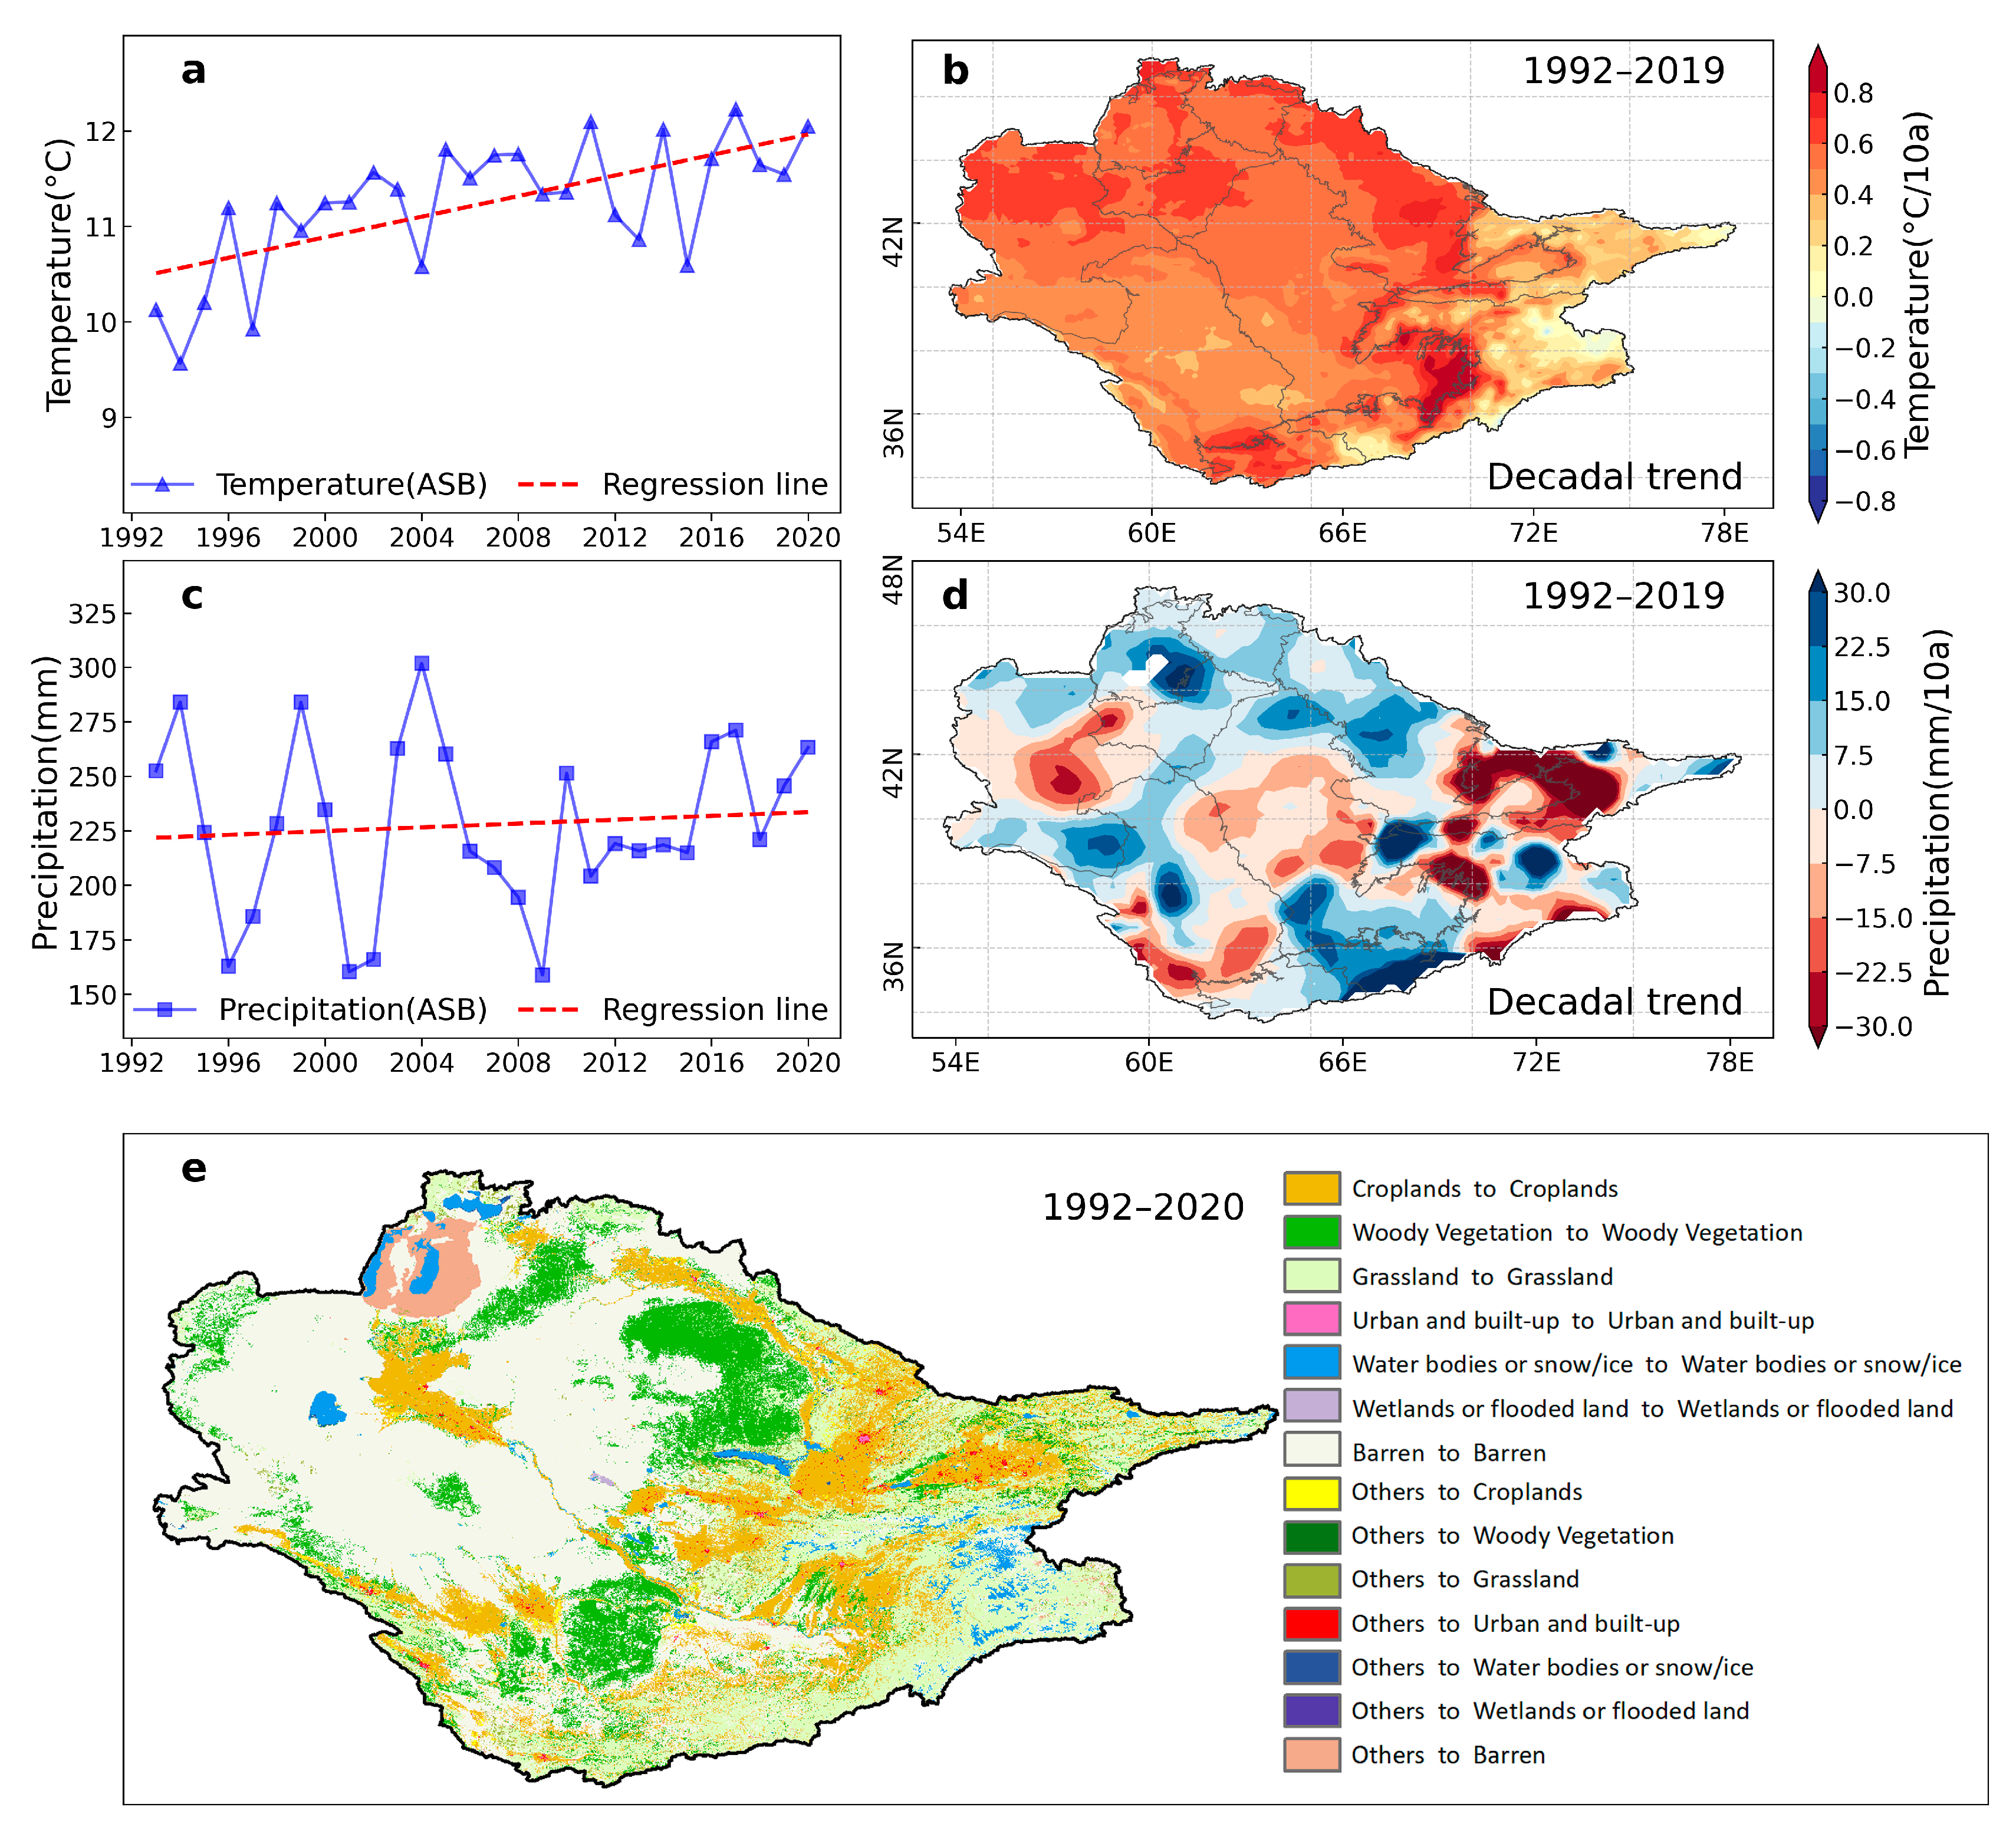
3.5. Climate Change and LCLU Change in ASB
4. Discussion
4.1. Variation Characteristics of Lake and Reservoirs
4.2. Variation Characteristics of Surface Water Area
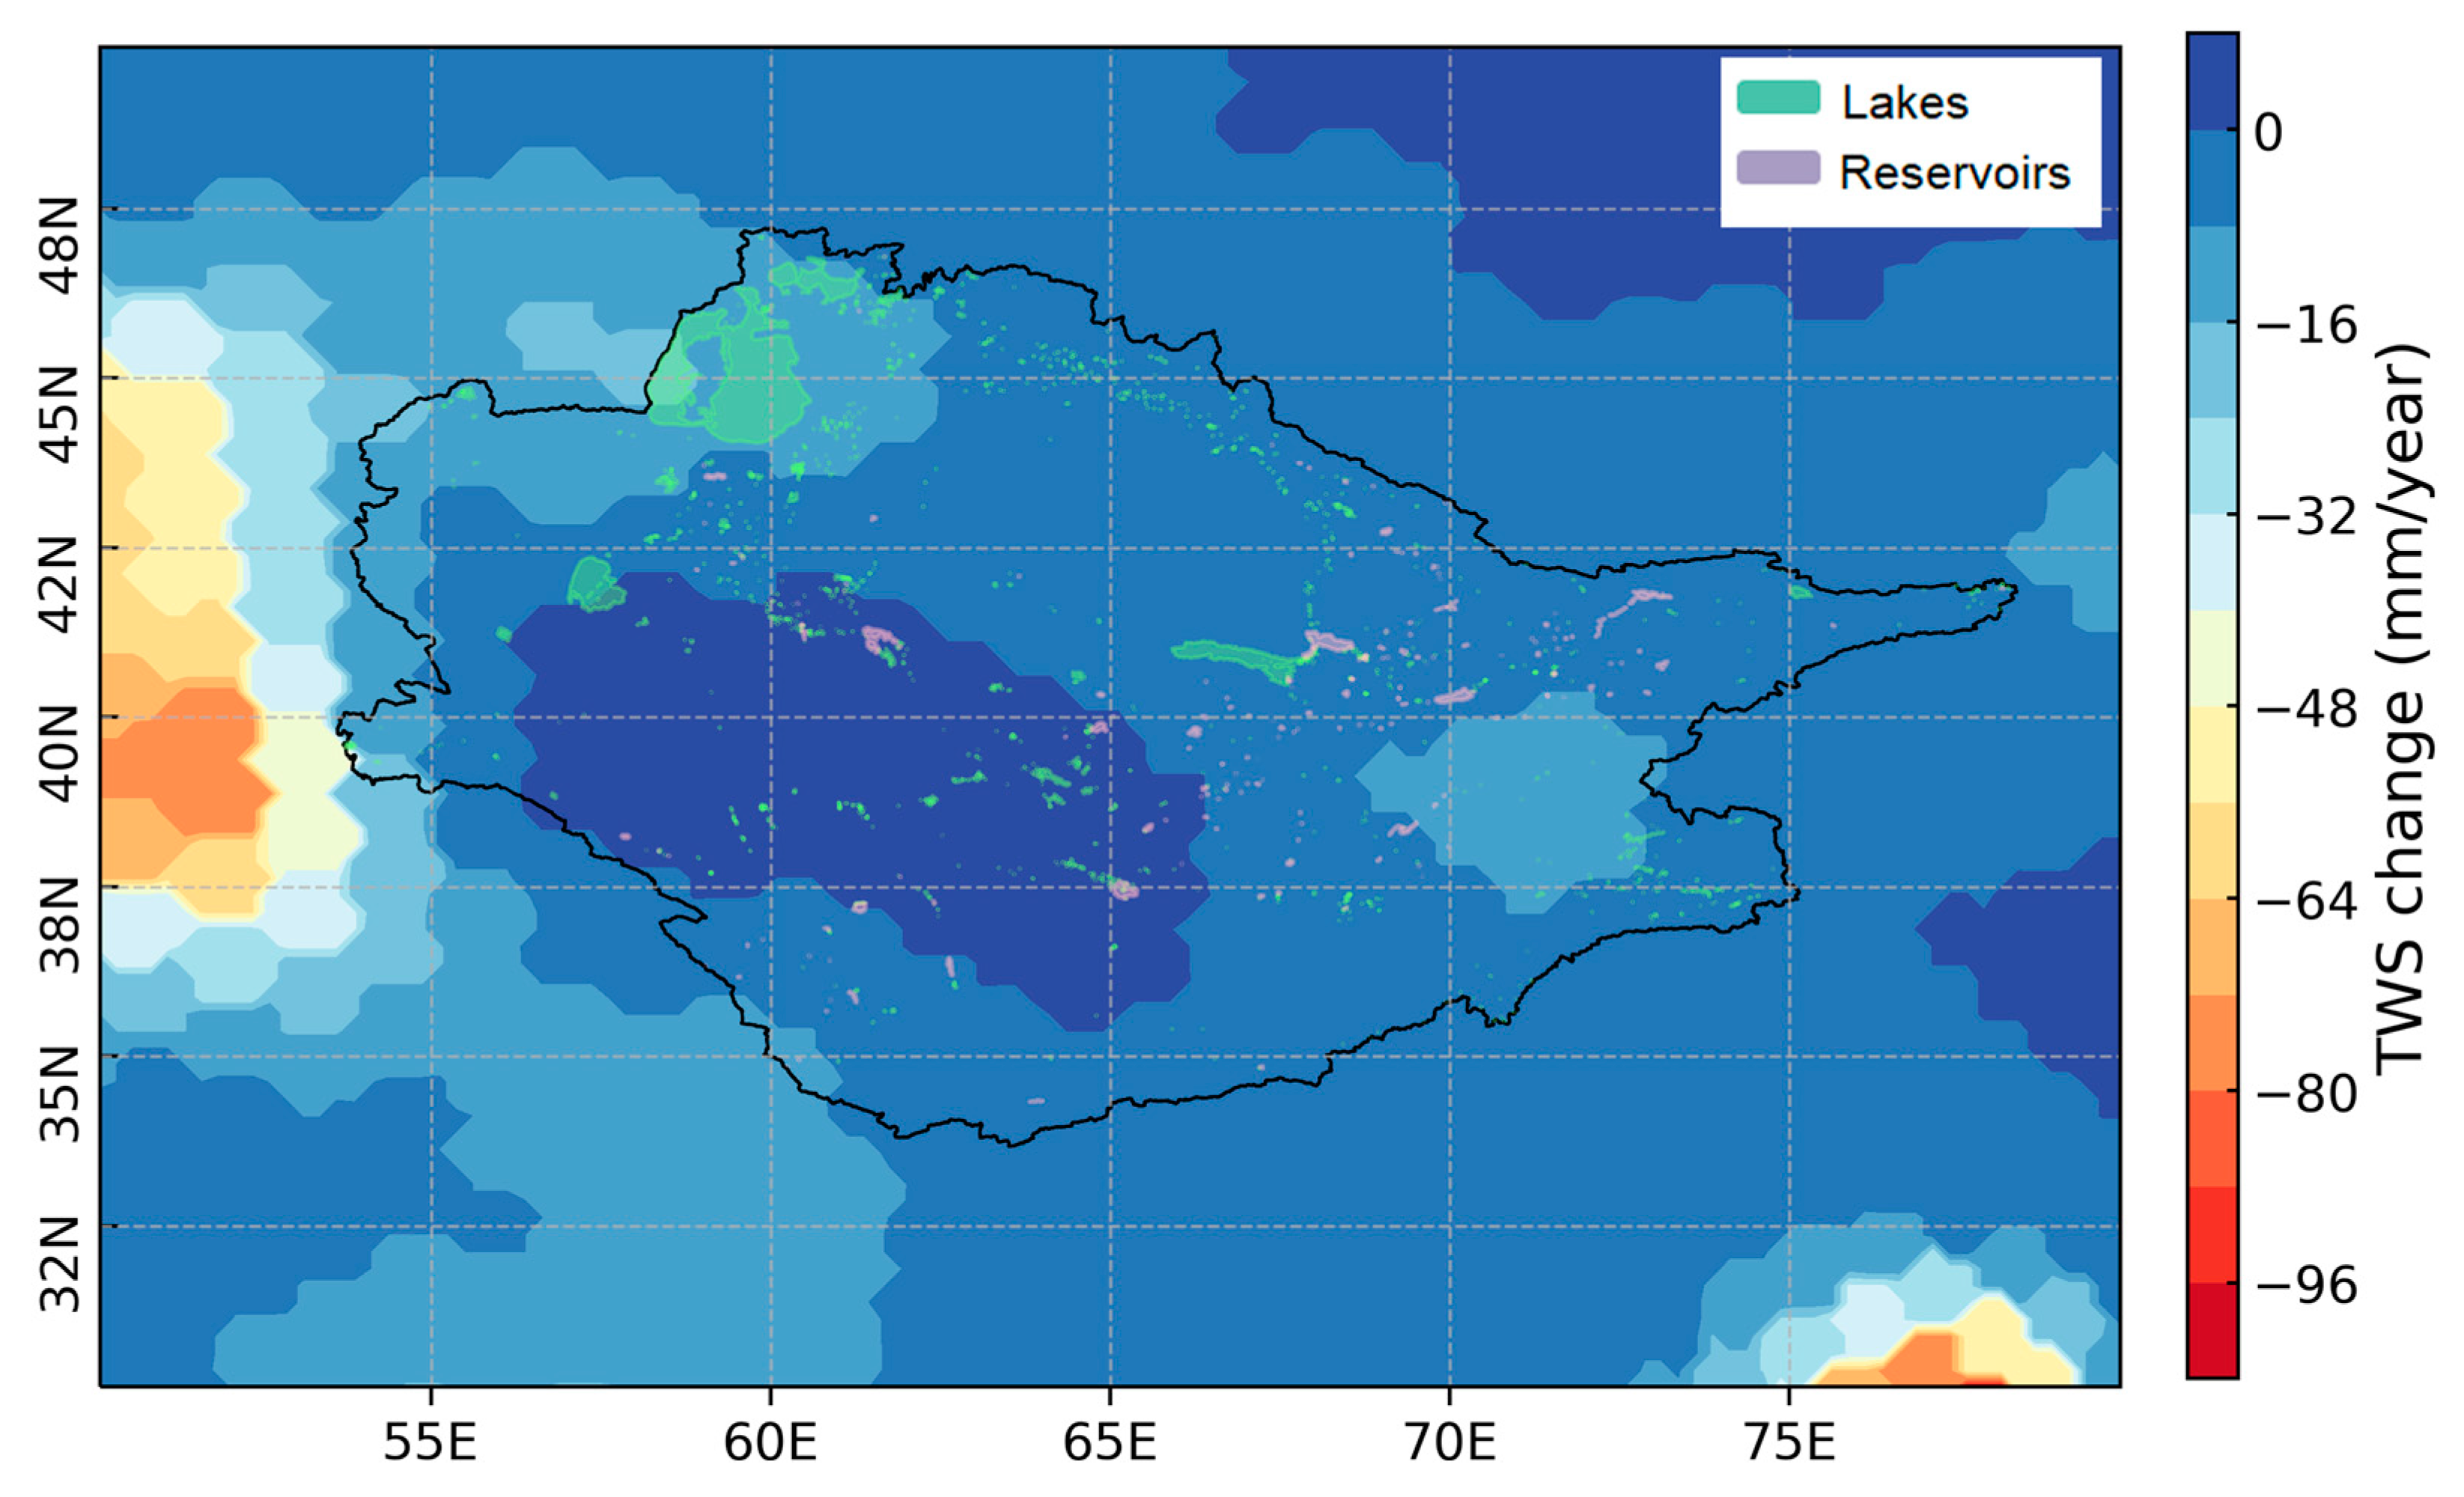
4.3. Effects on the Water Balance
4.4. Comparison of Our Surface Water Inventory with Previous Studies
5. Conclusions
Author Contributions
Funding
Data Availability Statement
Conflicts of Interest
References
- Yu, B.; Cui, B.; Zang, Y.; Wu, C.; Zhao, Z.; Wang, Y. Long-Term Dynamics of Different Surface Water Body Types and Their Possible Driving Factors in China. Remote Sens. 2021, 13, 1154. [Google Scholar] [CrossRef]
- Chen, T.; Song, C.; Ke, L.; Wang, J.; Liu, K.; Wu, Q. Estimating seasonal water budgets in global lakes by using multi-source remote sensing measurements. J. Hydrol. 2021, 593, 125781. [Google Scholar] [CrossRef]
- Palmer, S.C.J.; Kutser, T.; Hunter, P.D. Remote sensing of inland waters: Challenges, progress and future directions. Remote Sens. Environ. 2015, 157, 1–8. [Google Scholar] [CrossRef] [Green Version]
- Donchyts, G.; Baart, F.; Winsemius, H.; Gorelick, N.; Kwadijk, J.; van de Giesen, N. Earth’s surface water change over the past 30 years. Nat. Clim. Change 2016, 6, 810–813. [Google Scholar] [CrossRef]
- Micklin, P. Desiccation of the Aral Sea: A Water Management Disaster in the Soviet Union. Science 1988, 241, 1170–1176. [Google Scholar] [CrossRef] [Green Version]
- Wang, Y.; Ma, J.; Xiao, X.; Wang, X.; Dai, S.; Zhao, B. Long-Term Dynamic of Poyang Lake Surface Water: A Mapping Work Based on the Google Earth Engine Cloud Platform. Remote Sens. 2019, 11, 313. [Google Scholar] [CrossRef] [Green Version]
- Li, J.; Sheng, Y. An automated scheme for glacial lake dynamics mapping using Landsat imagery and digital elevation models: A case study in the Himalayas. Int. J. Remote Sens. 2012, 33, 5194–5213. [Google Scholar] [CrossRef]
- Lawford, R.; Strauch, A.; Toll, D.; Fekete, B.; Cripe, D. Earth observations for global water security. Curr. Opin. Env. Sust. 2013, 5, 633–643. [Google Scholar] [CrossRef] [Green Version]
- Tortini, R.; Noujdina, N.; Yeo, S.; Ricko, M.; Lettenmaier, D.P. Satellite-based remote sensing data set of global surface water storage change from 1992 to 2018. Earth Syst. Sci. Data 2020, 12, 1141–1151. [Google Scholar] [CrossRef]
- Donchyts, G.; Schellekens, J.; Winsemius, H.; Eisemann, E.; van de Giesen, N. A 30 m Resolution Surface Water Mask Including Estimation of Positional and Thematic Differences Using Landsat 8, SRTM and OpenStreetMap: A Case Study in the Murray-Darling Basin, Australia. Remote Sens. 2016, 8, 386. [Google Scholar] [CrossRef] [Green Version]
- Avisse, N.; Tilmant, A.; Müller, M.F.; Zhang, H. Monitoring small reservoirs’ storage with satellite remote sensing in inaccessible areas. Hydrol. Earth Syst. Sci. 2017, 21, 6445–6459. [Google Scholar] [CrossRef] [Green Version]
- Papa, F.; Crétaux, J.; Grippa, M.; Robert, E.; Trigg, M.; Tshimanga, R.M.; Kitambo, B.; Paris, A.; Carr, A.; Fleischmann, A.S.; et al. Water Resources in Africa under Global Change: Monitoring Surface Waters from Space. Surv. Geophys. 2023, 44, 43–93. [Google Scholar] [CrossRef] [PubMed]
- Lehner, B.; Döll, P. Development and validation of a global database of lakes, reservoirs and wetlands. J. Hydrol. 2004, 296, 1–22. [Google Scholar] [CrossRef]
- Hayes, N.M.; Deemer, B.R.; Corman, J.R.; Razavi, N.R.; Strock, K.E. Key differences between lakes and reservoirs modify climate signals: A case for a new conceptual model. Limnol. Oceanogr. Lett. 2017, 2, 47–62. [Google Scholar] [CrossRef]
- Mulligan, M.; van Soesbergen, A.; Sáenz, L. GOODD, a global dataset of more than 38,000 georeferenced dams. Sci. Data 2020, 7, 31. [Google Scholar] [CrossRef] [PubMed] [Green Version]
- Lehner, B.; Liermann, C.R.; Revenga, C.; Vörösmarty, C.; Fekete, B.; Crouzet, P.; Döll, P.; Endejan, M.; Frenken, K.; Magome, J.; et al. High-resolution mapping of the world’s reservoirs and dams for sustainable river-flow management. Front. Ecol. Environ. 2011, 9, 494–502. [Google Scholar] [CrossRef] [Green Version]
- Downing, J.; Prairie, Y.; Cole, J.; Duarte, C.; Tranvik, L.; Striegl, R.; McDowell, W.; Kortelainen, P.; Caraco, N.F.; Melack, J.M.; et al. The Global Abundance and Size Distribution of Lakes, Ponds, and Impoundments. Limnol. Oceanogr. 2006, 51, 2388–2397. [Google Scholar] [CrossRef] [Green Version]
- Leonard, J.; Crouzet, P.; European, E.A. Lakes and Reservoirs in the EEA Area; Office for Official Publications of the European Communities: Luxembourg, 1999. [Google Scholar]
- Messager, M.L.; Lehner, B.; Grill, G.; Nedeva, I.; Schmitt, O. Estimating the volume and age of water stored in global lakes using a geo-statistical approach. Nat. Commun. 2016, 7, 13603. [Google Scholar] [CrossRef] [PubMed]
- Khandelwal, A.; Karpatne, A.; Ravirathinam, P.; Ghosh, R.; Wei, Z.; Dugan, H.A.; Hanson, P.C.; Kumar, V. ReaLSAT, a global dataset of reservoir and lake surface area variations. Sci. Data 2022, 9, 356. [Google Scholar] [CrossRef]
- Pekel, J.; Cottam, A.; Gorelick, N.; Belward, A.S. High-resolution mapping of global surface water and its long-term changes. Nature 2016, 540, 418–422. [Google Scholar] [CrossRef]
- Huang, Z.; Xu, J.; Zheng, L. Long-Term Change of Lake Water Storage and Its Response to Climate Change for Typical Lakes in Arid Xinjiang, China. Water 2023, 15, 1444. [Google Scholar] [CrossRef]
- Li, Y.; Yang, W.; Li, J.; Zhang, Z.; Meng, L. A Novel Method for Mapping Lake Bottom Topography Using the GSW Dataset and Measured Water Level. Remote Sens. 2022, 14, 1423. [Google Scholar] [CrossRef]
- Van Vliet, J. Direct and indirect loss of natural area from urban expansion. Nat. Sustain. 2019, 2, 755–763. [Google Scholar] [CrossRef]
- Ganguly, S.; Friedl, M.A.; Tan, B.; Zhang, X.; Verma, M. Land surface phenology from MODIS: Characterization of the Collection 5 global land cover dynamics product. Remote Sens. Environ. 2010, 114, 1805–1816. [Google Scholar] [CrossRef] [Green Version]
- Zhang, Y.; Wang, N.; Yang, X.; Mao, Z. The Dynamic Changes of Lake Issyk-Kul from 1958 to 2020 Based on Multi-Source Satellite Data. Remote Sens. 2022, 14, 1575. [Google Scholar] [CrossRef]
- Luo, S.; Song, C.; Liu, K.; Ke, L.; Ma, R. An Effective Low-Cost Remote Sensing Approach to Reconstruct the Long-Term and Dense Time Series of Area and Storage Variations for Large Lakes. Sensors 2019, 19, 4247. [Google Scholar] [CrossRef] [Green Version]
- Conrad, C.; Kaiser, B.O.; Lamers, J.P.A. Quantifying water volumes of small lakes in the inner Aral Sea Basin, Central Asia, and their potential for reaching water and food security. Environ. Earth Sci. 2016, 75, 952. [Google Scholar] [CrossRef]
- Chen, X.; Zuo, H.; Wang, W.; Duan, J.; Chang, M.; Wang, J. Surface water and aerosol spatiotemporal dynamics and influence mechanisms over drylands. Geosci. Front. 2023, 14, 101524. [Google Scholar] [CrossRef]
- Liu, H.; Chen, Y.; Ye, Z.; Li, Y.; Zhang, Q. Recent Lake Area Changes in Central Asia. Sci. Rep. 2019, 9, 16277. [Google Scholar] [CrossRef] [Green Version]
- Klein, I.; Dietz, A.J.; Gessner, U.; Galayeva, A.; Myrzakhmetov, A.; Kuenzer, C. Evaluation of seasonal water body extents in Central Asia over the past 27 years derived from medium-resolution remote sensing data. Int. J. Appl. Earth Obs. 2014, 26, 335–349. [Google Scholar] [CrossRef]
- Zheng, G.; Bao, A.; Li, J.; Zhang, G.; Xie, H.; Guo, H.; Jiang, L.; Chen, T.; Chang, C.; Chen, W. Sustained growth of high mountain lakes in the headwaters of the Syr Darya River, Central Asia. Glob. Planet Change 2019, 176, 84–99. [Google Scholar] [CrossRef] [Green Version]
- Che, X.; Feng, M.; Sun, Q.; Sexton, J.O.; Channan, S.; Liu, J. The Decrease in Lake Numbers and Areas in Central Asia Investigated Using a Landsat-Derived Water Dataset. Remote Sens. 2021, 13, 1032. [Google Scholar] [CrossRef]
- Li, Y.; Niu, Z.; Xu, Z.; Yan, X. Construction of High Spatial-Temporal Water Body Dataset in China Based on Sentinel-1 Archives and GEE. Remote Sens. 2020, 12, 2413. [Google Scholar] [CrossRef]
- Shugar, D.H.; Burr, A.; Haritashya, U.K.; Kargel, J.S.; Watson, C.S.; Kennedy, M.C.; Bevington, A.R.; Betts, R.A.; Harrison, S.; Strattman, K. Rapid worldwide growth of glacial lakes since 1990. Nat. Clim. Change 2020, 10, 939–945. [Google Scholar] [CrossRef]
- Wang, X.; Xiao, X.; Qin, Y.; Dong, J.; Wu, J.; Li, B. Improved maps of surface water bodies, large dams, reservoirs, and lakes in China. Earth Syst. Sci. Data 2022, 14, 3757–3771. [Google Scholar] [CrossRef]
- Zonn, I.S. The Turkmen Lake Altyn Asyr and Water Resources in Turkmenistan; Springer: Berlin/Heidelberg, Germany, 2014. [Google Scholar]
- Meyer, M.F.; Labou, S.G.; Cramer, A.N.; Brousil, M.R.; Luff, B.T. The global lake area, climate, and population dataset. Sci. Data 2020, 7, 174. [Google Scholar] [CrossRef] [PubMed]
- Klein, I.; Mayr, S.; Gessner, U.; Hirner, A.; Kuenzer, C. Water and hydropower reservoirs: High temporal resolution time series derived from MODIS data to characterize seasonality and variability. Remote Sens. Environ. 2021, 253, 112207. [Google Scholar] [CrossRef]
- Shi, D.; Shi, Y.; Wu, Q. Multidimensional Assessment of Lake Water Ecosystem Services Using Remote Sensing. Remote Sens. 2021, 13, 3540. [Google Scholar] [CrossRef]
- Bratic, G.; Vavassori, A.; Brovelli, M.A. Review of High-Resolution Global Land Cover. Int. Arch. Photogramm. Remote Sens. Spatial Inf. Sci. 2021, XLIII-B4-2021, 175–182. [Google Scholar] [CrossRef]
- Miles, E.; McCarthy, M.; Dehecq, A.; Kneib, M.; Fugger, S.; Pellicciotti, F. Health and sustainability of glaciers in High Mountain Asia. Nat Commun. 2021, 12, 2868. [Google Scholar] [CrossRef]
- Bhattacharya, A.; Bolch, T.; Mukherjee, K.; King, O.; Menounos, B.; Kapitsa, V.; Neckel, N.; Yang, W.; Yao, T. High Mountain Asian glacier response to climate revealed by multi-temporal satellite observations since the 1960s. Nat. Commun. 2021, 12, 4311. [Google Scholar] [CrossRef]
- Zheng, G.; Allen, S.K.; Bao, A.; Ballesteros-Cánovas, J.A.; Huss, M.; Zhang, G.; Li, J.; Yuan, Y.; Jiang, L.; Yu, T.; et al. Increasing risk of glacial lake outburst floods from future Third Pole deglaciation. Nat. Clim. Change 2021, 11, 411–417. [Google Scholar] [CrossRef]
- Pritchard, H.D. Asia’s shrinking glaciers protect large populations from drought stress. Nature 2019, 569, 649–654. [Google Scholar] [CrossRef] [PubMed]
- Hara, S.L.O.; Hannan, T. Irrigation and Water Management in Turkmenistan: Past Systems, Present Problems and Future Scenarios. Eur. Asia Stud. 1999, 51, 21–41. [Google Scholar] [CrossRef]
- Basso, B.; Martinez-Feria, R.A.; Rill, L.; Ritchie, J.T. Contrasting long-term temperature trends reveal minor changes in projected potential evapotranspiration in the US Midwest. Nat. Commun. 2021, 12, 1476. [Google Scholar] [CrossRef] [PubMed]
- Pascolini-Campbell, M.; Reager, J.T.; Chandanpurkar, H.A.; Rodell, M. A 10 per cent increase in global land evapotranspiration from 2003 to 2019. Nature 2021, 593, 543–547. [Google Scholar] [CrossRef]
- Deng, H.; Chen, Y. Influences of recent climate change and human activities on water storage variations in Central Asia. J. Hydrol. 2017, 544, 46–57. [Google Scholar] [CrossRef]
- Conrad, C.; Usman, M.; Morper-Busch, L.; Schönbrodt-Stitt, S. Remote sensing-based assessments of land use, soil and vegetation status, crop production and water use in irrigation systems of the Aral Sea Basin. A review. Water Secur. 2020, 11, 100078. [Google Scholar] [CrossRef]
- Mahindawansha, A.; Külls, C.; Kraft, P.; Breuer, L. Investigating unproductive water losses from irrigated agricultural crops in the humid tropics through analyses of stable isotopes of water. Hydrol. Earth Syst. Sci. 2020, 24, 3627–3642. [Google Scholar] [CrossRef]
- Wang, X.; Chen, Y.; Li, Z.; Fang, G.; Wang, F.; Liu, H. The impact of climate change and human activities on the Aral Sea Basin over the past 50 years. Atmos. Res. 2020, 245, 105125. [Google Scholar] [CrossRef]
- Micklin, P. Irrigation in the Aral Sea Basin; Springer: Berlin/Heidelberg, Germany, 2014. [Google Scholar]
- Huang, S.; Chen, X.; Chang, C.; Liu, T.; Huang, Y.; Zan, C.; Ma, X.; De Maeyer, P.; Van de Voorde, T. Impacts of climate change and evapotranspiration on shrinkage of Aral Sea. Sci. Total Environ. 2022, 845, 157203. [Google Scholar] [CrossRef]
- Zhan, S.; Song, C.; Wang, J.; Sheng, Y.; Quan, J. A Global Assessment of Terrestrial Evapotranspiration Increase Due to Surface Water Area Change. Earth’s Future 2019, 7, 266–282. [Google Scholar] [CrossRef] [Green Version]
- Zmijewski, K.; Becker, R. Estimating the Effects of Anthropogenic Modification on Water Balance in the Aral Sea Watershed Using GRACE: 2003–12. Earth Interact 2014, 18, 1–16. [Google Scholar] [CrossRef]
- Liu, Z.; Huang, Y.; Liu, T.; Li, J.; Xing, W.; Akmalov, S.; Peng, J.; Pan, X.; Guo, C.; Duan, Y. Water Balance Analysis Based on a Quantitative Evapotranspiration Inversion in the Nukus Irrigation Area, Lower Amu River Basin. Remote Sens. 2020, 12, 2317. [Google Scholar] [CrossRef]
- Water Resources of the Aral Sea Basin. Available online: http://www.cawater-info.net/aral/water_e.htm (accessed on 23 April 2023).
- Water Management Situation in the Aral Sea Basin. Available online: http://www.cawater-info.net/yearbook/2020/02_yearbook2020_en.htm (accessed on 23 April 2023).
- Waltham, T.; Sholji, I. The demise of the Aral Sea—An environmental disaster. Geol. Today 2001, 17, 218–228. [Google Scholar] [CrossRef]
- Jiang, L.; Jiapaer, G.; Bao, A.; Yuan, Y.; Zheng, G.; Guo, H.; Yu, T.; De Maeyer, P. The effects of water stress on croplands in the Aral Sea basin. J. Clean Prod. 2020, 254, 120114. [Google Scholar] [CrossRef]
- Tang, H.; Lu, S.; Ali Baig, M.H.; Li, M.; Fang, C.; Wang, Y. Large-Scale Surface Water Mapping Based on Landsat and Sentinel-1 Images. Water 2022, 14, 1454. [Google Scholar] [CrossRef]
- Yang, X.; Qin, Q.; Yésou, H.; Ledauphin, T.; Koehl, M.; Grussenmeyer, P.; Zhu, Z. Monthly estimation of the surface water extent in France at a 10-m resolution using Sentinel-2 data. Remote Sens. Environ. 2020, 244, 111803. [Google Scholar] [CrossRef]
- Feng, Y.; Zhang, H.; Tao, S.; Ao, Z.; Song, C.; Chave, J.; Le Toan, T.; Xue, B.; Zhu, J.; Pan, J.; et al. Decadal Lake Volume Changes (2003–2020) and Driving Forces at a Global Scale. Remote Sens. 2022, 14, 1032. [Google Scholar] [CrossRef]
- Busker, T.; de Roo, A.; Gelati, E.; Schwatke, C.; Adamovic, M.; Bisselink, B.; Pekel, J.; Cottam, A. A global lake and reservoir volume analysis using a surface water dataset and satellite altimetry. Hydrol. Earth Syst. Sc. 2019, 23, 669–690. [Google Scholar] [CrossRef] [Green Version]


Disclaimer/Publisher’s Note: The statements, opinions and data contained in all publications are solely those of the individual author(s) and contributor(s) and not of MDPI and/or the editor(s). MDPI and/or the editor(s) disclaim responsibility for any injury to people or property resulting from any ideas, methods, instructions or products referred to in the content. |
© 2023 by the authors. Licensee MDPI, Basel, Switzerland. This article is an open access article distributed under the terms and conditions of the Creative Commons Attribution (CC BY) license (https://creativecommons.org/licenses/by/4.0/).
Share and Cite
Huang, S.; Chen, X.; Ma, X.; Fang, H.; Liu, T.; Kurban, A.; Guo, J.; De Maeyer, P.; Van de Voorde, T. Monitoring Surface Water Area Changes in the Aral Sea Basin Using the Google Earth Engine Cloud Platform. Water 2023, 15, 1729. https://doi.org/10.3390/w15091729
Huang S, Chen X, Ma X, Fang H, Liu T, Kurban A, Guo J, De Maeyer P, Van de Voorde T. Monitoring Surface Water Area Changes in the Aral Sea Basin Using the Google Earth Engine Cloud Platform. Water. 2023; 15(9):1729. https://doi.org/10.3390/w15091729
Chicago/Turabian StyleHuang, Shuangyan, Xi Chen, Xiaoting Ma, Hui Fang, Tie Liu, Alishir Kurban, Jianan Guo, Philippe De Maeyer, and Tim Van de Voorde. 2023. "Monitoring Surface Water Area Changes in the Aral Sea Basin Using the Google Earth Engine Cloud Platform" Water 15, no. 9: 1729. https://doi.org/10.3390/w15091729