
Probability-Based Rule Curves for Multi-Purpose Reservoir System in the Seine River Basin, France


1
Canadian Centre for Climate Change and Adaptation, University of Prince Edward Island, St. Peter’s Bay, PE C0A 2A0, Canada
2
School of Climate Change and Adaptation, University of Prince Edward Island, Charlottetown, PE C1A 4P3, Canada
3
Faculty of Engineering, Mahasarakham University, Kantharawichai District, Maha Sarakham 44150, Thailand
4
Sustainable Infrastructure Research and Development Center, Department of Civil Engineering, Faculty of Engineering, Khon Kaen University, Khon Kaen 40002, Thailand
5
Center for Water Resources Engineering and Environment, Faculty of Engineering, Khon Kaen University, Khon Kaen 40002, Thailand
*
Author to whom correspondence should be addressed.
Water 2023, 15(9), 1732; https://doi.org/10.3390/w15091732
Submission received: 19 January 2023
/
Revised: 25 April 2023
/
Accepted: 25 April 2023
/
Published: 30 April 2023
(This article belongs to the Section Water and Climate Change)
Abstract
:Multiple reservoir operation is of paramount importance due to tradeoffs in water supply and their cost functions. Understanding this complexity is important for optimizing water supply and increasing synergies gained from the joint operation. Therefore, this study aimed to develop a conceptual framework for addressing the effects of climate change on water security under the operating rules of the multiple reservoir system in northern France. A dynamic programming approach (DP) was employed to find the cost–benefit analysis that best fit with the objectives of reservoir operation, while the space rule was applied to balance the available space in each reservoir of a parallel system. A finite-horizon optimal regulation was then adopted for determining daily reservoir storage based on probability-based rule curves. The results indicated that the predicted inflow during the drawdown–refill cycle period to the Marne and Pannecière reservoirs would be the largest and lowest, respectively. The proposed upper rule curves during high-flow conditions suggested that the release from Aube reservoir should be postponed from July to August until September. At 50- and 100-year return periods, quite a high release rate from Seine and Marne reservoirs was observed during the dry season. A decrease in future water supply from Pannecière reservoir was found during summer, while the withdrawal in November could cause excessive water in the Seine tributary and Paris City. Under low-flow conditions in all return periods, the proposed lower rule curves recommended that the reservoir storage should go below the current operating rule, with a clear difference in July (the largest in Marne and the smallest in Pannecière) and almost no difference in November. Moreover, the web-based support system IRMaRA was developed for revising operating rules of four main reservoirs located in the Seine River Basin. The novelty of this modeling framework would contribute to the practice of deriving optimal operating rules for a multi-reservoir system by the probability-based rule curve method. Based on the evaluation of the effects of applying the estimated reservoir storage capacity under different return periods, both less overflow and water shortage represented by different levels of quantity and severity can be expected compared to the existing target storage at specified control points. Finally, the obtained finding revealed that the application of dynamic programming for reservoir optimization would help in developing a robust operating policy for tackling the effects of climate change.
1. Introduction
Climate change and rapid socioeconomic development are considered to be the major challenges for planning and managing water resources [1]. These impacts negatively alter and threaten future water demand, hydrological regimes, and security and sustainability of water resources. To ensure water availability and provide an acceptable level of service, roper reservoir operation is mandatory to fill reservoirs earlier and then to distribute the water throughout the entire river basin more effectively. However, a number of relevant factors make reservoir operation a complex and dynamic problem, including nonlinearity of system dynamics, dimensionality of state variables, stochasticity of future streamflow [2], and complex decision-making processes with multiple objectives and decision variables [3]. Through a significant amount of literature research, the optimization of reservoir operation is of great importance for scheduling based on the timing and magnitude of reservoir releases to attain optimum flood/drought preparedness and mitigation responses [4,5,6]. For dealing with the uncertainty inherent in optimization problems, Cuvelier et al. (2018) [7] compared two paradigms, i.e., robust and stochastic optimizations, in which an integrated methodology for long-term reservoir management under uncertainty was proposed. To tackle the above water challenges, such optimization techniques may differ from trial-and-error procedures guided by heuristic rules to more sophisticated ones by setting the release as a function of storage, rather than at a fixed rate. The standard operating policy (SOP) is well-known as the simplest for reservoir operation [8,9], and it is also claimed to be the most commonly used operating policy in many reservoir systems [10,11]. This is also emphasized by [12,13,14,15] for minimizing the total deficit over a time period, the SOP is the optimal operating policy that releases only when the water demand is made in each period, and no water preservation is considered for future requirements. The use of model predictive control (MPC) is also an attractive control strategy for a reservoir system analysis. This is clearly underlined by Uysal et al. [16], in which an improved joint optimization–simulation operating scheme based on the framework of model predictive control for short-term operation of a water supply reservoir for flood control purposes was proposed. As stated by [17,18], the gradient descent approach, which is a simple and popular choice, can also be used as an optimization algorithm to effectively improve computational efficiency and minimize error. There are several software packages based on the gradient descent method applied for solving optimization problems, including HEC-ResPRM, RiverWare, MODSIM, RTC-Tools, etc. In detail, Ref. [19] applied the HEC-ResPRM optimization operation model for optimizing multi-objective reservoir systems in the upper Mississippi reservoir system, as did [20], who selected the HEC-ResPRM model rather than the other optimization models, as it integrates simulation and optimization modeling and also overcomes the limitations of traditional optimization techniques. In addition, various models were also incorporated in the decision support systems (DSSs) mainly developed for basin-wide water resources planning and management, e.g., RiverWare [21,22] and MODSIM [23]. Last but not least, Ref. [24] also developed a reservoir optimization system by coupling the Modelo de Grandes Bacias Instituto de Pesquisas Hidráulicas (MGB-IPH) hydrological model, European Centre for Medium-range Weather Forecasts (ECMWF) rainfall forecasts, and the RTC-Tools (Real-Time Control Tools) software in order to suggest optimum operations of the Três Marias HPP dam. The aforementioned policy is normally used for a single reservoir that has its own reservoir storage balancing function and a bespoke operating policy is unavailable. However, it should be noted that the main drawback of this policy is large vulnerability although the volumetric reliability is high, because the policy is unable to maintain the normal operation of water during the period of shortage [1]. Another aspect to be considered is multiple reservoirs with various configurations that can operate in parallel with joint water demand and further enhance the synergy between reservoirs. In this case, the reservoir operation can be accomplished through the application of integrated operation management by minimizing unnecessary spills and increasing reservoir yield, which allows greater flexibility in controlling reservoir volumes throughout a specified time interval [25]. It was suggested by [5,25] that the total yield of a joint operation of a multi-reservoir system could exceed the accumulated yield from standalone reservoirs, due to the enhancement in benefit of each reservoir during joint operation or the so-called synergistic gain. The appropriate joint operation for reservoirs in series and in parallel for various purposes is defined as the optimal storage balancing function to ensure that the optimal allocation of limited and competing water resources is maintained, as seen from typical examples of the New York City (NYC) rule [26], space rule [27], target-priority rule [28], and parametric rule [29], etc.
Nowadays, by utilizing modeling techniques with computational capabilities, there are various heuristic programming methods applied to reservoir operation systems, including particle swarm optimization [30,31,32,33], genetic algorithm [34,35,36,37], artificial neural network [38,39,40,41], as well as other techniques, as comprehensively reviewed in [2,4,6]. However, dynamic programming (DP) is still preferable for solving reservoir operation problems, because of its ability in handling nonlinear and noncontinuous objective functions and constraints and providing the convenience of implementing its temporally sequential reservoir decision-making process [4,6,42,43]. This coincides with the works of [44,45,46], who applied DP in reservoir operation, as its structure is designed to be compatible with the stage-by-stage decision-making procedure. In this regard, one shortcoming of the dynamic programming algorithm is the fact that it can handle only a few reservoirs due to the curse of dimensionality, which causes heavy computational complexity and memory requirements [2].
In this study, the dynamic programming algorithm was applied to find the optimal joint operating rules for a parallel reservoir system in northern France. This application employed the synthetic streamflow generator approach to generate a large number of hydrological inputs, i.e., streamflow time series, based on limited historical data, for solving the optimization problems. To equalize available space in relation to releases from each of the parallel reservoirs, the space rule was employed. It is clear that under changing climate conditions, return periods, which are the inverse of exceedance probability of extreme hydrological events, are likely to alter and increase the frequency and magnitude at which the management of a multi-reservoir system will be overwhelmed. Therefore, by taking into consideration the non-exceedance probability or exceedance probability that represent the risk of shortage or spillage, respectively, probability-based rule curves were developed. The conceptual framework used in this study was constructed based on the integration of Pascal computer programming language for modeling a dynamic process that continually changes reservoir characteristics, and R language was used for statistical computations and creating a web-based application. Eventually, the optimization-based approach for joint operation of a multi-reservoir system in the Seine River Basin, France is expected to be beneficial to reservoir operators in charge of making release decisions and implementing strategies for adaptation to climate change.
2. Materials and Methods
2.1. Introducing the Case Study: Seine River Basin, France
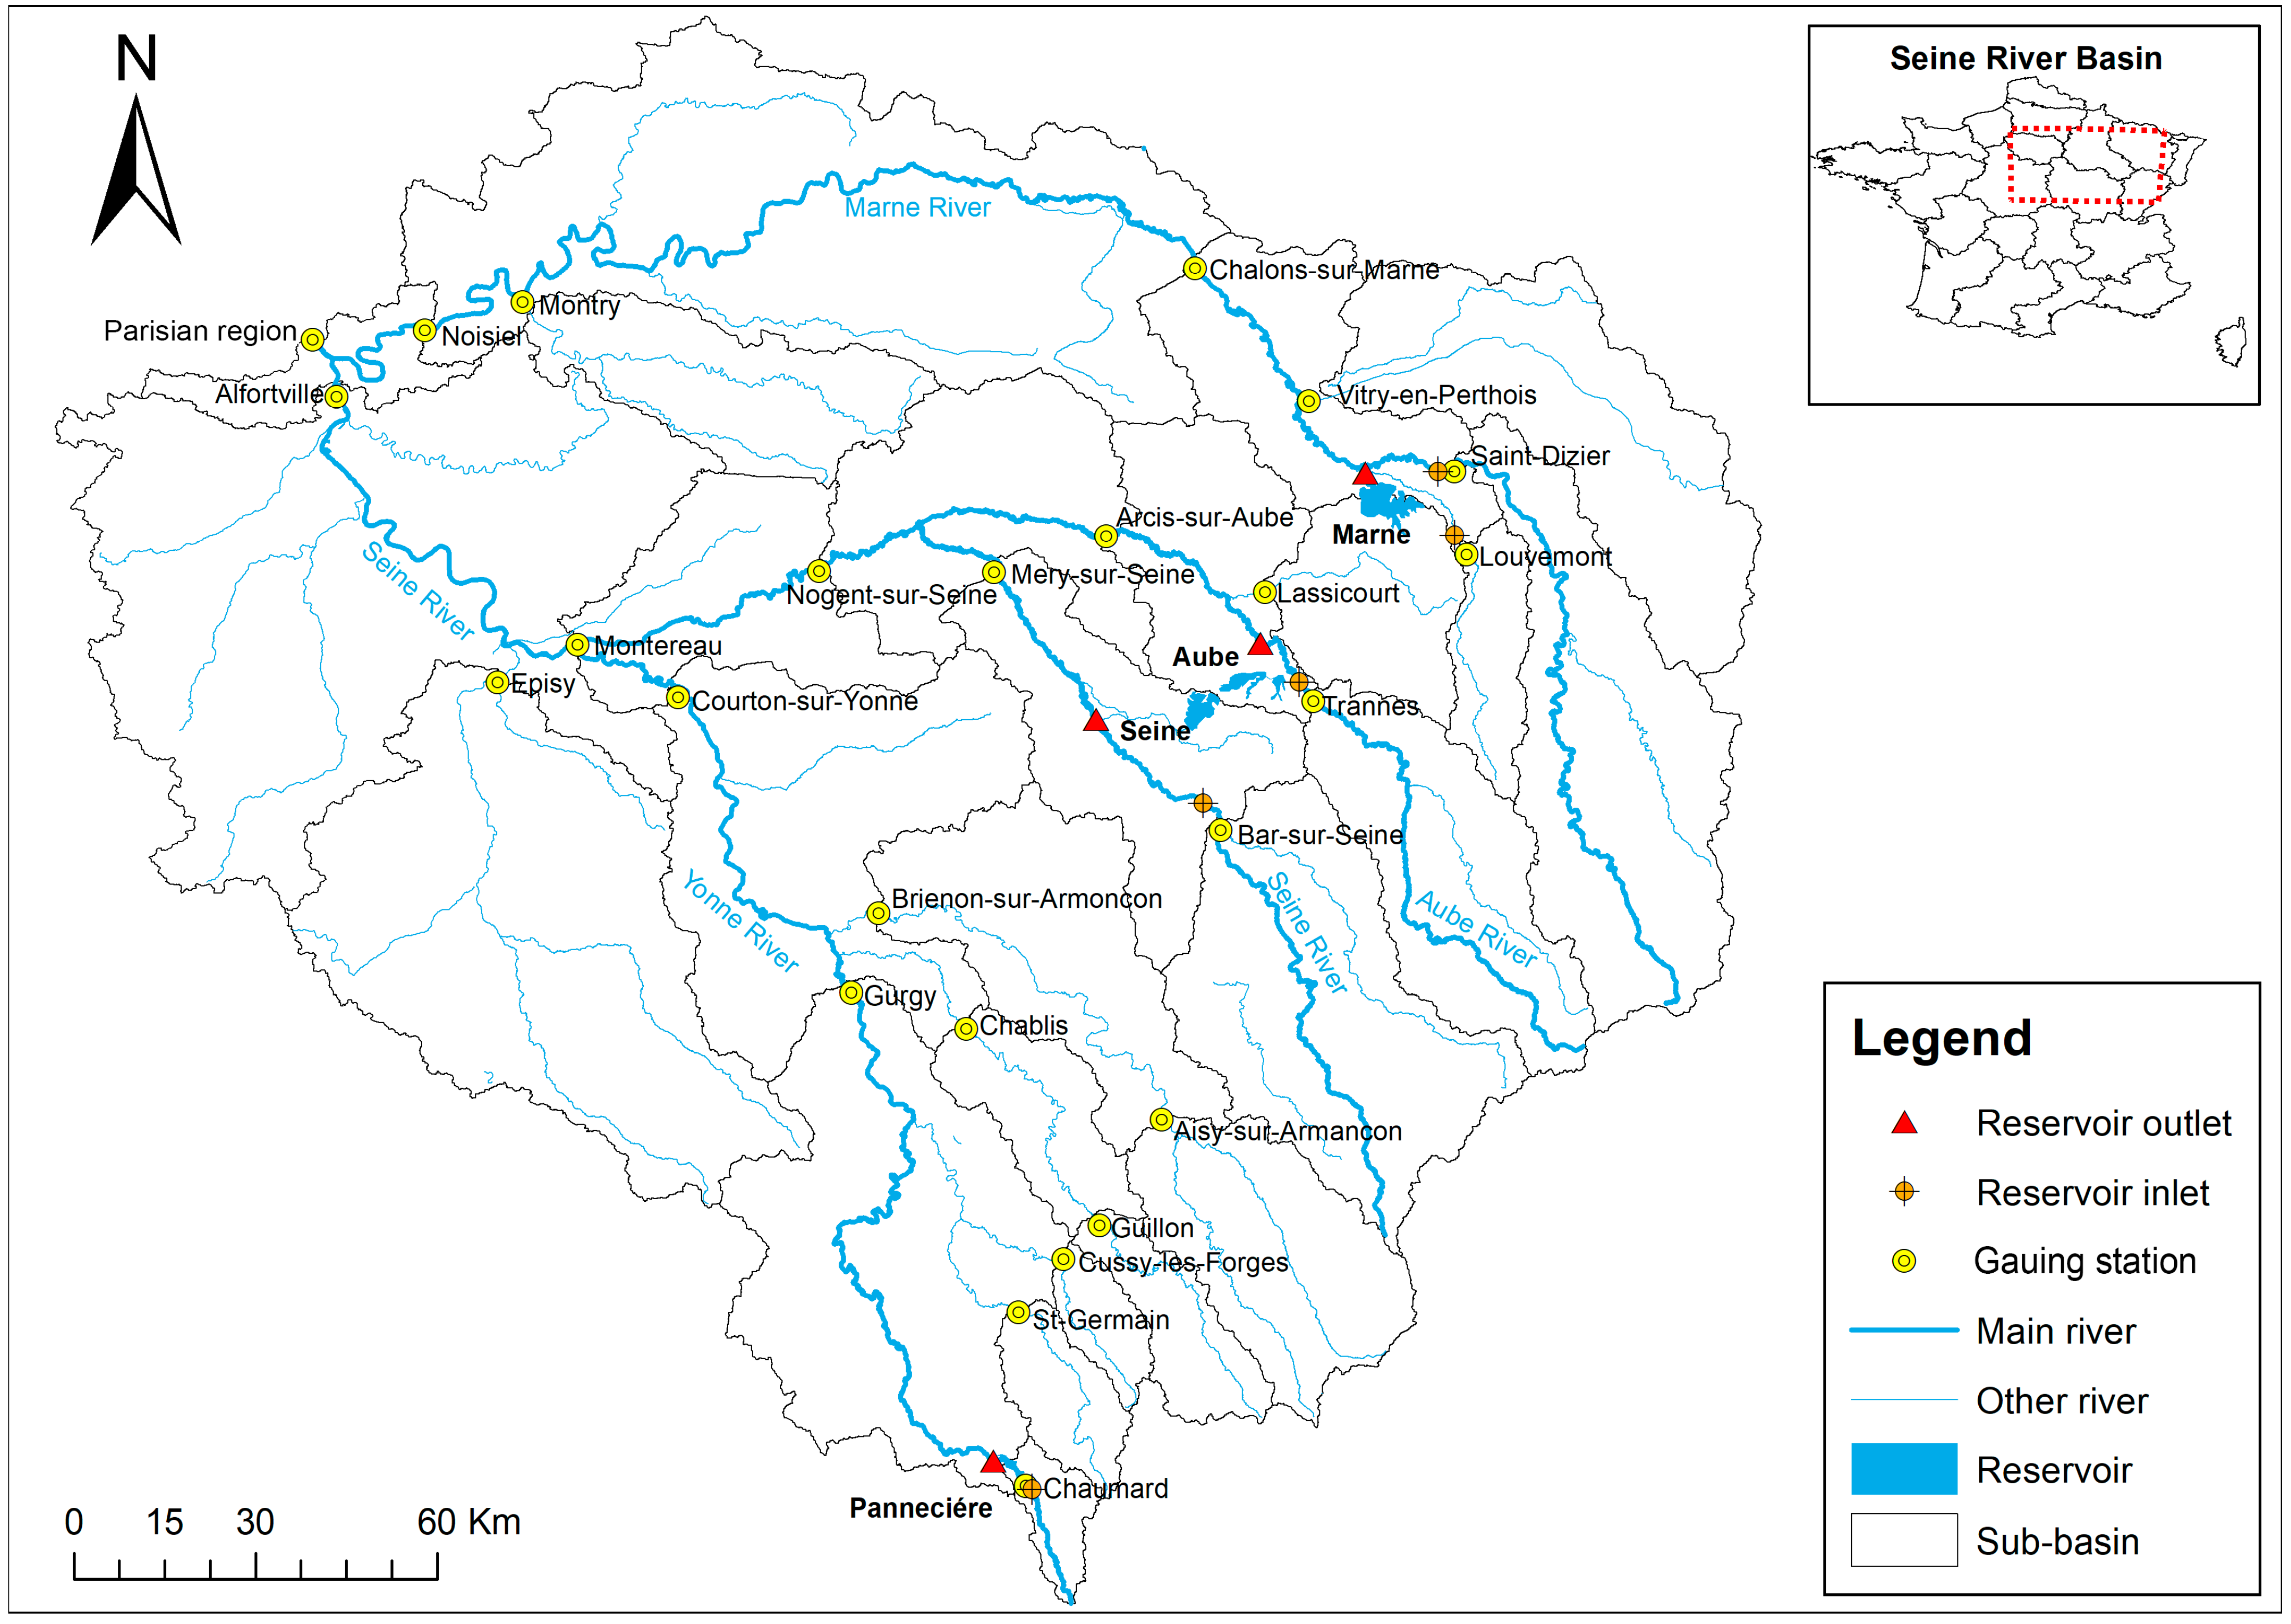
The Seine River Basin located in the northern region of France was selected as a case study for this investigation (Figure 1). The river basin itself has a total area of approximately 78,600 km2, with four large reservoirs situated on the Yonne, Seine, Aube, and Marne Rivers. The Pannecière reservoir located on the Yonne River is known as an inline reservoir, while the other three reservoirs (Seine, Aube, and Marne) are bypass reservoirs. The other main features of these reservoirs are summarized in Table 1. These reservoirs, which are under the management of the Seine Grands Lacs (SGL), responsible for managing the infrastructure system in the Seine River Basin, France, are operated in a parallel mode for flood protection and water shortage relief in the Parisian region.
The Seine River Basin is mainly dominated by the oceanic temperate climate triggered by the westerly winds from the Atlantic Ocean. The average annual rainfall in the river basin between 1968 and 2019 was estimated to be 791 mm, and uniformly distributed throughout the year. The mean annual temperature and evapotranspiration were recorded as 10.3 °C and 648 mm, respectively. Based on the SGL data provided, the inflow is usually high in winter and low in summer (see Figure 2), especially during the period 1900 to 2009, when mean annual inflows were estimated to be 156, 288, 133, and 1185 million cubic meters (MCM) flowing into the Pannecière, Seine, Aube, and Marne reservoirs, respectively.
The dominant land use in the study area is agriculture, grassland, and woodland, accounting for 51%, 18%, and 25% of the entire area, respectively [47]. Most of the urban area is located along the Seine River and the Parisian region, with more than 10 million inhabitants. When considering the climate change and its impacts on socioeconomic development, the Seine River Basin is mainly affected by flood and drought hazards. In this context, it is therefore essential to put in place more integrated water resources management across sectors and agencies towards the achievement of sustainable regional development.
2.2. Data Sources
To understand the behavior of the Seine River Basin, long-term daily discharge data of 25 gauging stations from 1900 to 2009 and hydraulic parameters (Table 2) for each sub-catchment, which was acquired from the ClimAware Project [48], was utilized (see gauging station locations in Figure 1). The physical reservoir data including area-capacity curve, daily inflow and release rates, existing reservoir rule curve, and downstream constraints, were derived from the SGL and gathered from other various sources. Figure 2 shows the historical mean monthly inflow and release rates recorded for each reservoir. The downstream water demand of the Seine River Basin, including the needs for urban (554 MCM), industry (343 MCM), abstraction from canals (61.6 MCM), and irrigation (2.4 MCM), was obtained from the National Bank of Quantitative Water Withdrawals (Banque nationale des prélèvements quantitatifs en eau, BNPE). The irrigation water needs are very small in this study area because the downstream part (Parisian region) is mainly covered with built-up land where drinking water is the most consumptive water use. Before proceeding further, it is proper to state that the land use change was not included in the scope of this study. Because the effect of land use change is likely to be related to the streamflow time series generated by the hydrological model, in this study, the synthetic streamflow generator method was applied to provide inflows to the reservoir for the desired time period and used for solving the optimization problems.
2.3. Objective Function
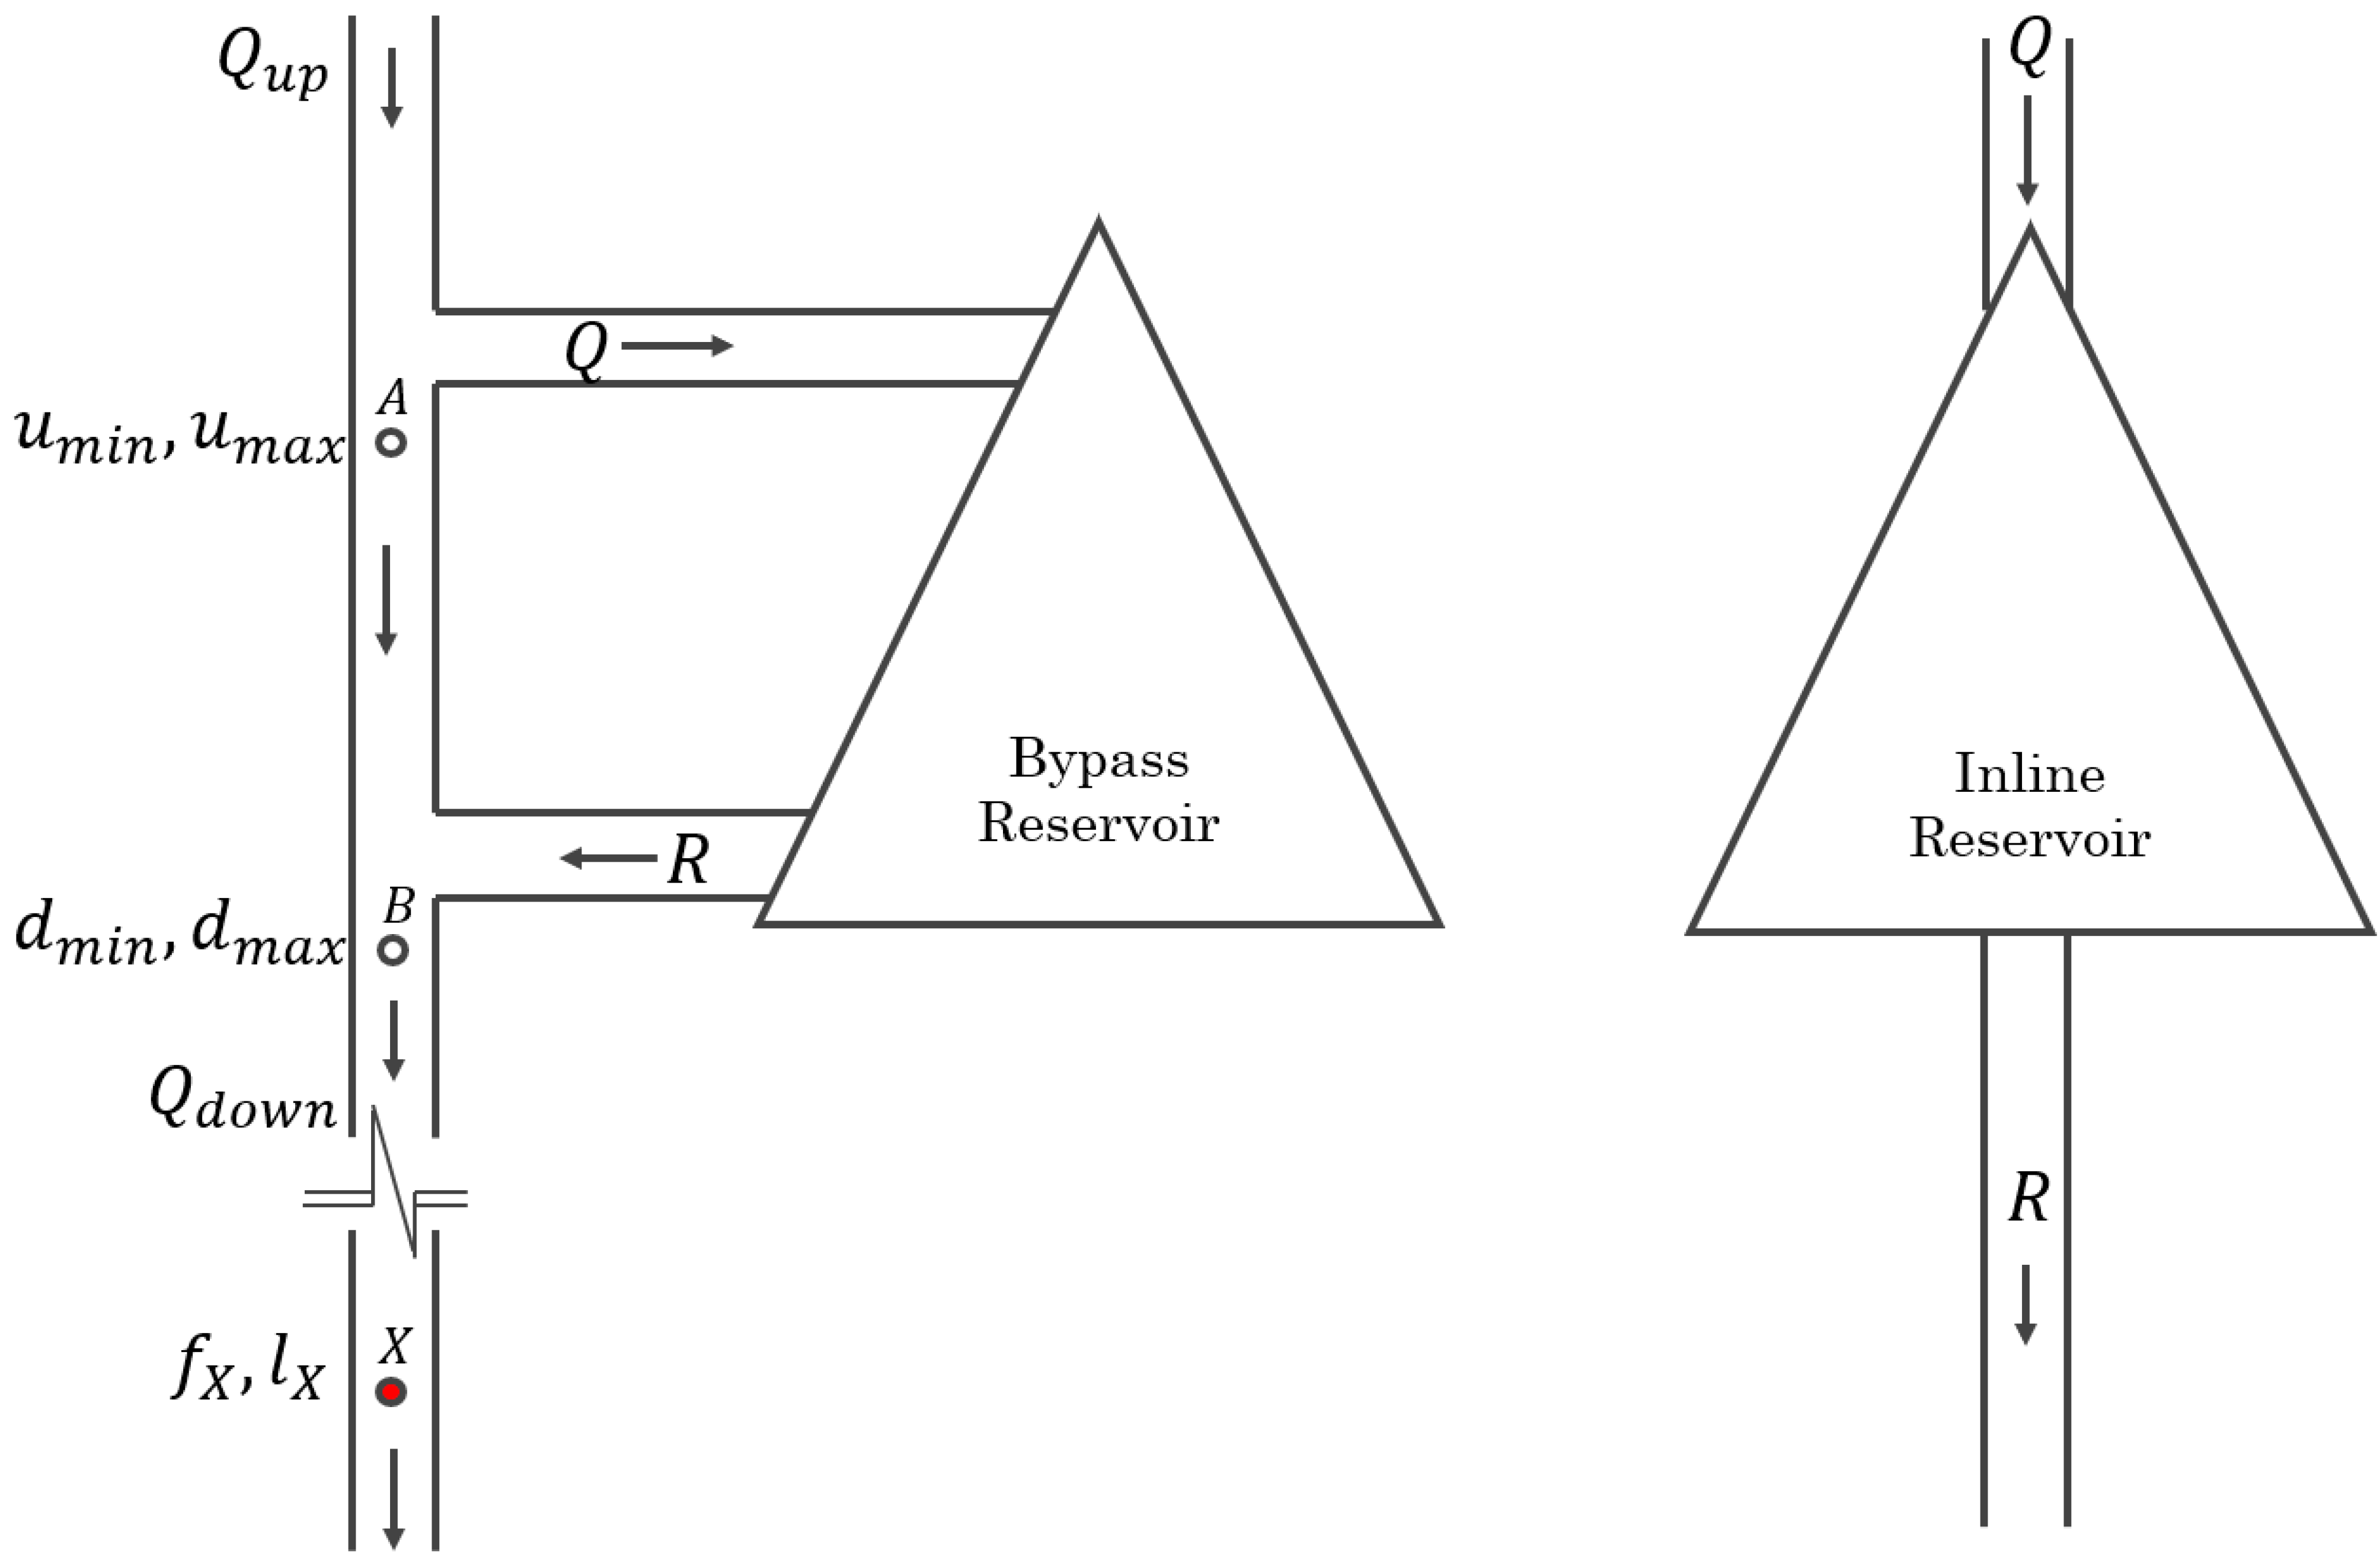
Under the joint operation mode, the optimal reservoir storage capability is of great significance for providing mitigation option ahead of time to further reduce potential flood damage [27]. However, it would be more complicated if the multi-reservoir system was combined with external bypass reservoirs that follow the contemporary operation rules. As can be seen in Figure 3, some portion of flow will be diverted through the diversion channel into a bypass reservoir for flood protection purpose and the remaining flow will continue downstream through the river course, while the inline reservoir is a standalone unit and is built in line with the river course for regulating flow with a balanced operation.
The optimal water allocation to different sectors in the river basin can be determined by optimizing the storage capacity of a multiple reservoir system through a single objective function. As presented in Equation (1), the available reservoir storage is considered to maximize the benefits of its usage. Additionally, in consideration of the primary purpose of these reservoirs, such as flood control or low-flow regulation, a single-objective optimization is still preferable for finding the best solution in optimization problems:
where J is the total cost of the system; ω is a coefficient (−1 for flood protection and 1 for low flow support); N is the number of reservoirs; T is the number of time steps t; and is the water storage space available for reservoir i at time step t.
Subject to the constraints
It is a matter of fact that the bypass reservoir system may contain a range of local constraints in its operation process. As clearly indicated in Figure 3, various restrictions of flow (u, d, f, and l) were assigned differently at points A, B, and X, as they may influence the operation of the reservoir system. Meanwhile, various specific requirements may also exist in both inlet and outlet of a bypass reservoir system, as described below.
For inlet control:
For outlet control:
where the + operator represents the maximum value between its argument and zero; Qup refers to inflow from upstream; Qdown stands for the sum of reservoir release (Rt) and lateral flow from downstream sub-catchment; Qt is inflow during time step t; qmin and qmax are minimum and maximum inflow to reservoirs; umin and umax are minimum and maximum limits of flow at the upstream; dmin and dmax are minimum and maximum limits of flow at the downstream; and rmin and rmax are minimum and maximum release from reservoirs.
It can be said that Equations (2) and (4) are local constraints for the bypass reservoir system considered in this study. In detail, Equation (2) describes the minimum flow (umin) which is required at point A for environmental protection between sections A and B (see Figure 3). When considering the low-flow season (Qup is low), the priority of supply will be given to section A; however, if high flow occurs (Qup is high), the maximum flow at point A will be restricted by a threshold value (umax). Thereafter, the excess water will be diverted to a nearby reservoir—the so-called bypass reservoir—as much as possible to avoid any damage to the river between sections A and B.
Referring to the downstream location, Equation (4) reveals that there is a restricted flow requirement at point B within the range of values dmin to dmax. In cases of low-flow events, the supply (Rt) will be maximized at the outlet to satisfy downstream needs, whereas the supply will be limited if the flow at point B reach the dmax cutoff point.
When ignoring the evaporation and seepage losses from the reservoir, the calculation of storage capacity at the end of the period can be determined by the water balance equation:
where smin and smax are the minimum and maximum reservoir storage, respectively, and St is the estimated storage at time step t.
For some complex systems, additional criteria can be included at downstream gauging stations for describing the flow magnitude contributed from each tributary sub-catchment. In the case of the Seine River Basin, France various thresholds were set at downstream stations by the organization that is in charge of management of the infrastructure system in the Seine River Basin, France called Seine Grands Lacs (SGL) (see Figure 1 and Table 2). In detail, each station contains a range of thresholds from low (water shortage) to high (flood) levels. High-flow thresholds are set as vigilance, regular, and exceptional levels, whereas low-flow thresholds are classified as vigilance, alert, reinforced alert, and crisis levels (Table 2).
To integrate the above thresholds into the optimization problem, it is essential that streamflow measured at a given downstream station X (see Figure 3) should be less than or equal to its flood thresholds, fx (for flood protection) or greater or equal to low-flow thresholds, lx (for low-flow protection), as described in Equations (8) and (9), respectively.
2.4. Application of Dynamic Programming for Optimization of Reservoir Operation
Most of the relevant problems that use dynamic programming to obtain numerical solutions can be solved by discrete-time variation analysis [49]. For this purpose, optimization problems would need to find the optimal control sequence {Q1, R1}, …, {QT, RT} such that the total cost of the system J in the objective function (Equation (1)) is optimized. It should be noted that decision variables for the bypass reservoir system are not only limited to the release (R) but also for inflow (Q) (see Equations (2) and (4)). In view of continuous-time variational control problems, it can be described when the control is assumed to be piecewise constant in time and appropriate transformations is transformed into the discrete-time case [50]. To deal with the above problem, the iterative functional equation that determines the optimal control for any admissible state at any stage (t) is a way to dynamic programming solution. Referring to Equation (1), the minimum-cost function (ξ) is defined for all states S and all times t = 1, …, T, as can be shown in Equation (10) [51].
From Equation (6), the state equation of the reservoir can be defined as St+1 = Φ, where Φ is a function of water balance of reservoirs. The iterative functional equation can then be written as:
By considering Equation (11) as a mathematical expression of Bellman’s principle of optimality [50], the minimum cost for state S at stage t can be found by choosing the control that minimizes the sum of the cost at present stage t and the end state t + 1. The optimal control at state S and stage t, which is indicated as (S, t) = {Qt, Rt}, can be defined as the values of Qt and Rt in which the minimum in Equation (11) is achieved. The determination of ξ(S, t) and (S, t) are expressed in terms of ξ(S, t + 1), and the problem can then be solved backward in t. Considering the terminal boundary condition, the minimum cost function can be rewritten as:
For solving Equation (12), the optimization algorithm needs a seeding for ST for each time step of the simulation period. In this study, the optimization was seeded with an empty reservoir volume (ST = 0) for the optimization of the lower rule curve and with a fully filled reservoir (ST = Smax) for the generation of the upper rule curve. As for the worst-case scenarios, this assumption will help the optimization to maximize as much as possible the space available in each reservoir for ensuring that enough water is available to meet downstream needs during low-flow situations while preventing a surplus of water under high-inflow conditions. In this case, the optimization algorithm was applied to find out the optimal storage level of each day of the year. It is important to note that since the evaporation loss depends largely on climate and the surface area of stored water, the evaporation rate was then neglected as the reservoirs considered in this study are rather small, and also to simplify and avoid complexities in the analysis. Likewise, the seepage loss was also ignored due to insufficient data acquired from the field. However, both losses can be a very significant factor in water balance calculation, which should be considered in future applications.
2.5. Joint Operation of Multiple Reservoir System
Under the joint operation, the total water demand must be shared between all reservoirs in order to reduce the risk of severe shortages and increase the likelihood of proactive reductions for water users. For water supply purposes, the joint operation of reservoirs can be improved by the use of the space rule to set target storages in each reservoir and then select releases from available reservoirs [27]. This can be mathematically expressed by the ratio of space remaining at the end of the period to the expected amount of inflow during the remaining refill period for each reservoir, as shown in Equation (13).
From Equation (13), the allocated water demand for each reservoir () can be rewritten as:
where is the expected inflow of reservoir i during the drawdown–refill cycle period and Rall is the total downstream water demand from all reservoirs.
However, the accuracy of expected inflow is a challenging issue for the use of the space rule. As suggested by [27], in order to optimize reservoir space for predicted inflow that would otherwise spill, the reservoir release should be stepped up until the end of the drawdown–refill cycle. Based on the historical data, the months from July to June in the next year were identified as a drawdown–refill period for reservoirs located in the Seine River Basin. The high-inflow events often occur from December to June in the next year, and are essential to refill reservoir capacity. To configure the space rule in a daily reservoir simulation, a constant ratio of daily inflow, which corresponds to monthly inflow, was presumed. The allocated water demand obtained from the space rule was then used in dynamic programming for optimizing the control variables of each reservoir, i.e., {Qt, Rt}.
2.6. Identification of Optimal Rule Curves
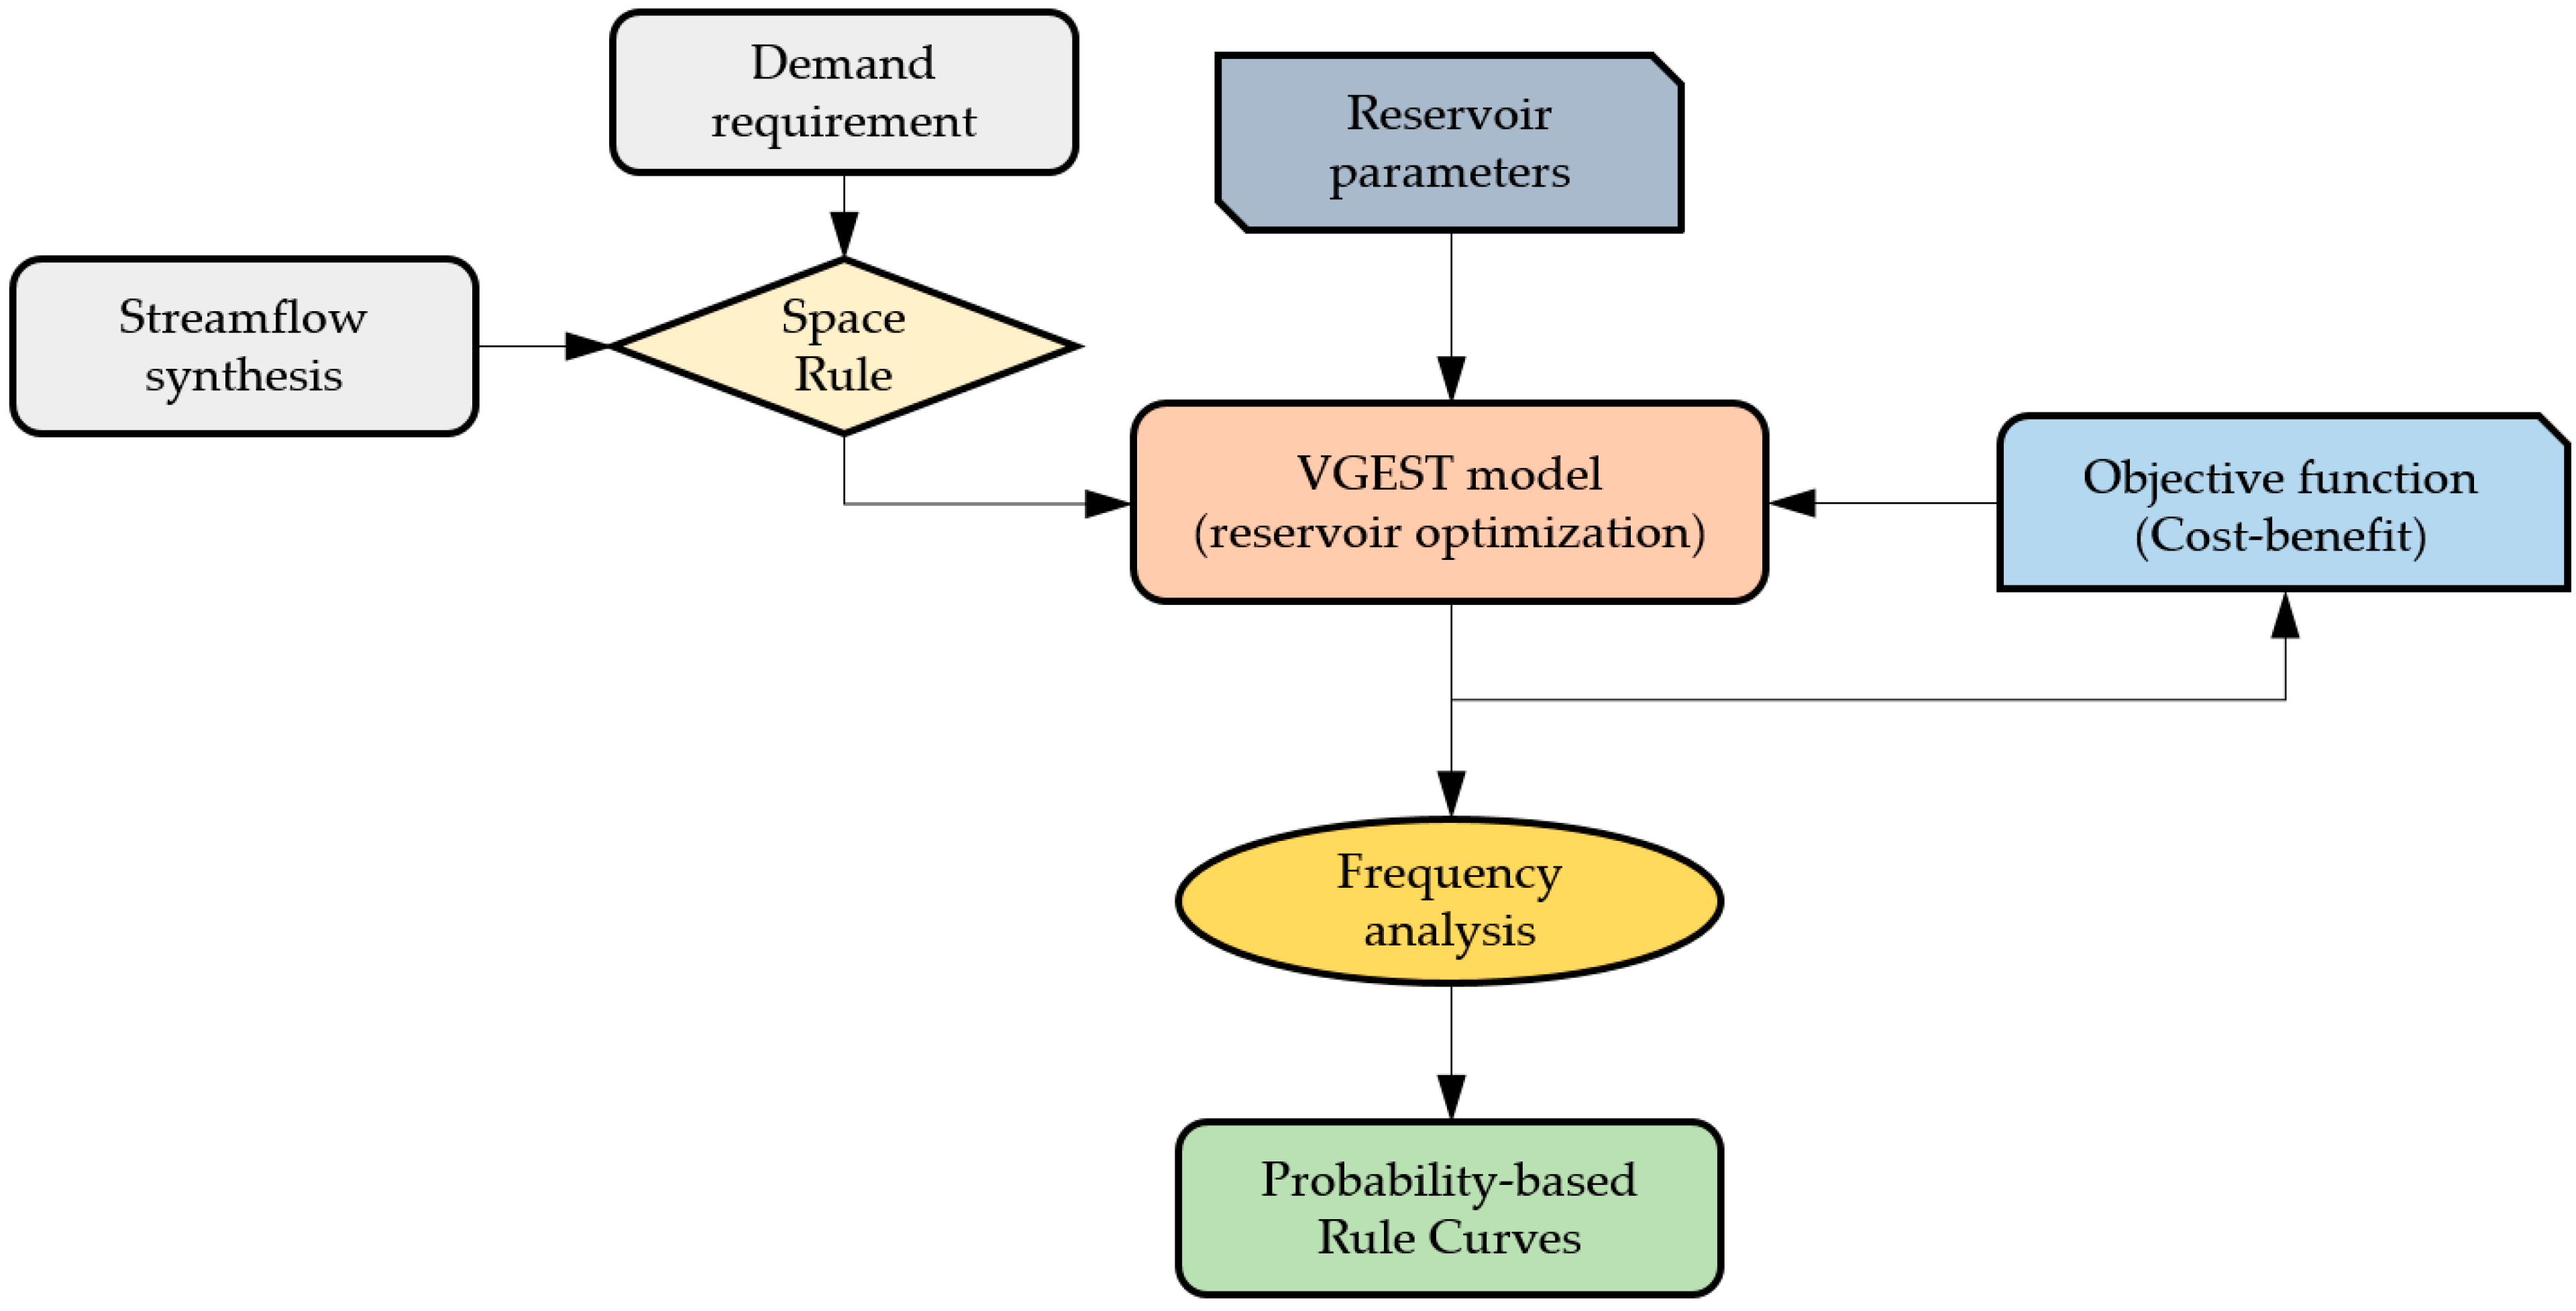
In general, the operation of a reservoir is normally governed by a set of operation rule curves, i.e., upper rule curve (URC) for controlling the surcharge storage available and lower rule curve (LRC) for determining the minimum level that all user demand is satisfied. In this study, probability-based rule curves were developed to estimate reservoir storage capacity under the occurrence of extreme events. The flowchart in Figure 4 illustrates the optimization and simulation approach for searching optimal rule curves. This analysis was based on a complete set of optimal storage levels in non-leap years from 1900 to 2009 in daily time steps obtained from dynamic programming simulations and was re-transformed to an annual frequential hydrology. Three plotting position methods, i.e., Bernard and Bos-Levenbach, Hazen, and Weibull formulae, were used to determine the probabilities of exceedance with specified return periods.
According to [52], a comprehensive frequency polygon is constructed based on a preliminary classification of values in samples that are ranked (r) in either ascending order for drought or descending order for flood. The next step is the construction of cumulative empirical frequency () of each sample value x, as can be expressed as , where n is the number of years. The estimation of cumulative empirical frequency proposed by Bernard and Bos-Levenbach, Hazen, and Weibull can be mathematically expressed as shown in Equation (15). A linear interpolation method is then applied for curve fitting.
3. Results
3.1. Efficient Water Allocation under Reservoir Joint Operation
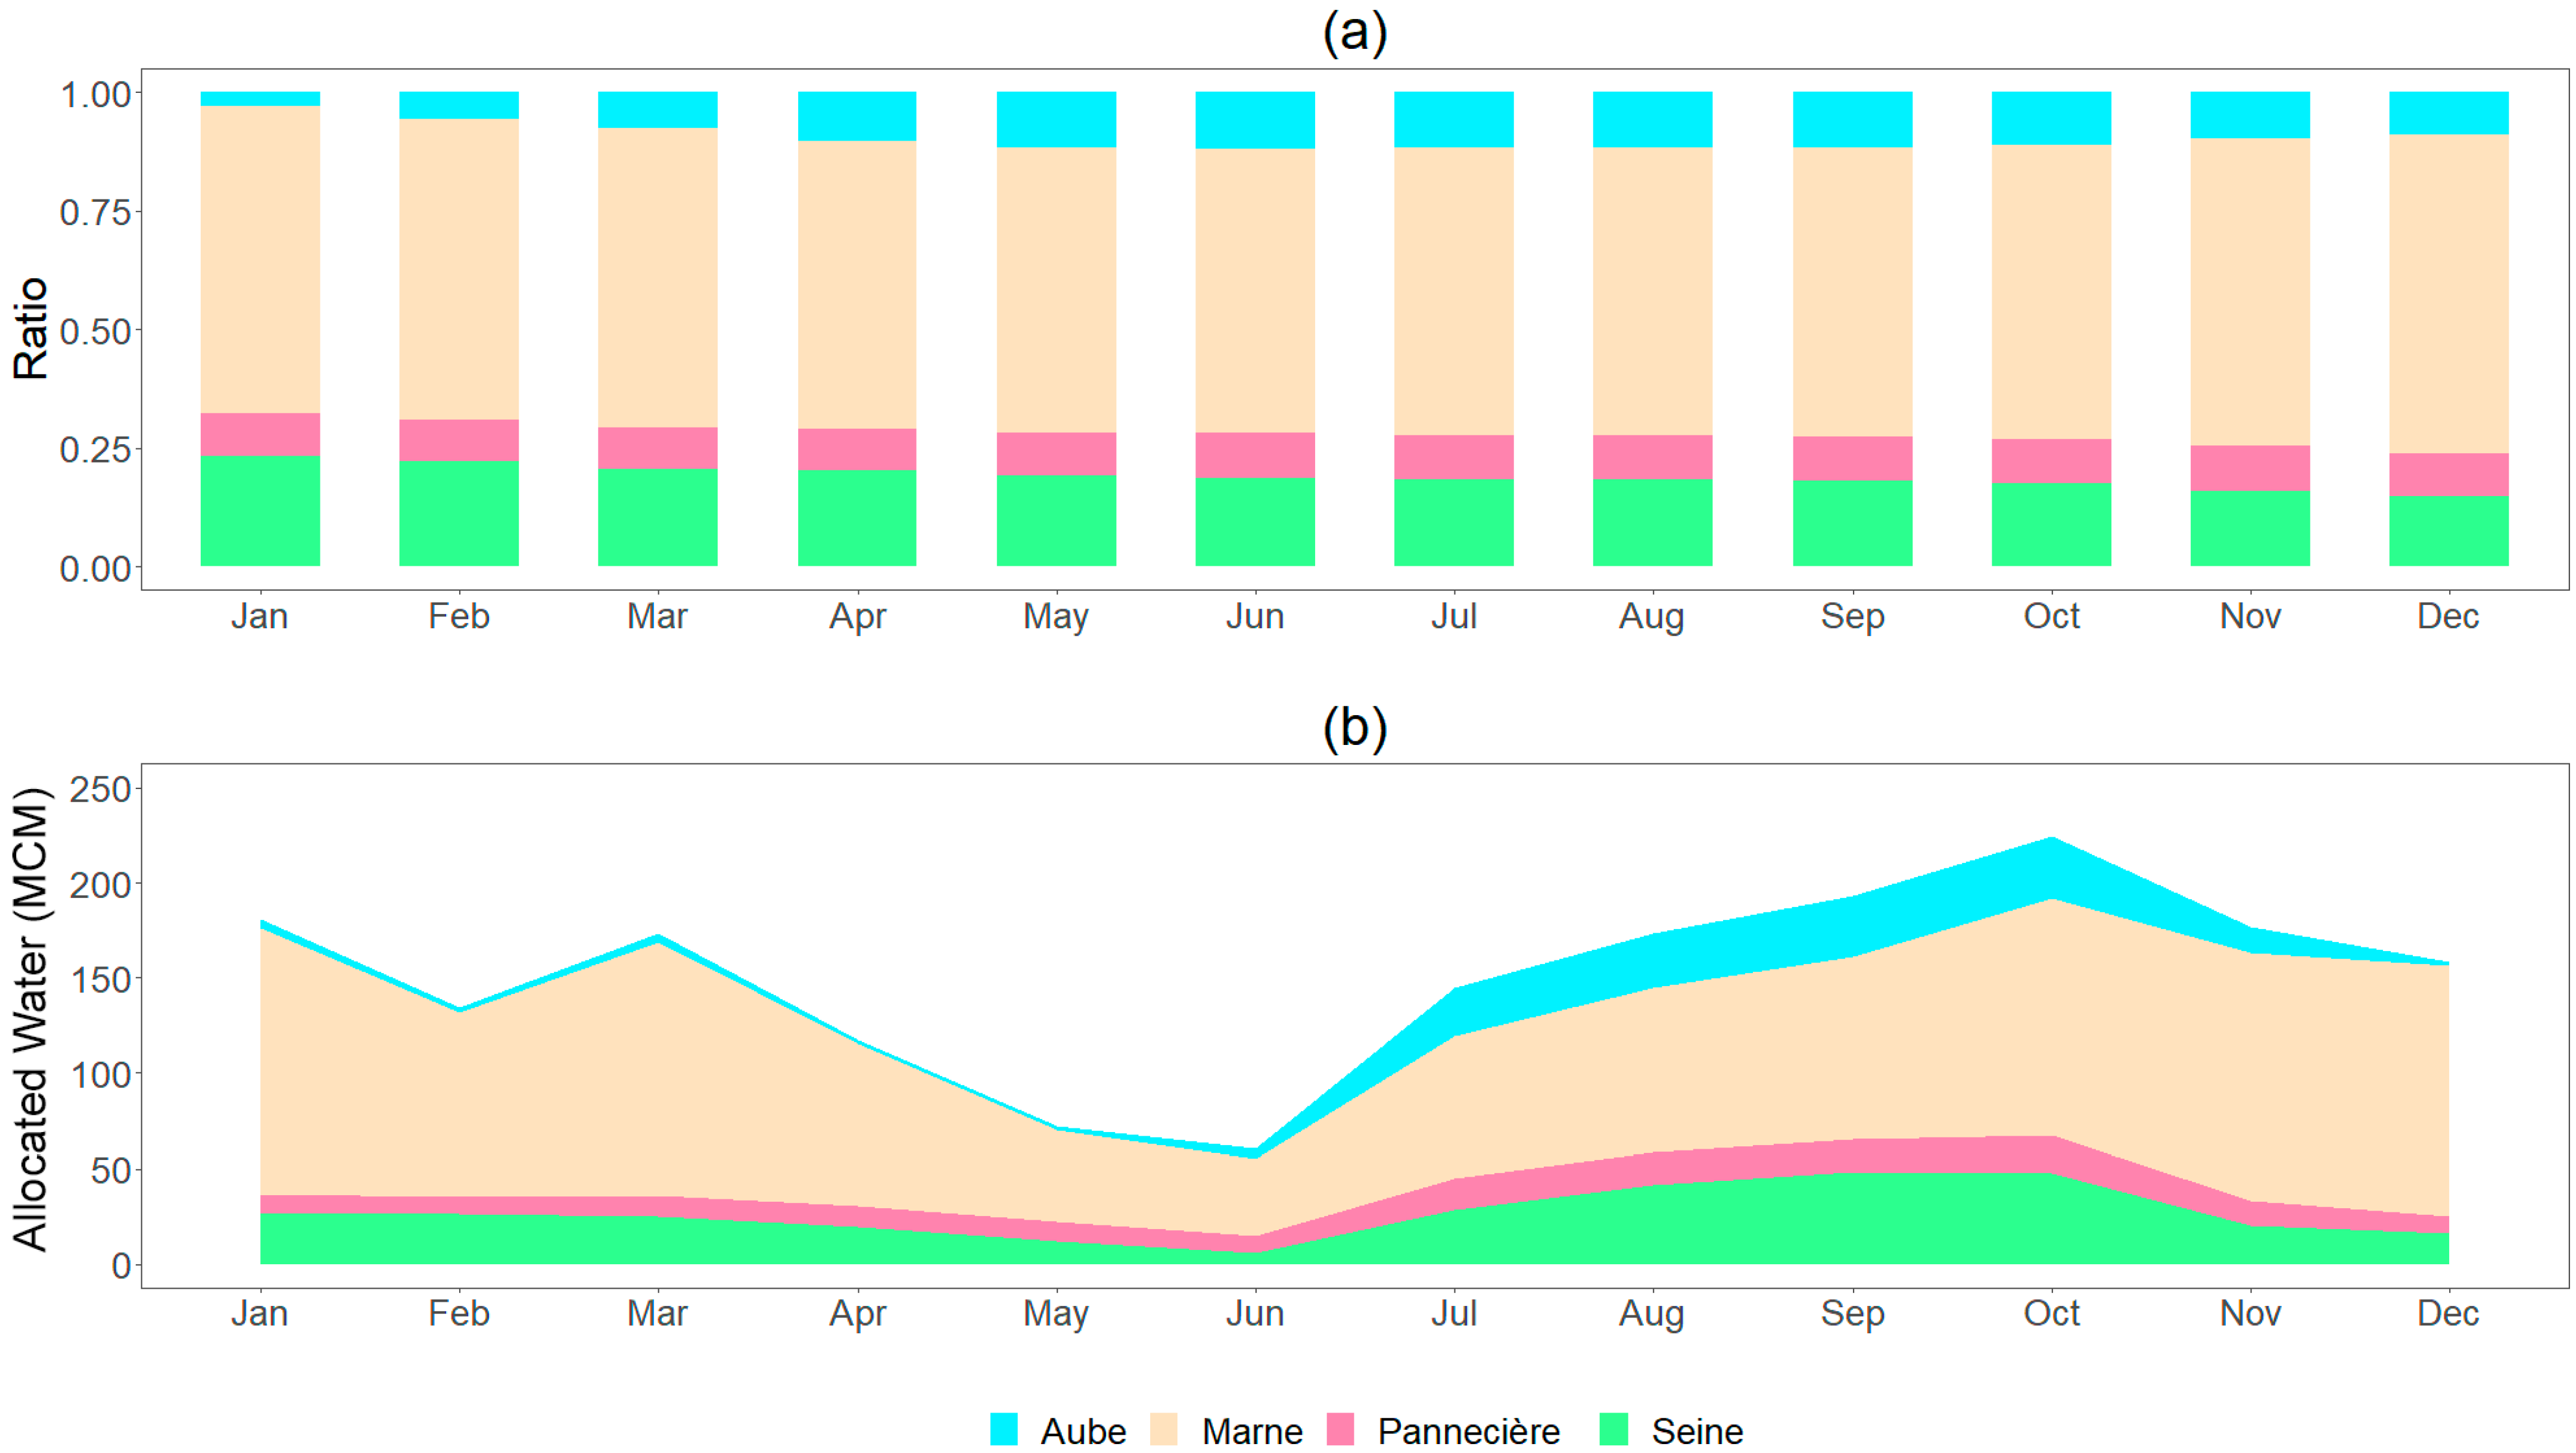
Figure 5a illustrates the proportion of expected inflow to each reservoir during the drawdown–refill cycle period. The results highlight that the Marne reservoir has the largest proportion of predicted inflow, whereas the Aube and Pannecière reservoirs are the two lowest. It is clear that the difference in proportions corresponds to the pattern of historical mean monthly inflow, which ranges from the largest inflow to Marne, followed by Seine, Aube, and Pannecière reservoirs as described in Figure 2. Obviously, the likely inflow to the Pannecière reservoir is quite constant throughout the entire period. The inflow to Seine reservoir is expected to decrease, while the fluctuation of inflow to both Marne and Aube reservoirs is detected throughout the year.
Under the joint operation of the multiple reservoir system, the water allocation from each reservoir for consumptive uses is shown in Figure 5b. It shows that the quantity of water allocation from Aube reservoir is the lowest compared to the others. This is due to a relatively low annual water demand from Aube reservoir of approximately 0.35 MCM, which is mainly for irrigation and economic activities. Similarly, the requirement is also restricted for Pannecière reservoir, with an annual withdrawal rate of 8 MCM. In contrast, the water allocation from Seine and Marne reservoirs are found to be the largest. To support the above findings, the annual consumption rates from the Seine and Marne reservoirs were estimated to be 200 MCM and 730 MCM, respectively.
3.2. Annual Optimal Rule Curves
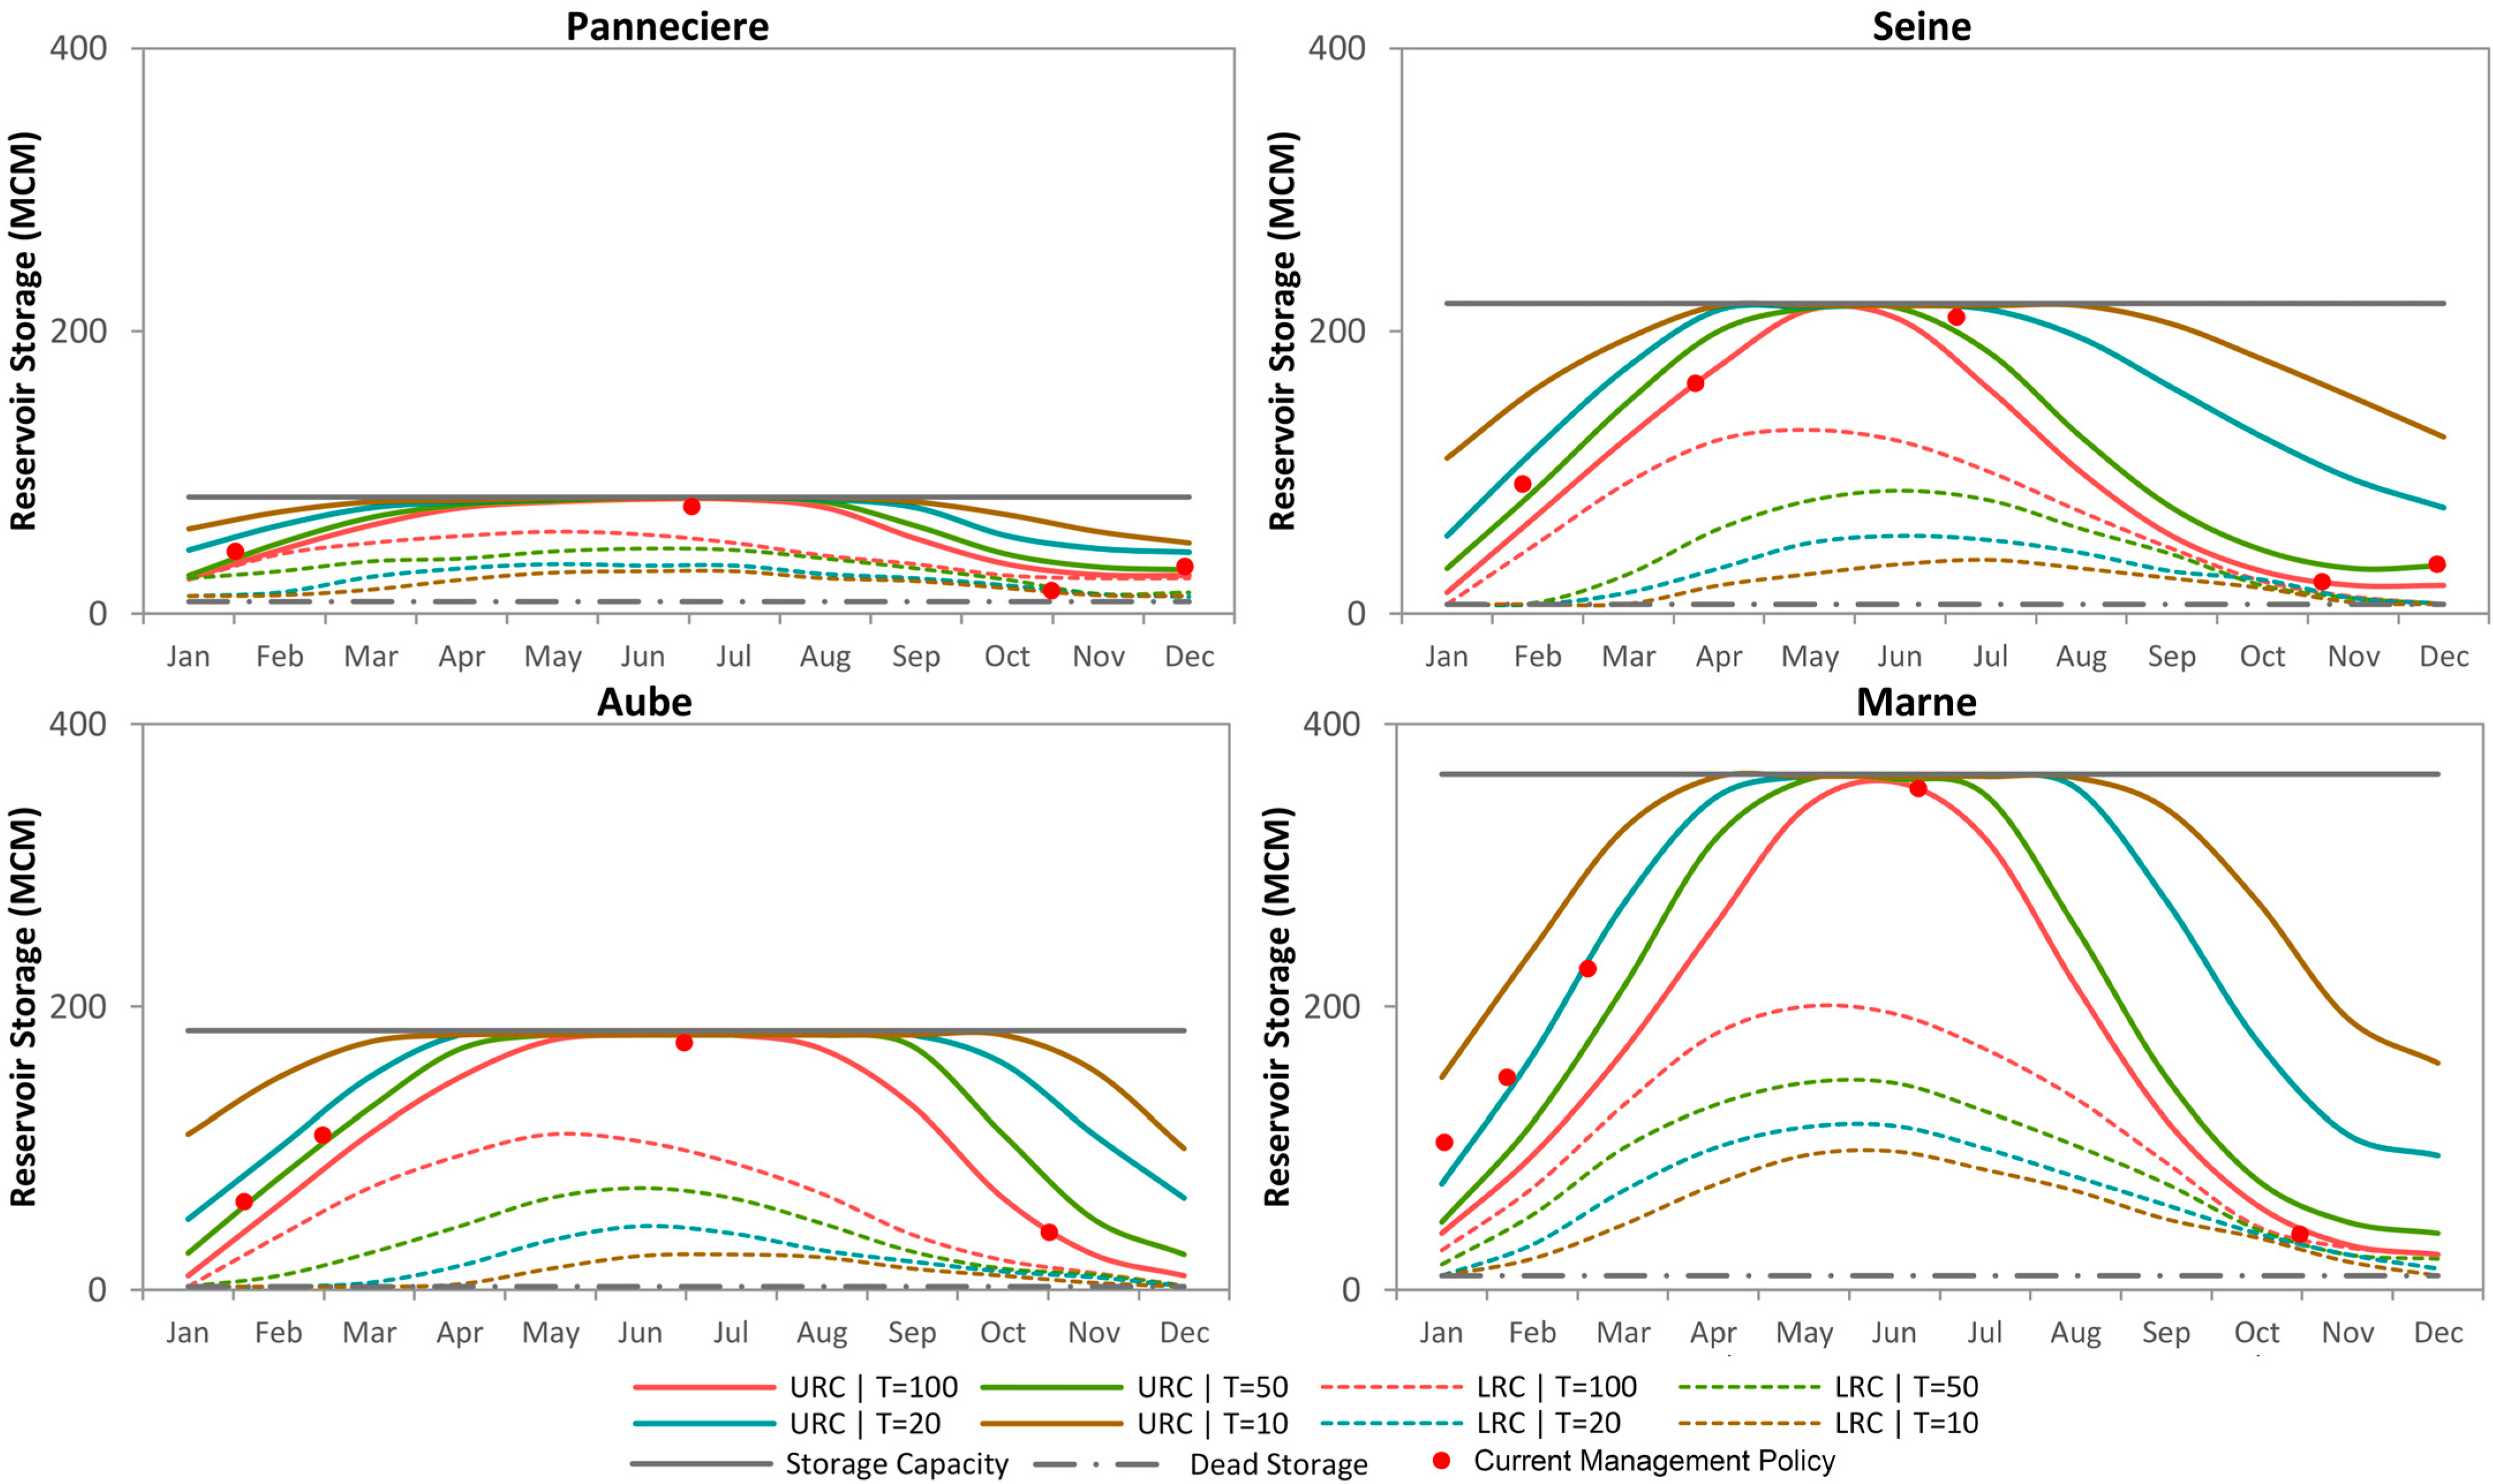
Referring to the steps shown in Figure 4, the annual optimal rule curves were derived based on the probability frequency analysis derived from the optimization results. In detail, the frequency analysis technique was applied to yield reservoir storage for each return period by fitting the probability distribution to the simulated storage (1900–2009) obtained from the dynamic programming simulations and implemented by three plotting position methods, i.e., Bernard and Bos-Levenbach, Hazen, and Weibull formulae. To derive the URC and LRC, two separate optimizations were carried out by setting the ω coefficient indicated in Equation (1) to −1 and 1, respectively. To obtain the rule curves for the 10-, 20-, 50-, and 100-year return periods, a frequency analysis was carried out. As a reference, the red dots shown in Figure 6 are current management policy defined and provided by SGL for reservoirs to be operated during the filling period from 1 November until 30 June and the depletion period from 1 July until 31 October over a yearly cycle, while both dashed and solid lines are active zones between dead storage and reservoir capacity. For more details, the current management policy for these reservoir systems is further discussed by [48]. To give a clear view on this current management, for instance the case of Pannecière reservoir, the value of 50 MCM implies that the filling status of its storage on the first day of February should reach 50 MCM, while the Pannecière is expected to lessen to 12.3 MCM by the beginning of November. However, it is worthy of mention that the data on reservoir storage volumes are sparse for some months, in which the missing storage values were filled using linear interpolation.
3.2.1. The Proposed URC for Flood Control
Based on the Bernard and Bos-Levenbach approximation, for example, the proposed URC for all four large reservoirs was defined in relation to a high-flow threshold of 950 m3/s at the Paris gauging station, as depicted in Figure 6. When comparing the current management practices, the URC of Aube reservoir shows a lower reservoir storage during the summer from August to September than in July, as indicated by the red dot. The results of the 50- and 100-year return periods suggest impounding up to the gross storage capacity of the reservoir during May to August, which is higher than the current operation management. It can be said that the proposed upper rule curve would help to ensure that the effects of water shortage can be attenuated during the summer months, while lowering the reservoir storage prior to the flood season could ensure extra capacity for flood storage. To compare the proposed URC of Seine reservoir with its current operation management, a relatively low storage capacity at 50- and 100-year return periods was observed during the dry period, which can lead to increasing the reservoir storage capacity and offering space for accommodating floodwater. Interestingly, although both reservoirs are close to each other, the mean annual inflow of the Seine is almost double that of the Aube and it is the main water supply contributor for Aube and Pannecière reservoirs in the Seine tributary (see Figure 1). Focusing on the Pannecière, the smallest reservoir in the Seine River Basin that regulates the ecosystems and habitats along the Yonne and Seine tributaries, the adjustment of URC can cause a reduction in water supply during the summer compared to the current management. The withdrawal at the red dot in November, for example, can be considered an oversupply, as recommended by the SGL (personal communication, 15 May 2020), in which it would probably cause excessive water in the Seine tributary and subsequently flooding in Paris City. It was also found that the water demand from the Pannecière is marginal at the rate of 8 MCM per year, and this is due to a significant contribution from the Seine reservoir. Regarding the Marne, which has the largest capacity in the Seine River Basin, it is known as the main source of water supply and flood control in the Marne sub-basin and Paris region. Similarly to the other reservoirs, under the new derived URC of the Marne and at high return periods, there was a substantial withdrawal rate during the summer months. The reducing pattern is slightly similar with the current management policy, as denoted in the 50- and 100-year return periods. Subsequently, the flood peak entering the Marne can be absorbed especially for large flood frequency events due to the increase in available reservoir storage capacity. Obviously, it can be seen in the proposed URC that the reservoir storage capacities under higher return periods are lower than the lower ones. The reservoirs are recommended to operate at lower storage levels, especially for flows with higher return periods, in order to enable operation in high-flow conditions. Then, it is important to mention that the provision of empty storage space available in the reservoirs should be considered to give extra room for flood attenuation in downstream areas.
3.2.2. The Proposed LRC for Low-Flow Support Objective
As depicted in Figure 6, the proposed LRC was determined based on a low-flow threshold of 81 m3/s at Paris gauging station estimated by the Bernard and Bos-Levenbach approximation. There is no doubt that the characteristic components of the LRC of all major reservoirs is coincide with the URC, i.e., the rising limb can be seen during the rainy months, while the falling limb is more evident in summer. To avoid water shortage and ensure sufficient water quantity during abnormally dry periods, the storage in the buffer zone can only be used to satisfy essential and high priority needs. However, improper and rapid release of storage volume from this zone may result in a dam failure due to a rapid drawdown and a geological failure. Hence, it can be said that a single optimal solution may not satisfy the tradeoff between different objectives, but rather a set of potential solutions is required. Overall, the revised LRC was proposed to provide a guarantee of adequate reservoir capacity through the dry season without affecting the reliability of meeting various demands. It can be seen that for all LRCs under different return periods, there was a seemingly significant difference between the current operating reservoir storage and the proposed one, especially in the month of July (the Marne is the largest and the Pannecière is the smallest) and almost no difference in the month of November.
3.3. Web-Based Application for Optimization of Multiple Reservoir Operation
To provide robust decisions for optimal operation of reservoir systems, computer optimization modeling tools are widely used for reservoir planning and management. In this case, a web-based decision-support platform—Interactive Reservoir MAnagement Risk Assessment (IRMaRA)—was developed using the R shiny application for determining the probability of future flood and drought risks and optimizing water supply in a multiple reservoir system in the Seine River Basin, France. As executed on a web server, 2000 years of daily streamflow data based on the Kirsch-Nowak Streamflow Generator [53] and different years of the return periods can be acquired and processed, whereas model files can also be updated for simultaneously solving reservoir operation problems. This web-based platform could improve computational efficiency and maintain performance accuracy for large-scale applications, provide a better physical insight of the complexity of the system, and offer an opportunity to test a set of operational objectives and carry out long-term reservoir optimization to help revised reservoir operating rules for four major reservoirs located in the Seine River Basin. In detail, the outputs of the software VGEST, which was initially developed in Pascal by [54] for a single-objective reservoir operation problem and was expanded in this study for multiple purposes of reservoir management, was used to compute the minimum reservoir storage capacity to best meet the objective of preserving the flow above a low-flow threshold in the future. In addition, the VGEST model applied in this study was also extended to derive the probability-based rule curves for a system of multiple reservoirs in parallel, which was not covered by past studies, as most of them focused mainly on finding optimal operation rules for a single reservoir. To include the extended variability of rare events, 2000 years of synthetic discharge time series were computed and used in VGEST based on the procedure proposed by [53]. Indeed, this web-based platform also provides a user-friendly environment to the multiple partners and helps drive reservoir operation appropriately by sharing data (no external input data are required for simulations), models, and analysis tools that will enable the analysis and evaluation processes to be more convenient and accurate with fast processing for large data sets in real time. This demo online tool is also easy to use, as it is a built-in graphical user interface, does not require any external input data from the users for simulations, and is publicly accessible free of charge at https://quandau.shinyapps.io/apps and http://irmara.g-eau.fr (accessed on 5 December 2022).
4. Conclusions
In this study, the development of probability-based rule curves for a multi-purpose reservoir system in the Seine River Basin, France was carried out for 10-, 20-, 50-, and 100-year return periods. Dynamic programming (DP) was used to carry out cost–benefit analysis, which leads to optimal operation objectives of reservoir groups in the Seine River Basin, aimed especially at optimizing the tradeoff between flood risk and water shortage. The space rule was employed to preserve larger amounts of space of joint operation reservoirs for avoiding the inefficient condition of having reservoirs spilling and the other reservoirs remain unfilled. The annual optimal rule curves for each reservoir were determined based on probability frequency analysis with the use of dynamic programming for generating daily time series of simulated storage during 1900–2009. It was found that during the drawdown–refill cycle period, the predicted inflow to the Marne reservoir would be the largest, followed by the Seine reservoir, while the lowest inflow to the Aube and Pannecière reservoirs together, with their restrictions in storage capacities, would result in limited water supply to downstream users. From the Bernard and Bos-Levenbach approximation with a high-flow threshold of 950 m3/s at the Paris gauging station, the URC of Aube reservoir was proposed to postpone the water supply from July to August until September. For the Seine reservoir, since a relatively high withdrawal rate at 50- and 100-year return periods was noticed during the dry season, its storage capacity would then be increased, offering additional space for floodwater. The adjustment of URC of Pannecière reservoir would also cause a reduction in water supply during the summer compared to the current management. The withdrawal in November could be considered oversupply, since it would cause excessive water in the Seine tributary and Paris City. Under the new derived URC of the Marne reservoir, at high return periods, there was a substantial withdrawal rate during the summer months, which would increase the available reservoir storage capacity for flood absorption. Above all, considering all of the proposed URCs, it was found that reservoir storage under higher return periods is allowed to go below the lower return periods, in order to enable operation under high-flow conditions. Under the low-flow threshold of 81 m3/s at Paris gauging station, the trend of the LRC of all main reservoirs appeared to correspond with the trend of the URC, as an increasing trend was noticed during the rainy season and the decreasing trend was noted in summer. Clearly, when comparing all proposed LRCs under different return periods with the existing ones, a clear difference was seen in the month of July (with the largest in the Marne and the smallest in the Pannecière), while almost no difference was found in November. In brief, the optimal operation rule curves suggested a reduction in water supply from reservoirs in the dry season, as water shortage is not the primary constraint for Seine River Basin. In addition, the web-based support system for reservoir operation Interactive Reservoir MAnagement Risk Assessment (IRMaRA) was also developed and deployed for public access in an easily accessible and user-friendly format, which enables users to execute the application and view the results. The obtained results from this study revealed that DP provides considerably higher computational efficiency, which enables the optimal joint operation of the multi-reservoir system to be achievable. Eventually, a set of proposed optimal rule curves based on the current reservoir storage and possible inflow scenarios can be considered as guidelines for formulating reservoir sustainability plans of the Seine River Basin.
Author Contributions
Conceptualization, Q.V.D.; methodology, Q.V.D. and K.K.; software, Q.V.D.; validation, Q.V.D., A.K. and K.K.; formal analysis, Q.V.D. and K.K.; investigation, Q.V.D. and K.K.; writing—original draft preparation, Q.V.D. and K.K.; writing—review and editing, Q.V.D., A.K. and K.K.; supervision, Q.V.D.; project administration, Q.V.D. All authors have read and agreed to the published version of the manuscript.
Funding
This research was funded by the European Commission and the French National Research Agency (ANR).
Institutional Review Board Statement
Not applicable.
Informed Consent Statement
Not applicable.
Data Availability Statement
Not applicable.
Acknowledgments
The authors are pleased to acknowledge the generous financial support of the European Commission and the French National Research Agency (ANR) for the project Mind the Water Cycle Gap: Innovating Water Management Optimisation Practice (IN-WOP), which made this work possible. The authors are indebted to the UMR G-EAU–INRAE, Montpellier for providing space, facilities, and technical and administrative support for this research. The authors’ deepest gratitude also goes to the anonymous reviewers for their thoughtful comments and suggestions that have helped improve this paper considerably.
Conflicts of Interest
The authors declare no conflict of interest. The funders had no role in the design of the study, collection, analyses, or interpretation of data, writing of the manuscript, or decision to publish the results.
References
- Adeloye, A.J.; Dau, Q.V. Hedging as an adaptive measure for climate change induced water shortage at the Pong reservoir in the Indus Basin Beas River, India. Sci. Total Environ. 2019, 687, 554–566. [Google Scholar] [CrossRef]
- Zeng, X.; Hu, T.; Cai, X.; Zhou, Y.; Wang, X. Improved dynamic programming for parallel reservoir system operation optimization. Adv. Water Resour. 2019, 131, 103373. [Google Scholar] [CrossRef]
- Oliveira, R.; Loucks, D.P. Operating rules for multireservoir systems. Water Resour. Res. 1997, 33, 839–852. [Google Scholar] [CrossRef]
- Labadie, J.W. Optimal operation of multireservoir systems: State-of-the-art review. J. Water Resour. Plan. Manag. 2004, 130, 93–111. [Google Scholar] [CrossRef]
- McMahon, T.A.; Adeloye, A. Water Resources Yield; Water Resources Publications: Littleton, CO, USA, 2005. [Google Scholar]
- Yeh, W.W.-G. Reservoir management and operations models: A state-of-the-art review. Water Resour. Res. 1985, 21, 1797–1818. [Google Scholar] [CrossRef]
- Cuvelier, T.; Archambeau, P.; Dewals, B.; Louveaux, Q. Comparison between robust and stochastic optimisation for long-term reservoir management under uncertainty. Water Resour. Manag. 2018, 32, 1599–1614. [Google Scholar] [CrossRef]
- Loucks, D.P.; Stedinger, J.R.; Haith, D.A. Water Resource Systems Planning and Analysis; Prentice-Hall: Hoboken, NJ, USA, 1981. [Google Scholar]
- Maass, A.; Hufschmidt, M.M.; Dorfman, R.; Thomas, H.A., Jr.; Marglin, S.A.; Fair, G.M. Design of Water-Resource Systems; Harvard University Press: Cambridge, MA, USA, 1962. [Google Scholar]
- Ghimire, B.N.S.; Reddy, M.J. Optimal reservoir operation for hydropower production using particle swarm optimization and sustainability analysis of hydropower. ISH J. Hydraul. Eng. 2013, 19, 196–210. [Google Scholar] [CrossRef]
- Neelakantan, T.R.; Sasireka, K. Hydropower reservoir operation using standard operating and standard hedging policies. Int. J. Eng. Technol. 2013, 5, 1191–1196. [Google Scholar]
- Stedinger, J.R. The performance of LDR models for preliminary design and reservoir operation. Water Resour. Res. 1984, 20, 215–224. [Google Scholar] [CrossRef]
- Neelakantan, T.R.; Pundarikanthan, N.V. Hedging rule optimisation for water supply reservoirs system. Water Resour. Manag. 1999, 13, 409–426. [Google Scholar] [CrossRef]
- Rittima, A. Hedging policy for reservoir system operation: A case study of mun bon and lam chae reservoirs. Kasetsart J. Nat. Sci. 2009, 43, 833–842. [Google Scholar]
- Bertoni, F. Advancing joint design and operation of water resources systems under uncertainty. In Special Topics in Information Technology. SpringerBriefs in Applied Sciences and Technology; Geraci, A., Ed.; Springer: Berlin/Heidelberg, Germany, 2021. [Google Scholar] [CrossRef]
- Uysal, G.; Schwanenberg, D.; Alvarado-Montero, R.; Şensoy, A. Short term optimal operation of water supply reservoir under flood control stress using model predictive control. Water Resour. Manag. 2018, 32, 583–597. [Google Scholar] [CrossRef]
- Antonik, P.; Massar, S.; Duport, F. Advanced Reservoir Computers: Analogue Autonomous Systems and Real Time Control. In Photonic Reservoir Computing: Optical Recurrent Neural Networks; Brunner, D., Soriano, M., Van der Sande, G., Eds.; De Gruyter: Berlin, Germany; Boston, MA, USA, 2019; pp. 205–258. [Google Scholar] [CrossRef]
- Amini, S.; Mohaghegh, S. Application of machine learning and artificial intelligence in proxy modeling for fluid flow in porous media. Fluids 2019, 4, 126. [Google Scholar] [CrossRef]
- Faber, B.A.; Harou, J.J. Multi-objective optimization of reservoir systems using HEC-ResPRM. Restoring Our Nat Habitat. In Proceedings of the 2007 World Environmental and Water Resources Congress, Tampa, FL, USA, 15–19 May 2007; pp. 1–14. [Google Scholar]
- Leta, M.K.; Demissie, T.A.; Tränckner, J. Optimal operation of Nashe hydropower reservoir under land use land cover change in Blue Nile River Basin. Water 2022, 14, 1606. [Google Scholar] [CrossRef]
- Eschenbach, E.A.; Magee, T.; Zagona, E.; Goranflo, M.; Shane, R. Goal programming decision support system for multiobjective operation of reservoir systems. J. Water Resour. Plan. Manag. 2001, 127, 108–120. [Google Scholar] [CrossRef]
- Zagona, E.A.; Fulp, T.J.; Shane, R.; Magee, T.; Goranflo, H.M. Riverware: A generalized tool for complex reservoir system modeling. J. Am. Water Resour. Assoc. 2001, 37, 913–929. [Google Scholar] [CrossRef]
- Labadie, J.W. MODSIM: Decision support system for integrated river basin management. In International Congress on Environmental Modelling and Software; Brigham Young University: Provo, UT, USA, 2006; p. 242. [Google Scholar]
- Schwanenberg, D.; Fan, F.M.; Naumann, S.; Kuwajima, J.I.; Montero, R.A.; Reis, A.d.R. Short-term reservoir optimization for flood mitigation under meteorological and hydrological forecast uncertainty. Water Resour. Manag. 2015, 29, 1635–1651. [Google Scholar] [CrossRef]
- Hirsch, R.M.; Cohon, J.L.; ReVelle, C.S. Gains from joint operation of multiple reservoir systems. Water Resour. Res. 1977, 13, 239–245. [Google Scholar] [CrossRef]
- Clark, E.J. New York control curves. J. Am. Water Work. Assoc. 1950, 42, 823–827. [Google Scholar]
- Bower, T.B.; Hufschmidt, M.M.; Reedy, W.W. Operating procedures: Their role in the design of water-resource systems by simulation analyses. In Design of Water Resources Systems; Maass, A., Hufschmidt, M.M., Dorfman, R., Thomas, H.A., Marglin, S.A., Fair, G.M., Eds.; Havard University Press: Cambridge, MA, USA, 1962; pp. 443–458. [Google Scholar]
- Edirisinghe, N.C.P.; Patterson, E.I.; Saadouli, N. Capacity planning model for a multipurpose water reservoir with target-priority operation. Ann. Oper. Res. 2000, 100, 273–303. [Google Scholar] [CrossRef]
- Young, G.K. Finding reservoir operating rules. J. Hydraul. Div. 1967, 93, 297–322. [Google Scholar] [CrossRef]
- Kennedy, J.; Eberhart, R. Particle swarm optimization. In Proceedings of the ICNN’95—International Conference on Neural Networks, Perth, WA, Australia, 27 November 1995–1 December 1995. [Google Scholar]
- Ma, Y.; Zhong, P.; Xu, B.; Zhu, F.; Lu, Q.; Han, W. Spark-based parallel dynamic programming and particle swarm optimization via cloud computing for a large-scale reservoir system. J. Hydrol. 2021, 598, 126444. [Google Scholar] [CrossRef]
- Chen, H.; Wang, W.; Chen, X.; Qiu, L. Multi-objective reservoir operation using particle swarm optimization with adaptive random inertia weights. Water Sci. Eng. 2020, 13, 136–144. [Google Scholar] [CrossRef]
- Dahmani, S.; Yebdri, D. Hybrid algorithm of particle swarm optimization and grey wolf optimizer for reservoir operation management. Water Resour. Manag. 2020, 34, 4545–4560. [Google Scholar] [CrossRef]
- Holland, J.H. Adaptation in natural and artificial Systems: An introductory analysis with applications to biology, control and artificial Intelligence. In Complex Adaptive Systems; MIT Press: Cambridge, MA, USA, 1992. [Google Scholar]
- Ren, M.; Zhang, Q.; Yang, Y.; Wang, G.; Xu, W.; Zhao, L. Research and application of reservoir flood control optimal operation based on improved genetic algorithm. Water 2022, 14, 1272. [Google Scholar] [CrossRef]
- Anand, J.; Gosain, A.K.; Khosa, R. Optimisation of multipurpose reservoir operation by coupling Soil and Water Assessment Tool (SWAT) and Genetic Algorithm for optimal operating policy (case study: Ganga River Basin). Sustainability 2018, 10, 1660. [Google Scholar] [CrossRef]
- Mathur, Y.; Nikam, S. Optimal reservoir operation policies using genetic algorithm. Int. J. Eng. Technol. 2009, 1, 184–187. [Google Scholar] [CrossRef]
- McCulloch, W.S.; Pitts, W. A logical calculus of the ideas immanent in nervous activity. Bull. Math. Biophys. 1943, 5, 115–133. [Google Scholar] [CrossRef]
- Zhang, D.; Lin, J.; Peng, Q.; Wang, D.; Yang, T.; Sorooshian, S.; Liu, X.; Zhuang, J. Modeling and simulating of reservoir operation using the artificial neural network, support vector regression, deep learning algorithm. J. Hydrol. 2018, 565, 720–736. [Google Scholar] [CrossRef]
- Shaw, A.R.; Sawyer, H.S.; LeBoeuf, E.J.; McDonald, M.P.; Hadjerioua, B. Hydropower optimization using artificial neural network surrogate models of a high-fidelity hydrodynamics and water quality model. Water Resour. Res. 2017, 53, 9444–9461. [Google Scholar] [CrossRef]
- Shaikh, S.A. Application of artificial neural network for optimal operation of a multi-purpose multi-reservoir system, I: Initial solution and selection of input variables. Sustain. Water Resour. Manag. 2020, 6, 60. [Google Scholar] [CrossRef]
- Zhao, T.; Cai, X.; Lei, X.; Wang, H. Improved dynamic programming for reservoir operation optimization with a concave objective function. J. Water Resour. Plan. Manag. 2012, 138, 590–596. [Google Scholar] [CrossRef]
- Chaleeraktrakoon, C.; Kangrang, A. Dynamic programming with the principle of progressive optimality for searching rule curves. Can. J. Civ. Eng. 2007, 34, 170–176. [Google Scholar] [CrossRef]
- Li, C.; Zhou, J.; Ouyang, S.; Ding, X.; Chen, L. Improved decomposition–coordination and discrete differential dynamic programming for optimization of large-scale hydropower system. Energy Convers. Manag. 2014, 84, 363–373. [Google Scholar] [CrossRef]
- Azevedo, A.T.; Oliveira, A.R.L.; Soares, S. Interior point method for long-term generation scheduling of large-scale hydrothermal systems. Ann. Oper. Res. 2009, 169, 55–80. [Google Scholar] [CrossRef]
- Kumar, D.N.; Baliarsingh, F. Folded dynamic programming for optimal operation of multireservoir System. Water Resour. Manag. 2003, 17, 337–353. [Google Scholar] [CrossRef]
- Curie, F.; Ducharne, A.; Bendjoudi, H.; Billen, G. Spatialization of denitrification by river corridors in regional-scale watersheds: Case study of the Seine river basin. Phys. Chem. Earth Parts A/B/C 2011, 36, 530–538. [Google Scholar] [CrossRef]
- Dorchies, D.; Thirel, G.; Jay-Allemand, M.; Chauveau, M.; Dehay, F.; Bourgin, P.-Y.; Thépot, R. Climate change impacts on multi-objective reservoir management: Case study on the Seine River basin, France. Int. J. River Basin Manag. 2014, 12, 265–283. [Google Scholar] [CrossRef]
- Bellman, R.E.; Dreyfus, S.E. Applied Dynamic Programming. Princeton University Press: Princeton, NJ, USA, 1962. [Google Scholar]
- Bellman, R.E. Dynamic Programming; Princeton University Press: Princeton, NJ, USA, 1957. [Google Scholar]
- Larson, R.E.; Keckler, W.G. Applications of dynamic programming to the control of water resource systems. Automatica 1969, 5, 15–26. [Google Scholar] [CrossRef]
- Meylan, P.; Favre, A.C.; Musy, A. Predictive Hydrology: A Frequency Analysis Approach; CRC Press: Boca Raton, FL, USA, 2012. [Google Scholar]
- Giuliani, M.; Herman, J.D.; Quinn, J.D. Kirsch-Nowak Streamflow Generator. Available online: https://github.com/julianneq/Kirsch-Nowak_Streamflow_Generator (accessed on 21 November 2022).
- Bader, J.-C.; Dorchies, D. Calcul des Limites de Volumes d’eau à Respecter Dans des Réservoirs Implantés en Parallèle sur un Réseau Hydrographique, Pour Permettre la Meilleure Satisfaction Future d’un Objectif Commun de Gestion à L’aval (Soutien D’étiage ou Laminage de Crue): Logiciel VGEST—Application au Cas du Bassin de la Seine (Amélioration et Extension de la Méthode Précédemment Développée Dans le Cadre du Programme Climaware). AP: Autres Productions. IRD. 2016, Montpellier. Available online: https://www.documentation.ird.fr/hor/fdi:010070461 (accessed on 12 August 2022).
Figure 1.
Map of the Seine River Basin, France.

Figure 2.
Historical mean monthly inflow and release from the four large reservoirs located in the Seine River Basin between 1900 and 2009.
Figure 2.
Historical mean monthly inflow and release from the four large reservoirs located in the Seine River Basin between 1900 and 2009.

Figure 3.
Schematic of inline and bypass reservoir systems.

Figure 4.
Basic steps for the application of the optimization and simulation approach for searching optimal operation of reservoir systems.
Figure 4.
Basic steps for the application of the optimization and simulation approach for searching optimal operation of reservoir systems.

Figure 5.
The plots of proportions of (a) expected inflow to each reservoir and (b) allocated water from each reservoir.
Figure 5.
The plots of proportions of (a) expected inflow to each reservoir and (b) allocated water from each reservoir.

Figure 6.
Proposed optimal upper and lower rule curves for four major reservoirs located in the Seine River Basin based on the threshold of 950 m3/s and 81 m3/s at the Paris gauging station, respectively.
Figure 6.
Proposed optimal upper and lower rule curves for four major reservoirs located in the Seine River Basin based on the threshold of 950 m3/s and 81 m3/s at the Paris gauging station, respectively.


Table 1.
Main features of large reservoirs in the Seine River Basin.
| Elements | Pannecière | Seine | Aube | Marne |
|---|---|---|---|---|
| Type of reservoir | Inline | Bypass | Bypass | Bypass |
| Water surface area (km2) | 5.2 | 23.2 | 23.2 | 28 |
| Catchment area (km2) | 220 | 2380 | 1650 | 2900 |
| Maximum dam height (m) | 49.0 | 25.0 | 22.5 | 20.0 |
| Crest length (m) | 352 | 5700 | 3500 | 20,300 |
| Gross storage capacity (MCM) | 82.5 | 219.5 | 183.5 | 364.5 |
| Live storage capacity (MCM) | 74.0 | 212.9 | 181.2 | 354.5 |
| Dead storage capacity (MCM) | 8.5 | 6.6 | 2.3 | 10.0 |
Table 2.
Monitoring downstream stations of the Seine River Basin, France.
| Monitoring Station | River | Impact | Low Flow Thresholds (m3/s) | High Flow Thresholds (m3/s) | |||||
|---|---|---|---|---|---|---|---|---|---|
| Vigilance | Alert | Reinforced Alert | Crisis | Vigilance | Regular | Exceptional | |||
| Arcis-sur-Aube | Aube | A | 6.3 | 5 | 4 | 3.5 | 110 | 260 | 400 |
| Mery-sur-Seine | Seine | S | 7.3 | 5 | 4 | 3.5 | 140 | 170 | 400 |
| Nogent-sur-Seine | Seine | A + S | 25 | 20 | 17 | 16 | 180 | 280 | 420 |
| Gurgy | Yonne | P | 14 | 12.5 | 11 | 9.2 | 220 | 340 | 400 |
| Courlon-sur-Yonne | Yonne | P | 23 | 16 | 13 | 11 | 550 | 700 | 900 |
| Alfortvile | Seine | A + S + P | 64 | 48 | 41 | 36 | 850 | 1200 | 1400 |
| Chalons-sur-Marne | Marne | M | 12 | 11 | 9 | 8 | 330 | 520 | 700 |
| Noisiel | Marne | M | 32 | 23 | 20 | 17 | 350 | 500 | 650 |
| Paris | Seine | A + S + P + M | 81 | 60 | 51 | 45 | 950 | 1600 | 2000 |
Note: A = Aube, M = Marne, P = Pannecière, S = Seine.
Disclaimer/Publisher’s Note: The statements, opinions and data contained in all publications are solely those of the individual author(s) and contributor(s) and not of MDPI and/or the editor(s). MDPI and/or the editor(s) disclaim responsibility for any injury to people or property resulting from any ideas, methods, instructions or products referred to in the content. |
© 2023 by the authors. Licensee MDPI, Basel, Switzerland. This article is an open access article distributed under the terms and conditions of the Creative Commons Attribution (CC BY) license (https://creativecommons.org/licenses/by/4.0/).
Share and Cite
MDPI and ACS Style
Dau, Q.V.; Kangrang, A.; Kuntiyawichai, K. Probability-Based Rule Curves for Multi-Purpose Reservoir System in the Seine River Basin, France. Water 2023, 15, 1732. https://doi.org/10.3390/w15091732
AMA Style
Dau QV, Kangrang A, Kuntiyawichai K. Probability-Based Rule Curves for Multi-Purpose Reservoir System in the Seine River Basin, France. Water. 2023; 15(9):1732. https://doi.org/10.3390/w15091732
Chicago/Turabian StyleDau, Quan Van, Anongrit Kangrang, and Kittiwet Kuntiyawichai. 2023. "Probability-Based Rule Curves for Multi-Purpose Reservoir System in the Seine River Basin, France" Water 15, no. 9: 1732. https://doi.org/10.3390/w15091732
Note that from the first issue of 2016, this journal uses article numbers instead of page numbers. See further details here.