

Adapted Water Quality Indices: Limitations and Potential for Water Quality Monitoring in Africa
by
 , , , and
Dorothy Khasisi Lukhabi
1,2,*,
Paul Kojo Mensah
2,3,
Noble Kwame Asare
1,2,
Tchaka Pulumuka-Kamanga
1,2 and
Kennedy Ochieng Ouma
4,5 1
Africa Centre of Excellence in Coastal Resilience (ACECoR), University of Cape Coast, Cape Coast 00223, Ghana
2
Department of Fisheries and Aquatic Sciences, School of Biological Sciences, University of Cape Coast, Cape Coast 00233, Ghana
3
Institute for Water Research, Rhodes University, Makhanda 6140, South Africa
4
Department of Zoology and Aquatic Sciences, School of Natural Resources, The Copperbelt University, Kitwe P.O. Box 21692, Zambia
5
Africa Centre of Excellence for Sustainable Mining (ACESM), The Copperbelt University, Kitwe P.O. Box 21692, Zambia
*
Author to whom correspondence should be addressed.
Water 2023, 15(9), 1736; https://doi.org/10.3390/w15091736
Submission received: 21 March 2023
/
Revised: 21 April 2023
/
Accepted: 25 April 2023
/
Published: 30 April 2023
(This article belongs to the Special Issue Water Quality for Sustainable Development)
Abstract
:A Water Quality Index (WQI) is a tool that describes the overall water quality by combining complex and technical water quality information into a single meaningful unitless numerical value. WQIs predict water quality since they reflect the impact of multiple Water Quality Parameters (WQPs) and allow for spatial-temporal comparison of water quality status. Most African countries employ adapted WQIs by modifying the original index (or indices) and propose their concepts for evaluating the quality of surface and groundwater, which is normally accompanied by irregularities. The current review examined the process(es) involved in WQI modifications for monitoring water quality in Africa, explored associated limitations, and suggested areas for improvement. A review of 42 research articles from five databases in the last ten years (2012–2022) was conducted. The findings indicated Weighted Arithmetic (WAWQI) and the Canadian Council of Ministers of Environment (CCMEWQI) as the most adapted WQIs. However, several limitations were encountered in WQI developmental steps, mainly in parameter selection and classification schemes used for the final index value. Incorporation of biological parameters, use of less subjective statistical methods in parameter selection, and logical linguistic descriptions in classification schemes were some recommendations for remedying the limitations to register the full potential of adapted WQIs for water quality monitoring in Africa.
1. Introduction
The destruction of natural resources, especially the contamination of aquatic habitats, has been hastened by continued worldwide population increase and socio-economic development. The quality of surface water has been and continues to be impaired by the increased discharge of physical, chemical, and biological contaminants in water sources, which also stresses aquatic life [1]. These contaminants either come from non-point sources (such as surface runoff, airborne contaminants, and sewage outflows), point sources (such as industries and direct effluent disposal), and/or hydro-morphological sources (such as those related to natural processes and human activities including water abstraction). Therefore, it is essential to develop a management strategy to reduce any potential threats to aquatic life and public health in light of the sources of contaminants in aquatic ecosystems. The amount and nature of contaminants present in water should be considered when deciding whether it is suitable for any usage (drinking, irrigation, recreation, habitat for aquatic life, industrial operations, etc.). Normally, these contaminants are expressed using contamination parameters [2] defined in water quality indices WQIs.
A WQI is a tool that describes the overall water quality by combining or summarizing complex and technical water quality information into a single unitless numerical value [3,4,5]. Therefore, WQIs are used to predict water quality status since they reflect the overall impact of multiple WQPs and allow for comparing water quality status across time and space [6]. Specifically, WQIs are used to: (i) communicate information about water quality to the general public, policymakers, and non-water experts in a straightforward manner [7] and (ii) improve the understanding of general water quality issues by stakeholders in the decision-making process.
1.1. Development of a WQI
The development of most WQIs involves the following four fundamental steps: (i) Parameter selection; (ii) Estimation of sub-index values for parameter comparison on a common scale; (iii) Weighting of parameters based on their relative significance to the overall water quality; and (iv) Formulation and computation of the overall index [8]. Selecting the right water quality parameters under specific environmental conditions is the most challenging of the four steps [9]. A comprehensive analysis of WQI development steps is provided in the later sections of this review. To reduce biases and select the right number and types of parameters, two approaches have been proposed that eventually yield different classes of indices. These are (1) approaches that rely on expert opinion (Rand Corporation’s Delphi Technique) and (2) statistical-based approaches [10]. Using the premise that “Two heads are better than one”, the Delphi approach elicits and refines a group’s judgment. It was first developed by “The Rand Corporation” in the USA. It included three basic features: anonymous responses, repetitive and controlled feedback, and a group response (an appropriate aggregate of individual opinions on the final round).
Although the features mentioned above are designed to reduce the biasedness of dominant individuals, irrelevant communication, and groups’ pressure towards conformity, the final WQI value is subjective primarily because it is solely based on the advice of consulted experts [3]. Some indices have been developed through such expert opinion, for example, the NSFWQI [11], a public index used to monitor general water quality, Oregon and British Columbia WQI [12], and the WQI by Hallock and Ehinger [13] a planning index used as a decision-making tool for designing water quality management projects. On the other hand, statistical-based approaches aim to lessen subjectivity and increase the accuracy of the final index. Principal Component Analysis (PCA), Discriminant Analysis (DA), Cluster Analysis (CA), and Factor Analysis (FA) are some of the multivariate techniques employed [14]. Table 1 provides a summarised history of WQI development along with the progress of each step in a chronological manner.
1.2. Application of WQIs: The African Perspective
The concept of indexing water using a numerical value based on biological, physical, and chemical parameters dates back to the mid-20th century when the first WQI was developed in the United States [15] and applied in the UK and Europe in the 1970s and later in Africa and Asia [28]. Since then, there has been significant improvement and modification to existing indices as well as the development of new models. Some of the available WQIs include the Scatter score index [29], Index of River Water Quality [30], Overall Index of Pollution [31], Chemical WQI [32], Universal WQI [9], CCMEWQI [23], NSFWQI [33] Oregon WQI [20], and Weighted Arithmetic WQI [34]. These and many other WQIs have been developed with global and regional applicability. However, the most commonly used and applied indices are the NSFWQI, CCMEWQI, and WAWQI, according to reviews of WQIs by Aljanabi and Jawad [1] Poonam et al. [7] and Tyagi et al. [8].
The methodology for developing the NSFWQI was purely based on expert opinion in parameter selection and sub-indices assignment. Out of 35 possible parameters from which 142 experts were expected to select, only nine were selected for index construction [11]. This indexing is easily communicable to non-water experts, while the single index value obtained is considered objective and reproducible [35]. However, the index only represents general water quality and has a high data loss rate. Furthermore, since it is implemented with only nine input parameters, any additional parameters require extra effort and careful consideration [36]. Due to this, the index has found limited applicability, especially in Africa, with only Nigeria adapting and applying it to assess drinking water quality as applied by Kalagbor et al. [37].
The CCMEWQI was incepted in 2001 for use within the Canadian jurisdiction. It comprises three factors: Factor 1 (F1) deals with a scope that assesses the extent of water quality guidelines for non-compliance over the stipulated period. Factor 2 (F2) deals with frequency, i.e., how often the observed value was off the acceptable limits. Factor 3 (F3) deals with the amplitude of deviation or the amount by which the objectives are not met.
This index is flexible in the selection of input parameters and involves simple calculation processes. The calculation formulae involved in the final index computation for CCMEWQI are comprehensively discussed in later sections of this review. Due to its flexibility in adapting to various WQPs and legal requirements by water agencies in different countries with little modifications [38], the index has found both global and regional applicability. For example, in North Africa, the index has been applied in Egypt to monitor surface water for irrigation purposes [39] and evaluate water to protect aquatic systems [39,40]. In Ghana and West Africa, the CCME index was used to assess the surface water quality of Aby Lagoon for the protection of aquatic life [41], while river water for domestic use was also assessed [42].
Furthermore, in East Africa, the CCME index has been applied to test the suitability of groundwater for drinking around Lake Victoria goldfields of northwestern Tanzania [43]. However, despite the versatile applicability, this index applies similar importance to all parameters, is highly subjective, and does not provide guidelines about the objectives specific to each location and particular water use [44]. In addition, the index calculation does not involve sub-index generation for the parameters, establishment of weights, and classical index aggregation [23].
The WAWQI is overly calculated by linearly aggregating the sub-index values with the unit weight. However, with its methodology being modified over time, the WAWQI is among the top three indices universally used since adjustments can be made depending on the parameters in place and system status. Furthermore, the WAWQI is the only index among all specific use indices requiring the least parameters [8]. It is also suitable for assessing ground and surface water for human consumption [45]. As a result, the index has been extensively applied in Africa.
In North Africa, several authors have employed WAWQI in the evaluation of groundwater for drinking purposes, for example, in Libya [46] and Egypt [47,48] as well as in Tunisia for irrigation and protection of aquatic life [49]. Also, this index has been embraced in East Africa to examine surface and groundwater for various uses. In Kenya, lake and river water were assessed for their ability to cause human health risks [50,51] while the potability of river water was investigated for use [52,53]. Likewise, WAWQI has been applied by Teshome [54] and Berhe [55] to examine the appropriateness of surface water for human use in Ethiopia. Many studies have been performed in West Africa using WAWQI, especially in Nigeria. Both surface and groundwater have been appraised for drinking and other domestic purposes [56,57,58,59,60].
It has also been used in Ghana to assess river and dam water portability for drinking [61,62] and groundwater suitability for drinking and other domestic uses [63]. Aside from Nigeria and Ghana, a study involving WAWQI was documented in Chad, where the suitability of groundwater as drinking water was established [64]. However, despite the wide application, this index cannot meet many uses of the water quality data. At the same time, some water quality parameters may not be included in the overall index [56].
In South Africa, new methodologies have been proposed to establish the applicability of surface water for various purposes besides adapting the existing WQI models. Among the new models are the Equitable raw water pricing model [12], UWQI for South African river catchments [65], and Surrogate WQI for South African watersheds [66]. In addition, similar to other African regional blocs, the fitness of both surface and groundwater has been assessed for drinking and domestic purposes using both WAWQI [67,68,69,70,71] and CCME WQI [72], respectively.
From the above discourse, it is apparent that there exists a tendency to use WQIs adapted from developing countries in Europe and the Americas. The WQI adaptation process is by modifying the original WQIs and proposing their use in evaluating the surface and groundwater quality. Notably, WQIs are developed for a given location and are source-specific. However, despite that fact, it is generally acceptable to adapt and modify WQIs in compliance with varied regulatory criteria for water agencies in different nations [73].
However, before modifying an index for use, it is important to comprehend its development and relationship to local contexts. This evaluation pertains to the initial factors that supported its construction, as represented by WQPs [74], and their applications [22]. If this is not considered, the index picks up irregularities, including ambiguity, rigidity, and eclipsing. Because sub-index values for all WQPs are obtained differently, ambiguous indices suggest worse water quality than expected. Rigid indices, on the other hand, are not adaptable enough to include extra or substitute WQPs. Rigidity happens when impairment develops in a parameter excluded from the WQI or when an index is used in a setting with different usage objectives for which it was designed [75]. Lastly, eclipsing issues frequently arise when a low sub-index value is concealed by a high overall WQI value [27]. From the African perspective, WQIs have been adapted to address various societal purposes guided by the different water uses. The current review, therefore, examined how WQIs have been modified and adapted for monitoring water quality in Africa. Additionally, it explored limitations in the modified WQIs and suggested areas for improvement for their application and full potential to be realized.
2. Materials and Methods
Data Sources, Inclusion and Exclusion Criteria, Analyses
Articles were collected and analysed between March 2021 and June 2022 from five electronic databases: ScienceDirect, Springer, Google Scholar, ResearchGate, and semantic scholar. The search keywords included: “water quality index”, “Africa”, “surface water”, and “groundwater” for the past ten years. Only studies that evaluated water quality using the original WQI of another author or authors incorporating physical, chemical, and microbiological parameters were included. The different modification approaches included replacing the type and/or quantity of WQPs, modification of either of the developmental steps and changing the application or usage of the WQI. Articles that developed a new WQI approach were excluded because the objective of the review was to explore adapted WQI and not original models. MS Excel 2019 was used for graphic presentations, Sigma Plot v.14 for descriptive statistics, and Xlstat 2019 v.2.2 for multivariate analysis to identify the most popular WQP combinations and average linkage between the WQPs as used by authors.
3. Results and Discussion
Figure 1 displays the flowchart of how articles were located, evaluated, and selected. The five databases produced a total of 165 articles. Forty-two articles were included in this study to eliminate duplications.
The reviewed articles were a collection from 12 African countries (Figure 2), with Nigeria recording the highest number of modified WQIs—Tanzania, Mozambique, Libya, Chad, Tunisia, and Namibia, with the least.
The CCMEWQI was adapted by eight articles, including [39,40,41,42,43,71,77], whereas the WAWQI was adapted by 34 articles, including [49,50,62,67,78,79,80,81,82]. The three developmental steps used by the articles that adapted CCMEWQI were the Scope (F1), Frequency (F2), and Amplitude (F3) calculations. On the other hand, those that adapted the WAWQI followed the four main aforementioned developmental steps. From parameter selection, the generation of parameter sub-indices (step 2) and assignment of parameter weights (step 3) was done interchangeably depending on the author’s preference before the final computation of the WQI using an aggregation function (Figure 3).
Based on the overall index value, the water quality was rated using a categorisation scheme [83]. About 66.7, 28.6, and 4.7% of the articles focused on surface water [39,40,41,42,59,68,69,70,71], groundwater [48,49,63,81,82,84], and a combination of both surface and groundwater [58,80,85,86,87] respectively. The types and extent of the various societal needs addressed by the articles are shown in Figure 4. More than half of the reviewed articles addressed water for drinking purposes.
3.1. Parameter Selection Criteria in the Adapted WQIs
From the articles reviewed, 65 WQPs were identified. On average, the articles focused on 14 WQPs with a minimum of 4 and a maximum of 24, which examined the quality of swimming pool water for bathing [87] and the applicability of lake water for irrigation [39] respectively. It has been affirmed that various physical, chemical, and biological factors influence the level of contamination in a specific aquatic system [7]. These categories were employed by authors in the current investigation and are detailed in Table 2.
With the input of a panel of 142 experts, the original WAWQI used the Delphi technique to determine the parameters used for index development [11]. In the reviewed articles, parameter selection was at the authors’ discretion based on their relevance to water quality. With 57% of articles focusing on water for drinking purposes, the parameters selected included in situ physicochemical parameters, nutrients, heavy metals, faecal indicator bacteria, and organic matter. For other domestic uses, stable isotopes 2-H and 18-O parameters selected for drinking water were also added while exempting colour, alkalinity, total acid, and faecal indicator bacteria. For irrigation purposes, similar parameters to those of drinking water were used with the addition of SAR, RSC, MAR, and TF, excluding the stable isotopes. Physical parameters, nutrients, and heavy metals were considered in water to protect aquatic life and recreation. However, for recreation purposes, heavy metals were excluded as E. coli was included (Table 3).
It is noteworthy that given the resource constraints with infrastructure, human capital, and financial resources in most regions of Africa, chemical parameters, especially heavy metals, were prioritised, followed by physical parameters and nutrients for societal needs. The original general use of WAWQI established nine fixed WQPs: DO, FC, pH, BOD, temperature, TP, TN, turbidity, and TS [11]. However, out of the 65 WQPs utilised in the current review, pH (88.1%), Cl− (81%), EC (73.8%), NO3-N (6%), TDS (66.7%), Ca2− (66.7%), Mg2+ (64.3%), (57.1%), Na+ (47.6%), and HCO3− (42.9%) were the ten most often used WQPs in water quality analysis. Only pH from the original nine recommended parameters appeared in the ten most popular WQPs in the adapted indices. This may be related to location-specific dimensions [10], allocation, and usage [3]. Additionally, the difference in parameters selected between the original WAWQI and adapted ones can only be interpreted, considering that the original index was designed for the USA.
Furthermore, the original WAWQI was developed with a fixed set of WQPs. There is, therefore, a high likelihood that the final index scores in the reviewed articles faced the effects associated with parameter modification caused by index rigidity [75]. However, the initial CCMEWQI was designed with a minimum of four WQPs and no upper limit [1]. The current study discovered that the eight articles that adapted CCMEWQI to construct their WQIs employed between 7 [1] and 24 [39] parameters. Since CCMEWQI offers the ability to incorporate more parameters based on existing environmental quality guidelines and local circumstances, the choice of the quantity of WQPs selected in the adapted WQIs was justifiable. Yet, to calculate index values, four of the selected WQP must have been sampled at least four times throughout the necessary sampling period [88].
Six of the eight articles in the current analysis showed that sampling was done at least four times—however, refs. [42,43] did not specify the sampling frequency. Also, when only one application needs to be evaluated using CCMEWQI, it is advisable to employ a core set of parameters, such as nutrients, heavy metals, physical parameters, etc. This inclusion is vital because too few parameters or too much covariance between them could enhance or decrease the significance of any one parameter, giving factor F1 (scope) too much weight for determining the final index score [44]. Furthermore, the chosen core set of parameters must also address the significant environmental stress faced by the system to retain the relevance and correctness of the final index [23]. According to the results of the current investigation, only [41] maintained a single core set of parameters (nutrients). Figure 5 and Figure 6 show the WQP utilisation in percentages employed by the author(s) to develop customised WQIs.
Multiple WQPs were clustered to determine the frequently employed pairing by the articles examined (Figure 7). The cluster analysis connected WQPs based on the distance between parameters, and the more dissimilar the parameters were, the larger the distance was between them. All WQPs were grouped into four sub-clusters and two major clusters (Clusters 1 and 2) and (Sub-clusters 1.1, 1.2, 2.1 & 2.2). Cluster 2 was more heterogeneous with more homogeneous characteristics, while Cluster 1 was more homogeneous with a flatter dendrogram. Both clusters had two sub-clusters, with each sub-cluster bearing various combinations.
The following were some of the authors’ more inventive combo uses:
- Combination one; Zn2+, Mn, Cu 2+, Fe, Pb, Cd, Ni, Bo, As, Hg, Al, Se, Mo, and Co with Cr, V, MAR, SAR, and RSC as outliers.
- Combination two; Mg, Ca, Cl−, SO4, HCO3, K+, and Na+ with Eh, Sal, and the stable isotopes as outliers.
- Combination three; COD, DO, BOD, TSS, NH4-N, Temp, E. coli, colour, turbidity, TC, Total fungi, Total Alkalinity, SRP, NO3-N, Total acidity, TS, FC, TDS, Hardness, EC, and pH with outliers like OP, MgH, CaH, Sr, Ti, and U.
Combination one consisted of a cluster of heavy metals associated with groundwater contamination, among other factors. Most of the authors who employed this combination investigated groundwater suitability for drinking, domestic use, or its suitability for irrigation. For example, refs. [49,50]. On the other hand, combination three comprised physicochemical parameters in conjunction with nutrients and faecal indicator bacteria. These are parameters used to assess the ecosystem health of any water body, and almost all the authors included physicochemical parameters and nutrients for all the societal needs addressed. The faecal indicator bacteria parameter was included by authors who investigated water for drinking and recreation since faecal indicator bacteria indicates recent contamination of the system with faecal matter, hence the presence of faecal bacteria.
3.2. Generation of Parameter Sub-Indices
In this developmental step, parameter concentrations and levels are compared on a similar scale and transformed into unit-less sub-index values from different units like ppm, saturation, %, mg/L, and counts [44]. To create sub-indices, one can use expert judgment, water quality standards, and statistical techniques.
3.2.1. Use of Expert Judgment
Judgement can come from a single expert or a team of specialists who create the critical points of rating curves and draw graphs to illustrate each parameter’s effects on water quality at various concentration levels. The graphs are also transformed into linear or non-linear sub-index functions [11].
3.2.2. Use of Water Quality Standards
The developed rating curves are transformed into sub-index functions using the recommended water quality standards. Because the critical points on the graphs are obtained using the recommended values for each particular parameter, this technique is less arbitrary than expert judgment. Sub-index values can be obtained through categorical scaling, linear interpolation rescaling, and comparison with recommended limits. Each recommended limit is allocated to the appropriate water quality class and a matching sub-index in linear interpolation. The sub-indices vary from 0–100 or 0–1, much like the water quality classes listed in a sequence [73]. For illustration.
- (a)
- Recommended standards—20, 30, 40, 80, 120
- (b)
- Sub-index ranges—100, 75, 50, 25, 1
- (c)
- Pairing—class 1 (20–100), class 2 (30–75), class 3 (40–50), class 4 (25–80), and class 5 (1–120) are used. The paired data are the bases for sub-index development since they are the key points of the rating curves. If the actual measured value falls between two classes, the sub-index value is obtained using mathematical equations. For example, Equation (1) is used when a parameter decreases the level of water quality with an increase in the parameter value.
In a case where a parameter increases the level of water quality with an increase in parameter value, Equation (2) is employed.
In categorical scaling, the actual parameter values are converted into sub-index values by using constant values of either 0 or 1. The values 0 or 1 are assigned to parameter levels when concentrations exceed and fall below the recommended standard, respectively. These mathematical functions are essential in this technique.
- (a)
- Si = 0 if xi > recommended standard
- (b)
- Si = 1 if xi < recommended standard
The measured parameter values and the recommended standards are compared from the sub-indices produced based on the established water quality criteria. The values range between 0 and 1, as shown in Equation (3).
where Si is the ith sub-index value, xi is the ith actual parameter value (mg/L); and xmax is the maximum value of the recommended standard (mg/L) [10].
3.2.3. Statistical Methods
Statistical analysis and historical parameter data identify critical points for generating sub-index values. The metrics in question and their consistently measured average values and multiple quantiles are used. The individual sub-index values are multiplied by the parameter weightage values to generate the final index value. This technique has been used by Dunnett and Bhargava indices [10].
3.3. Sub-Index Development in the Adapted Indices
This step was bypassed by the eight WQIs that utilised the CCMEWQI. This procedure follows [23], which developed a multivariate statistical procedure to combine the initial parameter values without sub-indices. In the original WAWQI, respondents were asked to create a rating curve for each of the nine parameters and sub-indices determined by expert judgment [11]. In the current review, all the articles that adapted WAWQI used water quality standards to develop sub-index values by comparing the measured parameters with existing recommended standards, both internationally and locally. The internationally adopted standards were WHO guidelines for drinking water [63]. FAO guidelines for irrigation [39], ANZECC guidelines for the conservation of aquatic areas [77], and WHO standards for swimming pools and similar environments [87] among others. On the other hand, the local standards included but not limited to; SANS241-1:2015 [68], LNCSM [46], and Ghana’s WRC guidelines for domestic use and protection of aquatic life [41], among others.
Going by Equation (4) [30] 61.8%, including [51,62,64,67,68,78,81], among others, assigned a quality rating scale (q1) by dividing the concentration in each water sample with its corresponding standard following the suggested recommendations and multiplying the result by 100.
where qi is the quality rating, Ci is the concentration of each parameter in each water sample in mg/L, Si is the maximum permissible guideline limit for each parameter in mg/L.
On the other hand, 32.4% of articles, including [47,48,54,61,79,80,87], considered using a function that multiplied the result by 100 and included the ideal WQP values in addition to the maximum allowable guidelines, as illustrated in Equation (5).
where vn is the observed value of the nth parameter, vo is the ideal value of the nth parameter in pure water. vo = 0, except for pH = 7.0 and DO = 14.6 mg/L, sn is the recommended standard value of the nth parameter.
3.4. Assignment of Parameter Weights
In essence, parameters are given weighted values based on their relative importance to the overall quality of the water [73]. While some WQI models give each parameter the same weight and see them as equally important to water quality, most WQIs give each parameter an unequal weight while ensuring the sum of all weights equals 1. This weighting approach is appropriate because the overall impact of WQP shouldn’t be greater than 100% [12]. The integrity of the final index score is negatively impacted and is regarded as dysfunctional if improperly conducted, giving a parameter more or less relevance than it deserves. Therefore, care should be taken when assigning unequal parameter weights [83]. This consideration ensures that the final index value reflects the water quality status. There are two approaches to establishing parameter weights: (i) the Delphi Method and (ii) the AHP.
3.4.1. The Delphi Technique
This approach seeks professional judgment from significant players in the water quality field to weigh parameters. They typically base their weightings on environmental relevance, the recommended guideline values, and the application to the particular water body [83]. In certain circumstances, some authors establish parameter weights based on existing values in the literature using a scale of 1–5 [89] or 1–4 to compare the environmental significance of different factors. To achieve relative weightings between 0 and 1 for the least influential and most influential parameters, respectively, all of the ratings are pooled, and their arithmetic mean values are determined by mathematical functions or compared to existing standards [10,90]. This technique was employed in Horton and Brown indices.
3.4.2. AHP
With this multidisciplinary technique, the decision-making process considers both quantitative and qualitative factors [10]. AHP uses pair-wise comparison principles in WQI development, where experts present their preferred option by contrasting many choices from a complex collection of factors [10]. Sutadian et al. [73] have effectively used this technique, which enables the reliability check of the evaluations being made and reduces subjectivity in the decision-making process [83].
3.5. Assignment of Parameter Weights in the Adapted Indices
The parameters in the eight articles that used the CCMEWQI were not assigned weights. This pre-condition is consistent with the original CCMEWQI model, which assumes that all parameters have equal weights and does not call for weight values when predicting the final index score [2]. Brown and his associates applied the Delphi method to the original WAWQI to give parameter weight values. When the respondents’ replies were compiled, the unit weight was summed up to 1, and they were asked to compare the weights of several parameters using a scale of 1 (highest) to 5 (lowest) [11].
Articles that adapted the WAWQI used two approaches to assign weights to parameters; (1) assignment of parameter weighs by the Delphi technique and fitting the values into Equation (6) [47,62,64,68,78,81] and (2) assignment of parameter weights by Delphi technique and fitting values into Equation (7) through the application of a value inverse of recommended guideline [46,61,80,84,87,91,92]. However, parameter weights were assigned in accordance with [11] with a scale of 1 (highest) to 5 (lowest), refs. [47,82] employed a scale of 1 (highest) to 4 (lowest).
where Wi is the unit weight, wi is the weight of each parameter, and n is the number of parameters.
where k is a proportionality constant determined as.
where si is the standard permissible value for the ith parameter.
3.6. Final Computation of the WQI
This last step combines sub-indices and weighted factors from all metrics using various aggregation methods to get a unitless value representing the overall water quality status [10]. The most often utilised are the multiplicative (geometric) and additive (arithmetic) functions [44]. Continuous efforts have been made since the initial WQI to address the shortcomings of earlier aggregating functions. For example, moving from the weighted arithmetic average [11,15] to the weighted geometric average [18], weighted product [90], harmonic mean [74], minimum operator [22], and finally to logarithmic-based functions [93].
The overall WQI is directly impacted by the parameter values in any given aggregation approach. The WQI tends to be zero in geometric average functions if the value of one of the parameters is near zero. Regardless of how the parameters are weighted, indices produced with arithmetic average functions are most frequently affected by extreme values of the parameters (eclipsing) [94]. Weighted arithmetic and weighted geometric averages are thought to be outperformed by the unweighted harmonic square average. This function has been found to reduce the eclipsing effect while accounting for other indicators’ impact by being more sensitive to the most degraded indicators [26]. Although the most recent method uses logarithmic functions, most researchers still use arithmetic or geometric aggregations.
3.7. Aggregation Function for the Adapted CCMEWQI
The original aggregation formula [23] was employed by the eight articles that adopted the CCMEWQI to get the overall index value, which is based on three parameters;
Factor 1 (F1): Scope—assesses the extent of water quality guideline non-compliance during the period of interest.
where variables indicate those WQP with objectives that were tested during the period for the index calculation.
Factor 2 (F2): Frequency represents the mean frequency and number of times the tested or observed value was out of acceptable limits or standards.
Factor 3 (F3): Amplitude—It represents the amount by which the failed test values do not meet their objectives and is calculated in three steps:
- (i)
- Calculation of Excursion
An excursion is the number of times an individual concentration is greater than (or less than, when the objective is a minimum) the objective.
- -
- When the test value must not exceed the objective.
- -
- When the test value must not fall below the objective.
- (ii)
- Calculation of Normalised Sum of Excursions
The normalised sum of excursions, nse, is the collective amount by which individual tests are out of compliance. This value is calculated by summing the excursions of individual tests from their objectives and dividing them by the total number of tests (both those meeting objectives and those not meeting objectives).
- (iii)
- Calculation of F3
F3 is calculated by an asymptotic function that scales the normalized sum of the excursions from objectives to yield a range from 0 to 100.
The WQI is then calculated as follows:
The factor of 1.732 arises because each of the three index factors can range as high as 100. Therefore, the vector length can reach.
= = 173.2 as a maximum. A division using 1.732 reduces the vector length to 100 as a maximum.
3.8. Aggregation Function for the Adapted WAWQI
All 34 articles in this model employed the WA aggregation function to compute the final index value. After weighing the parameters and sub-indices, two approaches were used to calculate WQI.
- (i)
Sli = Wi × qi
where Sli is the sub-index value of the ith parameter, Wi is the relative weight of the ith parameter, n is the number of parameters.
- (ii)
where Qn is the quality rating, Wn is the relative weight, and Wn = 1
3.9. Classification of WQIs and Index Scores
The assignment of final WQI values to classes or categories is known as classification or categorisation. It can be done using one of two sets of categorisation scales: (i) an increasing scale, where the index value rises with the level of contamination, and (ii) a decreasing scale, where the index value falls with the level of contamination. In both instances, the final objective is to express the water quality status by determining the degree of contamination [10]. Classifying WQI values should be based on the public’s expectations for water quality, professional judgment, and the most up-to-date information [23]. Typically, the index values range between 0 and 100. Further, the values are grouped into classes 1 through 5, depending on whether the author employs an increasing or decreasing scale. Table 4 and Table 5 showcases the various WQI developed using increasing and decreasing scales.
3.9.1. Classification of Water Quality in the Adapted WQIs
As shown in Table 4 part a, the original CCMEWQI used the CCME categorisation scheme described in [4,23]. All eight articles that used the CCME WQI followed the same trend. On the other hand, Brown and his colleagues’ original WAWQI plan called for using colour schemes to categorise water quality across the state (Table 6).
All the 34 papers that applied the WAWQI used a decreasing scale to classify their subjects, ranging from 0 to 100 [59,61,79,84,87] in some cases, and 0 to 300 in others, [62,67,68,78,80,81] while [79,91] used 4 and 6 classes respectively. Majority of reviewed articles (approx. 94%) ranked the WQI values in 5 classes. Of the 34, 19 had their final index values classified according to (Table 7 part a following [97]), and 6 (Table 7 part b based on [8]).
3.9.2. Limitations Identified in the Classification Scales of Adapted Indices in Reviewed Articles
In the classification by [97] (Table 7 part a, the final index score may fall within two classes. For instance, a score of 100 could either fall within class 2 (“good”) or class 3 (“poor”), while 200 could fall within class 3 (“poor”) or class 4 (“very poor”). Such a limitation has been reported elsewhere [98]. To solve this shortcoming, ref. [1] modified the CCMEWQI classification scale by minimising the difference between classes to a decimal fraction. In the adapted indices, two articles [47,63] introduced decimal fractions in their classification scheme; <50 (“excellent”), 50–100.1 (“good”), 100–200.1 (“poor”), 200–300.1 (“very poor”), and >300 (“unsuitable for human consumption”). Nevertheless, such a classification scheme still faces the challenge of some scores falling within two classes, like 100 in class 2 (“good”) and class 3 (“poor”), as well as a score of 200 falling between class 3 (“good”) and class 4 (“very poor”). Also, an overlap exists in classes as seen from poor choice of lower and upper limit of values assigned to classes whereby class 2 (“50–100.1”) suggests good water quality compared to class 3 (“100–200.1”) of poor quality. Since 100 is a figure less than 100.1, its quality is expected to be better than that of 100.1 but that is not the case here. The same applies to classes 3 and 4; 100–200.1 (“poor”), 200–300.1 (“very poor”).
The classification by Tyagi and his colleagues makes it impossible for some final index scores to be accommodated. For example, there is no provision for index scores between 25–26, 50–51 and 75–76 unless the index score is rounded off to the nearest whole number. Other works with similar limitations in class-assigning index values have been reported [10,98]. Finally, there is a possibility of a lack of representation for index score values falling below 50 in the scheme used by [61], which runs from 50 to >300, i.e., 50 (“excellent”) 50–100 (“good”) 101–200 (“poor”) 201–300 (“very poor”) >300 (“unsuitable for human consumption”). It can be noted that unless performed carefully, classification schemes will certainly fail to accommodate all the achievable index scores. Despite the dynamic nature of aquatic ecosystems due to the continuous influence of allochthonous and autochthonous factors, a final index value must be attained and categorised. It is, therefore, imperative to introduce logical linguistic descriptions like less than, equal to and greater than to ensure inclusivity of all index scores, as demonstrated in Table 8.
3.10. Potential Solutions to Uncertainties Associated with Adapted Iindices
The concerns center on how differences in a WQI’s developmental stages might impact the ultimate index score. These may arise at any WQI developmental steps, including parameter selection, sub-indexing and weighting [73], and the final aggregation function [22].
3.10.1. Parameter Selection Uncertainties
There are no set criteria or procedures for choosing WQPs to be included in the various WQI models. The researcher could be directed toward the best WQPs to choose by aspects like data accessibility, environmental relevance [101], and use or purpose of the water body [102]. It is important to emphasise that data availability is a significant cause for concern when selecting parameters, especially in developing nations [83]. This is mainly because water quality monitoring programs require much labour and have significant analytical costs. This likely explains why most authors in the examined articles only used the fundamental criteria to assess water quality. Additionally, the inability of researchers to access comprehensive data on water quality is hampered by the lack of contemporary analytical laboratory facilities due to insufficient capital, such as financial assistance and competent human resources [101].
Approximately 80% of the articles in the current review focused on drinking water or water for human use. At the same time, the minority concentrated on recreation, irrigation, protecting aquatic life, and health risk issues. As can be deduced, practically all the authors focusing on drinking water largely prioritised heavy metals with other ancillary parameters, though the list was not exhaustive. Heavy metals, especially in gold mining areas, are a source of environmental contamination and threaten human health. For instance, Pb, Hg, Cd, and As are carcinogenic if they exceed the maximum tolerable upper intake levels [103].
Additionally, Cr, Cu, Zn, and Ni threaten all aquatic inhabitants by disrupting food chains via bioaccumulation—some heavy metals, like Ni nanoparticles, damage liver cells [104]. Furthermore, chronic exposure to Pb may result in mental retardation, congenital disabilities, psychosis, autism, allergies, dyslexia, weight loss, hyperactivity, paralysis, muscular weakness, brain damage, and kidney damage. It may even cause death [105].
On the other hand, Fe in water may chemically bond with free hydrogen radicals, hence attacking DNA cells, leading to mutations and malignant transformations that cause many diseases [106]. In addition, long-term ingestion of water with a high concentration of Zn has been found to cause the death of human brain cells, trauma, and prostate cancer [107]. Sometimes, water samples for drinking may comply with the state or international set standards, especially for physical parameters like colour, odour, and turbidity. However, harmful hazardous, and hardly detectable compounds may also be present due to the universal solvent nature of water. This presents a challenge in analysing each of the chemicals present in water [38]. Therefore, even though it is key to prioritising WQPs, it is important to include data on physical, chemical, biological, and hazardous factors to thoroughly analyze and portray the ideal water quality conditions [108]. None of the articles under consideration used radioactive or hazardous components to assess the water quality.
Additionally, four WQPs were used in the modified indices to evaluate the swimming pool water quality in hotels in Nigeria [87] while at the other extreme, 24 WQPs were chosen to evaluate the appropriateness of surface water for agriculture in Egypt [109]. It should be emphasised that since water quality varies on a wide range of natural and anthropogenic factors, too few parameters may not provide a good picture of the final WQI. Likewise, it is doubtful that all the data from the 24 collected parameters would be readily available in addition to being data of high quality. Although the original CCMEWQI and West Java WQI, which used four and 26 WQPs, respectively, may have been provided as inspiration for the author(s). Considerable care must be taken to ensure that the parameters chosen are just enough, neither too few nor too many [10] and based on the study at hand and end-use objectives [90].
Given resource constraints, it was important to prioritise parameters that directly impacted water quality. These included parameters related to eutrophication, dissolved chemicals, dissolved oxygen levels, physical qualities, and health issues [95]. The relevance of prioritised parameters for whatsoever societal needs cannot be overemphasised. For example, DO concentration is normally used to indicate water quality to the extent that high DO concentrations indicate good water quality. Conversely, low DO concentration could mean reduced organismal growth, disruption of life cycles, migration to avoid poor conditions, and even death of benthic organisms and fish (reviewed in Vaquer-Sunyer and Duarte 2008; cited in [110].
On the other hand, inorganic nutrients (mainly nitrogen and phosphorus) may stimulate the growth of algal blooms causing eutrophication. In addition, nitrites, reduced forms of nitrates, have been proven to cause blue baby syndrome (Methemoglobinemia) in infants after long-term ingestion. Furthermore, physical attributes like suspended solids and turbidity, odour and colour affect water's suitability for domestic uses like washing and drinking. High turbidity may also clog the gills of some benthic macroinvertebrates, causing death.
For microbiological water quality, faecal coliforms (FC) have been conventionally used as indicator organisms for faecal contamination. Some WQI models have been incorporating as part of the WQPs, e.g., ref. [111]. However, WHO commonly accepts E. coli as a better indicator of faecal and microbiological water contamination and recommends using it instead of FC. This is the case where water for drinking purposes is being assessed [112]. In the articles reviewed, where more than three-quarters of articles focused on drinking water, microbiological constituents (TC, FC, TF, and E. coli) accounted for less than 10%, while E. coli alone accounted for only 4.8% of the WQPs used.
Nevertheless, bio-assessments using aquatic organisms such as plankton, macroinvertebrates, and fish have proved to be a fair reflection of the current water quality status and the overall ecosystem health. Unfortunately, this aspect was overlooked in all the reviewed articles. Biological components of water bodies, especially benthic macroinvertebrates, phytoplankton, and microbiota, are therefore highly recommended for integration with physicochemical parameters for adapted WQIs since they can indicate the future direction of the overall aquatic ecosystem health.
3.10.2. Eclipsing, Ambiguity and Rigidity
In additive/arithmetic models, eclipsing—where the total WQI conceals the underlying nature of water quality—is frequent [27]. Eclipsing might result from faulty sub-indexing, weighting, or an inadequate aggregation procedure [22] Ambiguity is a situation where the overall index shows that the water quality is worse than expected based on the sub-index values for all WQPs. Due to how weights are applied and because these indices base their categorisation on the parameter with the greatest impairment, ambiguity is mainly observed in weighted indices [27]. On the other hand, rigidity is the condition in which an index is not adaptable enough to consider new or alternative criteria [75]. It frequently happens when an impairment arises in a parameter or parameters that the index does not consider or when an index is applied to a circumstance where the concerns differ from those for which it was designed [75].
There was a high likelihood of articles that adapted the WAWQI to develop the abovementioned abnormalities. This was owed to the fact that WAWQI is an additive, weighted model and was also employed in a field with distinct concerns from the ones from which it was derived. Additionally, the WA-adapted model was adjusted throughout the process of adapting from an original index with a set number of parameters, changing both the type and the number of parameters. On the other hand, articles that adapted CCMEWQI were less likely to experience the mentioned abnormalities as the original index is not explicit about the parameters to be chosen and gives the flexibility to accommodate more or alternative factors. Moreover, CCMEWQI does not use either parameter weighting or standard arithmetic computation. Therefore, CCMEWQI uses a variety of intricate aggregating procedures, which may cause the final index value to be uncertain [73].
Either weighted or unweighted multiplicative models can be used as a potential remedy for eclipsing, or new methods of calculating sub-index values can be used [75]. If a crucial parameter was concealed in the overall WQI, the lowest scoring parameter buried within the overall high WQI value might also be reported along with the WQI. To lessen eclipsing abnormalities, ref. [22] also suggested using the minimum operator aggregation function. Finally, applying multivariate statistical tools like PCA, CA, and DA in parameter selection could significantly minimise ambiguity and eclipse and establish new sub-index weights. Location-specific issues regarding rigidity can be reflected through the adjustment of sub-index parameters. To increase uniformity among the WQI models, great care must also be taken to employ local water quality parameters that are in sync with international guidelines [27]. The AHP technique is advised for weight assignment because it reduces abnormalities brought about by improper parameter weighting by determining parameter significance [83].
3.11. Applied Analysis and Comparison of Adapted WQIs and New Models
Since the review’s sole objective was to analyse the development stages for WQIs that were modified versions of existing WQIs, techniques that created a new model were among those disqualified under the exclusion and inclusion criteria. Accordingly, this section summarises four novel approaches WQIs from an African perspective and compares their similarities and differences to the adapted indices.
3.11.1. Water Quality Index Based on DEA: Application to Algerian Dams [113]
The methodology was applied to a sample of 47 dams situated in hydrographic basin areas in Algeria’s Tellian region, specified by ten physicochemical parameters. The input variables, dubbed “optimistic closeness values”, were skillfully constructed from the hydrochemical parameter values before applying a DEA model.
Because of its objective data-driven nature, DEA is one strategy that avoids using a priori elicited weights [114]. The power of DEA has been demonstrated for the performance evaluation of DMUs, which employ many inputs to produce numerous outputs, permitting explicit segmentation of these DMUs into efficient and inefficient units [115]. WQIs, benchmark frequencies, and slack values from the DEA model are used to determine the bounds of the quality ranges, rank the dams, and design a priority scale for treating the hydrological parameters. When analysing the performance of a DMU, the DEA model operates on the fundamental concept of using fewer inputs to generate more outputs.
As a result, when viewed implicitly as an element of a production process, every input has to adhere to the maxim that “less is better” [116]. Therefore, the WHO [103] and the ANRH [113] drinking water standards were used in this article to classify each hydrochemical parameter into one of four quality levels: Excellent, Acceptable, Poor, and Unsuitable. On the other hand, the Acceptable, Poor, and Unsuitable ranges required basic, refined, and highly advanced treatments, respectively, to achieve the necessary water quality. At the same time, the Excellent interval expressed the satisfactory quality of the water that could be utilized without any special requirements.
Sturges’s rule [117], was used to determine the best number of intervals to classify data samples of size K, and in this case,
where K = number of dams (47), and the number of adequate classes for the samples of WQIs would be I = 7.
I = 1 + 3.322log10(K)
The DEA-WQI model is not only a risk-ranking tool but also has great potential to support vital decisions on the water treatment of vulnerable dams.
3.11.2. UWQI: South African Catchments [65]
The information was gathered from six sampling stations spread across four distinct catchments that fall under the purview of the Pongola-Mtamvuna Water Management Area, located in the South African province of KwaZulu-Natal. The four watershed regions are the Umgeni, Umdloti, Nungwane, and Umzinto/uMuziwezinto River catchments. The four catchments employed were sufficient to determine the model’s functionality. The procedure was a step toward the ultimate objective of testing the model against the majority, if not all, of the catchment areas in South Africa. This model employed the four classical steps involved in developing conventional WQIs.
Parameter Selection
A fixed set of 10 parameters were established using expert opinions.
Weight Coefficients
Ratings of parameter significance were provided based on data gathered from the existing literature and via Delphi questionnaires. The preliminary ratings from the two methodologies were then combined to create parameter significance ratings (bi). Equation (20) was used to calculate the relative weight coefficients (wi), which were directly proportional to the significant ratings and obtained by dividing the parameter significance rating value (bi) by the summation of all ratings (bi).
where bi is the assigned significance rating of the water parameter; wi is the final weight coefficient for the water parameter; n is the total number of the rated water quality parameters.
Formation of Sub-Indices
The allowable concentration limits were used to establish the fixed key points of the rating curves graphically. Next, the plotted points were converged using straight lines to create a sequence of linear graphs, which were then transformed into linear sub-index functions. The procedure included consultation with the Target Water Quality Ranges (TWQRs), laid out by DWAF [118].
Aggregation Formula
The final UWQI, an improved version of the weighted sum approach, was developed by modifying and aligning the model with local conditions using scenario-based analysis. As a result, the model equation obtains the overall water quality status as a unitless number ranging from 0 to 100, as stated in the equations below, by integrating sub-index values of selected parameters regarding the defined weights.
Classification of WQI Scores in UWQI
An increasing scale index serves as the basis for the classification mechanism. The UWQI model produces WQI values ranging from 0 to 100. The WQI scores are thus divided into classes ranging from one to five, with “Class 1” designating water of the highest degree of purity with a maximum possible score of one hundred and, conversely, “Class 5” designating water quality of the lowest degree with index scores close to or equal to zero. The classification involves the use of appropriate mathematical operations with logical linguistic descriptors, such as, but not limited to, “greater than”, “less than”, and “equal to”, to evaluate WQI scores that were assigned to each category to fill in gaps in some of the existing classification scales. This classification has also been used in literature by Banda & Kumarasamy [10].
Due to the fixed number of parameters, this model can be used in various catchments without affecting its structure or operation. As a result, stakeholders may be able to compare the water quality of various sites and establish a more impartial management prioritisation. Furthermore, expert opinion has the benefit of promoting the model's acceptability because most of the experts involved are also the model’s intended end users. As a result, their participation in the development of the UWQI may eventually bring about acceptance through a sense of ownership.
3.11.3. The Surrogate Water Quality Index Based on Multivariate Statistical Analysis: South African Watersheds [66]
The parameters for water quality in this model were determined via a two-phase testing process that encompassed (i) the Delphi method used for the UWQI, where twenty-one parameters were reduced to thirteen variables, and (ii) further reducing the parameters to four proxy variables using statistical analysis, including electrical conductivity, chlorophyll-a, pH, and turbidity. Pattern recognition and elucidating the underlying dataset’s structure were both accomplished during this process using PCA [119].
The most significant parameters that can be employed as proxy variables were identified, and it also offered important statistical data on the intercorrelated parameters. Furthermore, HCA was used to demonstrate the intuitive correlations between various water quality data. Finally, the process produced a dendrogram illustrating how the clusters were arranged and how close the various parameters were to one [120]. The resulting regression equation and coefficients represent the surrogate WQI model. The surrogate model outline displays the structure of the surrogate WQI with the four-proxy water quality input variables x1, x2, x3, and x4; their corresponding coefficients b1 to b4, intercept term b0, error term for the regression model symbolized as ε, and the regression model function:
f(x) = b0 + b1x1 + b2x2 + … + b4x4 + ε
The beneficial aspect of this model is that, regardless of the absence of the entire data set, optimally chosen parameters could still reflect water quality [120]. Likewise, it conforms with the requirements of the study and offers an essential quick guide equal to the outcome of a high-fidelity model.
3.11.4. The Hounsinou Scale: Its Development and Use to Determine the Overall Quality of Groundwater Used for Drinking and Bathing in the Municipality of Abomey-Calavi in Benin [121]
Twenty-three physicochemical parameters and three microbiological parameters were used to evaluate the overall water quality of 68 wells in the municipality of Abomey-Calavi in Benin using the Hounsinou scale. The Hounsinou scale, which is novel and superior to the conventional WQIs, independently indicates water's chemical and microbiological properties. The Hounsinou scale combines the CWQI and MWQI scales to provide a final chemical and microbiological contamination assessment.
Weighted arithmetic sums of the values of the physicochemical and microbiological parameters and the WHO standards are used to calculate the CWQI and the MWQI. CWQI computation involves several steps: parameter selection, determination of the ideal values of the parameters, development of sub-indices, assignment of weights, and aggregation of sub-indices to produce an overall index expressed as.
Akoteyon, ref. [56] inspires the classification scheme used in this model whereby CWQI ≤ 50 means water is very excellent to >500, water is very unsuitable for drinking. As for the MWQI, the model is based on the contents per mL of water of TC, FC, and intestinal enterococci (IE). The final index is expressed as.
MWQI = 1/3 (10/9 TC + 20 FC + 1000 EI)
The classification scale in MWQI ranges from ‘Absence of any germ for Excellent water’ to ‘Presence in the water of pathogen germs with or without TC, FC or EI’, meaning the consumption of this water exposes users to water-born illness within a short time.
This new scale is superior to the water quality index that has been used to date because it is more accurate, provides the public with more comprehensive information on water quality, and is constantly applicable across the globe. International institutions can use this new scale, which combines the CWQI and MWQI scales to provide a total rating of chemical and microbial contamination, to rate and monitor the quality of water resources in all countries, and to evaluate the efforts made by those countries to safeguard and clean up their water resources. A summary of the comparisons between the new models and adapted WQIs is shown in Table 9.
4. Future Perspectives
Given the historical adaptation and contextualisation of WQIs for African water resource management, the continent is well-aligned to develop its region-specific (North, Western, Central, Eastern, and Southern) integrated water quality monitoring indices. We believe there is a plethora of scientific data on water science research and emerging technologies in the continent from which the requisite WQPs can be obtained, harmonised, and incorporated within the index development frameworks for specific regions. An additional advantage in WQI development is facilitating access to scientific data repositories and standardisation of water quality monitoring and data processing protocols across these regions. Such a transition towards customisation of WQIs will improve Africa-based models' accuracy and predictive power while increasing confidence in interpreting water quality assessment and implementing water resource management interventions.
5. Conclusions
Effective water quality monitoring and management in Africa is hampered by a lack of “indigenous” or region-specific WQIs due to the long-term trend of adapting and adopting WQIs from outside the continent. We reviewed the 10-year trends in adapting WQIs for water quality monitoring in Africa to examine performance and potential for water quality monitoring in the continent.
The most commonly adapted indices for water quality monitoring in Africa were WAWQI and CCMEWQI, which exhibit a general bias towards physical and chemical parameters over biological metrics. In addition, these indices tend to suffer from abnormalities such as ambiguity, eclipsing, and rigidity, which limits their application potential.
There is a need to integrate physicochemical, biological, and hazard indicators in adapting or developing WQI for the African context to address the broad spectrum of WQP requirements. In addition, non-subjective statistical approaches could further provide uniformity in WQI model development. Nevertheless, the potential for developing Africa-derived WQIs that provide region-specific water quality status of the region’s aquatic ecosystems is unlimited.
Author Contributions
In this paper, D.K.L.: Conceptualisation, Writing—Original Draft preparation; T.P.-K.: Statistical analysis; K.O.O.: Methodology, Writing—Review and Editing; and P.K.M. and N.K.A.: Writing—Review and Editing, Supervision. All authors have read and agreed to the published version of the manuscript.
Funding
This work was funded by the Africa Centre of Excellence in Coastal Resilience (ACECoR), University of Cape Coast, with support from the World Bank and the Government of Ghana, World Bank ACE Grant Number is credit number 6389-G.
Data Availability Statement
No new data were created or analysed in this study. Data sharing does not apply to this article.
Acknowledgments
This paper is part of a Ph.D. thesis under the Africa Centre of Excellence in Coastal Resilience (ACECoR), the University of Cape Coast, with the support of the World Bank and the Government of Ghana. The authors are grateful for the support.
Conflicts of Interest
The authors declare no conflict of interest.
Abbreviations
AHP—Analytical Hierarchy Process, ANRH—Agence Nationale des Resources Hydrauliques, ANZECC—Australian and New Zealand Environment and Conservation Council, BCC—Banker, Charnes, and Cooper, CA—Cluster Analysis, CCME—Canadian Council Ministers of Environment, DA—Discriminant Analysis, DEA—Data Envelopment Analysis, DMU—Decision-Making Units, DWAF—Department of Water Affairs and Forestry, FA—Factor Analysis, FAO—Food and Agriculture Organisation, HCA—Hierarchical Cluster Analysis, MRA—Multivariate Regression Analysis, MWQI—Microbiological Water Quality Index, NSFW—National Sanitation Foundation, PCA—Principal Component Analysis, RWQI—Ramakrishaniah Water Quality Index, SANS—South African National Standard, TMWQI—Tiwari & Mishra Water Quality Index, TWQR—Target Water Quality Ranges, UWQI—Universal Water Quality Index, WA—Weighted Arithmetic, WHO—World Health Organisation, WQI—Water Quality Index, WQPs—Water Quality Parameters, WRC—Water Resource Commission.
References
- Aljanabi, Z.Z.; Al-Obaidy, A.H.; Hassan, F.M. A brief review of water quality indices and their applications. IOP Conf. Ser. Earth Environ. Sci. 2021, 779, 012088. [Google Scholar] [CrossRef]
- Soumaila, K.I.; Niandou, A.S.; Naimi, M.; Mohamed, C.; Schimmel, K.; Luster-Teasley, S.; Sheick, N.N. A systematic review and meta-analysis of water quality indices. J. Agric. Sci. Technol. B 2019, 9, 1–14. [Google Scholar]
- Kachroud, M.; Trolard, F.; Kefi, M.; Jebari, S.; Bourrié, G. Water quality indices: Challenges and application limits in the literature. Water 2019, 11, 361. [Google Scholar] [CrossRef] [Green Version]
- Lumb, A.; Sharma, T.C.; Bibeault, J.F. A review of genesis and evolution of water quality index (WQI) and some future directions. Water Qual. Expo. Health 2011, 3, 11–24. [Google Scholar] [CrossRef]
- Zeinalzadeh, K.; Rezaei, E. Regional Studies Determining spatial and temporal changes of surface water quality using principal component analysis. J. Hydrol. 2017, 13, 1–10. [Google Scholar] [CrossRef]
- Tiwari, T.N.; Mishra, M.A. A preliminary assignment of water quality index of major Indian rivers. Indian J. Environ. Prot. 1985, 5, 276–279. [Google Scholar]
- Poonam, T.; Tanushree, P.; Sukalyan, C. Water quality indices—Important tools for water quality assessment. Int. J. Adv. Chem. 2013, 1, 15–18. [Google Scholar]
- Tyagi, S.; Sharma, B.; Singh, P.; Dobhal, R. Water Quality Assessment in Terms of Water Quality Index. Am. J. Water Resour. 2013, 1, 34–38. [Google Scholar] [CrossRef]
- Boyacioglu, H. Development of a water quality index based on a European classification scheme. Water SA 2007, 33, 101–106. [Google Scholar] [CrossRef] [Green Version]
- Banda, T.D.; Kumarasamy, V.M. Development of water quality indices (WQIs): A review. Pol. J. Environ. Stud. 2020, 29, 2011–2021. [Google Scholar] [CrossRef]
- Brown, R.M.; McClelland, N.I.; Deininger, R.A.; Tozer, R.G. A-Water-Quality-Index-Do-we-dare? Water Sew. Work. 1970, 117, 339–343. [Google Scholar]
- Banda, T.D. Developing an Equitable Raw Water Pricing Model: The Vaal Case Study. Ph.D. Thesis, Tshwane University of Technology, Pretoria, South Africa, October 2015. [Google Scholar] [CrossRef]
- Hallock, D.; Ehinger, W. Quality Assurance Monitoring Plan: Stream Ambient Water Quality Monitoring; Washington State Departament of Ecology: Olympia, WA, USA, 2003.
- Liu, W.C.; Yu, H.L.; Chung, C.E. Assessment of water quality in a subtropical alpine lake using multivariate statistical techniques and geostatistical mapping: A case study. Int. J. Environ. Res. Public Health 2011, 8, 1126–1140. [Google Scholar] [CrossRef] [PubMed] [Green Version]
- Horton, R. An index number system for rating water quality. J. Water Pollut. Control. Fed. 1965, 37, 300–305. [Google Scholar]
- Prati, L.; Pavanello, R.; Pesarin, F. Assessment of surface water quality by single index of pollution. Water Res. 1971, 5, 741–751. [Google Scholar] [CrossRef]
- Dinius, S.H. Social accounting system for evaluating water resources. Water Resour Res. 1972, 5, 1159–1177. [Google Scholar] [CrossRef]
- Brown, R.M.; McClelland, N.I.; Deininger, R.; Landwehr, J.M. Validating the WQI. In Proceedings of the National Meeting of American Society of Civil Engineers on Water Resources Engineering, Washington, DC, USA, 30 January 1973; Volume 29. [Google Scholar]
- Stoner, J.D. Water-Quality Indices for Specific Water Uses; US Geological Survey Circular: Arlington, VA, USA, 1978; pp. 154–196. [CrossRef] [Green Version]
- Dinius, S.H. Design of an Index of Water Quality. JAWRA 1987, 23, 833–843. [Google Scholar] [CrossRef]
- Bhargava, D.S. Expression for Drinking Water Supply Standards. J. Environ. Eng. 1985, 111, 304–316. [Google Scholar] [CrossRef]
- Smith, D.G. A better water quality indexing system for rivers and streams. Water Res. 1990, 24, 1237–1244. [Google Scholar] [CrossRef]
- Canadian Council of Ministers of the Environment. CCME. Canadian Water Quality Guidelines for the Protection of Aquatic Life: CCME Water Quality Index; Technical Report 1.0; Canadian Council of Ministers of the Environment: Quebec City, QC, Canada, 2001. [Google Scholar]
- Said, A.; Stevens, D.; Sehlke, G. Innovative Index for Evaluating Water Quality in Streams. Environ. Manag. 2004, 34, 406–414. [Google Scholar] [CrossRef]
- Ewaid, S.H.; Abed, S.A.; Al-Ansari, N.; Salih, R.M. Development and evaluation of a water quality index for the Iraqi rivers. Hydrology 2020, 7, 67. [Google Scholar] [CrossRef]
- Walsh, P.; Wheeler, W. Water Quality Index Aggregation and Cost Benefit Analysis: National Center for Environmental Economics Water Quality Index Aggregation and Cost Benefit Analysis; U.S. Environmental Protection Agency: Washington, DC, USA, 2012; p. 26.
- Swamee, P.K.; Tyagi, A. Describing water quality with aggregate index. J. Environ. Eng. 2000, 126, 451–455. [Google Scholar] [CrossRef]
- Ramesh, S.; Sukumaran, N.; Murugesan, A.G.; Rajan, M.P. An innovative approach of Drinking Water Quality Index—A case study from Southern Tamil Nadu, India. Ecol. Indic. 2010, 10, 857–868. [Google Scholar] [CrossRef]
- Kim, A.G.; Cardone, C. R.Scatterscore: A reconnaissance method to evaluate changes in water quality. Environ. Monit. Assess. 2005, 111, 277–295. [Google Scholar] [CrossRef] [PubMed]
- Liou, S.M.; Lo, S.L.; Wang, S.H. A generalized water quality index for Taiwan. Environ. Monit. Assess. 2004, 96, 35–52. [Google Scholar] [CrossRef] [PubMed]
- Sargaonkar, A.; Deshpande, V. Development of an overall index of pollution for surface water based on a general classification scheme in Indian context. Environ. Monit. Assess. 2003, 89, 43–67. [Google Scholar] [CrossRef] [PubMed]
- Tsegaye, T.; Sheppard, D.; Islam, K.R.; Tadesse, W.; Atalay, A.; Marzen, L. Development of chemical index as a measure of in-stream water quality in response to land-use and landcover changes. Water Air Soil Pollut. 2006, 174, 161–179. [Google Scholar] [CrossRef]
- Kumar, D.; Alappat, B.J. NSF-Water Quality Index: Does It Represent the Experts’ Opinion? Pract. Period. Hazard. Toxic Radioact. Waste Manag. 2009, 13, 75–79. [Google Scholar] [CrossRef]
- Manju, E.K.; George, A.V.; Rekha, V.B. A Comparative Study of Water Quality Index (WQI) of Vagamon and Peermade Sub-Watersheds of Meenachil and Pamba River Basins of Western Ghats, Kerala, South India. J. Environ. Sci. Toxilogy Food Technol. 2014, 8, 53–58. [Google Scholar] [CrossRef]
- Wills, M.; Irvine, K.N. Application of the National Sanitation Foundation Water Quality Index in the Ccazenovia Creek, NY, Pilot Watershed Management Project. Middle States Geogr. 1996, 95–104. Available online: http://msaag.aag.org/wp-content/uploads/2013/04/12_Wills_Irvine.pdf (accessed on 22 December 2022).
- Noori, R.; Berndtsson, H.R.M.; Adamowski, J.F.; Abyaneh, M.R. A critical review on the application of the National Sanitation Foundation Water Quality Index. Environ. Pollut. 2019, 244, 575–587. [Google Scholar] [CrossRef]
- Kalagbor, I.A.; Johnny, V.I.; Ogbolokot, I.E. Application of National Sanitation Foundation and Weighted Arithmetic Water Quality Indices for the Assessment of Kaani and Kpean Rivers in Nigeria. Am. J. Water Resour. 2019, 7, 11–15. [Google Scholar] [CrossRef]
- Abbasi, T.; Abbasi, S.A. Water quality indices based on bioassessment: The biotic indices. J. Water Health 2011, 9, 330–348. [Google Scholar] [CrossRef] [PubMed] [Green Version]
- Goher, M.E.; Mahdy, E.S.M.; Abdo, M.H.; El Dars, F.M.; Korium, M.A.; Elsherif, A.A.S. Water quality status and pollution indices of Wadi El-Rayan lakes, El-Fayoum, Egypt. Sustain. Water Resour. Manag. 2019, 5, 387–400. [Google Scholar] [CrossRef]
- Abukila, A.F. Assessing the drain estuaries’ water quality in response to pollution abatement. Water Sci. 2015, 29, 1–18. [Google Scholar] [CrossRef] [Green Version]
- Miyittah, M.K.; Tulashie, S.K.; Tsyawo, F.W.; Sarfo, J.K.; Darko, A.A. Assessment of surface water quality status of the Aby Lagoon System in the Western Region of Ghana. Heliyon 2020, 6, e04466. [Google Scholar] [CrossRef]
- Egbi, C.D.; Anornu, G.; Appiah-Adjei, E.K.; Ganyaglo, S.Y.; Dampare, S.B. Evaluation of water quality using hydrochemistry, stable isotopes, and water quality indices in the Lower Volta River Basin of Ghana. Environ. Dev. Sustain. 2019, 21, 3033–3063. [Google Scholar] [CrossRef]
- Ligate, F.; Ijumulana, J.; Irunde, R.; Kimambo, V.; Mtamba, J.; Ahmad, A.; Hamisi, R.; Maity, J.P.; Mtalo, F.; Bhattacharya, P. Geogenic contaminants and groundwater quality around Lake Victoria goldfields in northwestern Tanzania. Chemosphere 2022, 307, 135732. [Google Scholar] [CrossRef] [PubMed]
- Terrado, M.; Barceló, D.; Tauler, R.; Borrell, E.; de Campos, S. Surface-water-quality indices for the analysis of data generated by automated sampling networks. TrAC Trends Anal. Chem. 2010, 29, 40–52. [Google Scholar] [CrossRef]
- Yogendra, K.; Puttaiah, E.T. Determination of Water Quality Index and Suitability of an Urban Waterbody in Shimoga Town, Karnataka. In Proceedings of the Taal2007: The 12th World Lake Conference, Jaipur, Rajasthan, India, 28 October–2 November 2007. [Google Scholar]
- Salem, M.A.; Sharif, O.A.; Alshofeir, A.A.; Assad, M.E.H. An evaluation of drinking water quality in five wells in Sebha city, Libya, using a water quality index and multivariate analysis. Arab. J. Geosci. 2022, 15, 1519. [Google Scholar] [CrossRef]
- Rabeiy, R.E.S. Assessment and modeling of groundwater quality using WQI and GIS in Upper Egypt area. Environ. Sci. Pollut. Res. 2018, 25, 30808–30817. [Google Scholar] [CrossRef]
- Hagage, M.; Madani, A.A.; Elbeih, S.F. Quaternary groundwater aquifer suitability for drinking in Akhmim, Upper Egypt: An assessment using water quality index and GIS techniques. Arab. J. Geosci. 2022, 15, 196. [Google Scholar] [CrossRef]
- Khmila, K.; Trabelsi, R.; Zouari, K.; Kumar, U.S. Application of geochemical and isotopic tracers for the evaluation of groundwater quality in the irrigated area of the Sbiba plain (Central West Tunisia). Agric. Ecosyst. Environ. 2021, 313, 107298. [Google Scholar] [CrossRef]
- Njuguna, S.M.; Onyango, J.A.; Githaiga, K.B.; Gituru, R.W.; Yan, X. Application of multivariate statistical analysis and water quality index in health risk assessment by domestic use of river water. Case study of Tana River in Kenya. Process. Saf. Environ. Prot. 2020, 133, 149–158. [Google Scholar] [CrossRef]
- Githaiga, K.B.; Njuguna, S.M.; Gituru, R.W.; Yan, X. Water quality assessment, multivariate analysis and human health risks of heavy metals in eight major lakes in Kenya. J. Environ. Manag. 2021, 297, 113410. [Google Scholar] [CrossRef]
- Chebet, E.B.; Kibet, J.K.; Mbui, D. The assessment of water quality in river Molo water basin, Kenya. Appl. Water Sci. 2020, 10, 92. [Google Scholar] [CrossRef] [Green Version]
- Robert, G.K.; Onyari, C.N.; Mbaka, J.G. Development of a Water Quality Assessment Index for the Chania River, Kenya. Afr. J. Aquat. Sci. 2020, 46, 142–152. [Google Scholar] [CrossRef]
- Teshome, F.B. Seasonal water quality index and suitability of the water body to designated uses at the eastern catchment of Lake Hawassa. Environ. Sci. Pollut. Res. 2020, 27, 279–290. [Google Scholar] [CrossRef]
- Berhe, B.A. Evaluation of groundwater and surface water quality suitability for drinking and agricultural purposes in Kombolcha town area, eastern Amhara region, Ethiopia. Appl. Water Sci. 2020, 10, 127. [Google Scholar] [CrossRef]
- Akoteyon, I.S.; Omotayo, A.O.; Soladoye, O.; Olaoye, H.O. Determination of water quality index and suitability of Urban River for municipal water supply in Lagos-Nigeria. Eur. J. Sci. Res. 2011, 54, 263–271. [Google Scholar]
- Nwanosike, A.A.; Olasehinde, P.I.; Okosun, E.; Yisa, J. Assessment of the Water Quality Index of Otamiri and Oramiriukwa Rivers Assessment of the Water Quality Index of Otamiri and Oramiriukwa Rivers. Phys. Int. 2010, 1, 102–109. [Google Scholar] [CrossRef]
- Ochelebe, I.; Kudamnya, E.A. Hydrochemistry and an appraisal of surface water and groundwater quality for domestic and irrigation use in parts of Southern Benue Trough, Nigeria. Sustain. Water Resour. Manag. 2022, 8, 159. [Google Scholar] [CrossRef]
- Oni, O.; Fasakin, O. The Use of Water Quality Index Method to Determine the Potability of Surface Water and Groundwater in the Vicinity of a Municipal Solid Waste Dumpsite in Nigeria. Am. J. Eng. Res. 2016, 5, 96–101. [Google Scholar]
- Yisa, J.; Oladejo, J.T. Analytical Studies on Water Quality Index of River Landzu Analytical Studies on Water Quality Index of River Landzu. Am. J. Appl. Sci. 2010, 7, 453–458. [Google Scholar] [CrossRef] [Green Version]
- Boah, D.K.; Pelig-ba, K.B.; Twum, S.B. Mathematical Computation of Water Quality Index of Vea Dam in Upper East Region of Ghana. Environ. Sci. 2015, 3, 11–16. [Google Scholar] [CrossRef] [Green Version]
- Akoto, O.; Adopler, A.; Tepkor, H.E.; Opoku, F. A comprehensive evaluation of surface water quality and potential health risk assessments of Sisa river, Kumasi. Groundw. Sustain. Dev. 2021, 15, 100654. [Google Scholar] [CrossRef]
- Boateng, T.K.; Opoku, F.; Acquaah, S.O.; Akoto, O. Groundwater quality assessment using statistical approach and water quality index in Ejisu-Juaben Municipality, Ghana. Environ. Earth Sci. 2016, 75, 489. [Google Scholar] [CrossRef]
- Bon, A.F.; Abderamane, H.; Ewodo, M.G.; Banakeng, L.A.; Bontsong, B.; Stephane, B.; Piih, S.L.; Wangbara, D.B. Parametrization of groundwater quality of the Quaternary aquifer in N’Djamena (Chad), Lake Chad Basin: Application of numerical and multivariate analyses. Environ. Sci. Pollut. Res. 2021, 28, 12300–12320. [Google Scholar] [CrossRef]
- Banda, T.D.; Kumarasamy, M. Development of a universal water quality index (UWQI) for South African river catchments. Water 2020, 12, 1534. [Google Scholar] [CrossRef]
- Banda, T.D.; Kumarasamy, M. Application of multivariate statistical analysis in the development of a surrogate water quality index (WQI) for South African watersheds. Water 2020, 12, 1584. [Google Scholar] [CrossRef]
- Belle, G.; Fossey, A.; Esterhuizen, L.; Moodley, R. Contamination of groundwater by potential harmful elements from gold mine tailings and the implications to human health: A case study in Welkom and Virginia, Free State Province, South Africa. Groundw. Sustain. Dev. 2021, 12, 100507. [Google Scholar] [CrossRef]
- Mandindi, W.Z.; Nyaba, L.; Mketo, N.; Nomngongo, P.N. Seasonal Variation of Drinking Water Quality and Human Health Risk Assessment: A Case Study in Rural Village of the Eastern Cape, South Africa. Water 2022, 14, 2013. [Google Scholar] [CrossRef]
- Molekoa, M.D.; Avtar, R.; Kumar, P.; Minh, H.V.T.; Kurniawan, T.A. Hydrogeochemical assessment of groundwater quality of Mokopane area, Limpopo, South Africa using statistical approach. Water 2019, 11, 1891. [Google Scholar] [CrossRef] [Green Version]
- Molekoa, M.D.; Avtar, R.; Kumar, P.; Minh, H.V.T.; Dasgupta, R.; Johnson, B.A.; Sahu, N.; Verma, R.L.; Yuus, A.P. Spatio-temporal analysis of surface water quality in mokopane area, Limpopo, South Africa. Water 2021, 13, 220. [Google Scholar] [CrossRef]
- Molekoa, M.D.; Kumar, P.; Chouldhary, B.K.; Yunus, A.P.; Kharrazi, A.; Khedher, K.M.; Al Shaib, M.; Singh, B.P.; Minh, H.V.T.; Kurniawan, T.A.; et al. Spatio-temporal variations in the water quality of the Doorndraai Dam, South Africa: An assessment of sustainable water resource management. Curr. Res. Environ. Sustain. 2022, 4, 100187. [Google Scholar] [CrossRef]
- Namugize, J.N.; Jewitt, G.P.W. Sensitivity analysis for water quality monitoring frequency in the application of a water quality index for the uMngeni River and its tributaries, KwaZulu-Natal, South Africa. Water SA 2018, 44, 516–527. [Google Scholar] [CrossRef] [Green Version]
- Sutadian, A.D.; Muttil, N.; Yilmaz, A.G.; Perera, B.J.C. Using the Analytic Hierarchy Process to identify parameter weights for developing a water quality index. Ecol. Indic. 2016, 75, 220–233. [Google Scholar] [CrossRef]
- Cude, C.G. Oregon Water Quality Index a tool for evaluating water quality management effectiveness. JAWRA 2001, 37, 125–137. [Google Scholar] [CrossRef]
- Swamee, P.K.; Tyagi, A. Improved Method for Aggregation of Water Quality Subindices. J. Environ. Eng. 2007, 133, 220–225. [Google Scholar] [CrossRef]
- Moher, D.; Liberati, J.; Tetzlaff, J.; Altman, D.G. Reprint-Preferred Reporting Items for Systematic Reviews and Meta-Analyses: The PRISMA Statement. Ann. Intern. Med. 2009, 151, 264–269. Available online: http://www.annals.org/cgi/content/full/151/4/264 (accessed on 15 May 2022). [CrossRef] [Green Version]
- Sirunda, J.; Oberholster, P.; Wolfaardt, G. Assessing the Adverse Effects of Land Use Activities on the Water Quality of Selected Sub-Saharan Africa Reservoirs Using a Combination of Water Quality Indices. Water Air Soil Pollut. 2022, 233, 267. [Google Scholar] [CrossRef]
- Anim-Gyampo, M.; Anornu, G.; Appiah-Adjei, E.; Agodzo, S. Quality and health risk assessment of shallow groundwater aquifers within the Atankwidi basin of Ghana. Groundw. Sustain. Dev. 2019, 9, 100217. [Google Scholar] [CrossRef]
- Bankole, A.O.; Oluwasanya, G.; Odjegba, E.E. Evaluation of groundwater suitability in the Cretaceous Abeokuta Formation, Nigeria: Implications for water supply and public health. Groundw. Sustain. Dev. 2022, 19, 100845. [Google Scholar] [CrossRef]
- Marove, C.A.; Sotozono, R.; Tangviroon, P.; Tabelin, C.B.; Igarashi, T. Assessment of soil, sediment and water contaminations around open-pit coal mines in Moatize, Tete province, Mozambique. Environ. Adv. 2022, 8, 100215. [Google Scholar] [CrossRef]
- Solihu, H.; Bilewu, S.O. Assessment of anthropogenic activities impacts on the water quality of Asa river: A case study of Amilengbe area, Ilorin, Kwara state, Nigeria. Environ. Chall. 2022, 7, 100473. [Google Scholar] [CrossRef]
- Wali, S.U.; Alias, N.B.; Harun, S.B.; Gada, M.A.; Dankani, I.M.; Kaoje, I.U.; Usman, A.A. Water quality indices and multivariate statistical analysis of urban groundwater in semi-arid Sokoto Basin, Northwestern Nigeria. Groundw. Sustain. Dev. 2022, 18, 100779. [Google Scholar] [CrossRef]
- Uddin, M.G.; Nash, S.; Olbert, A.I. A review of water quality index models and their use for assessing surface water quality. Ecol. Indic. 2021, 122, 107218. [Google Scholar] [CrossRef]
- Ekere, N.R.; Agbazue, V.E.; Ngang, B.U.; Ihedioha, J.N. Hydrochemistry and Water Quality Index of groundwater resources in Enugu north district, Enugu, Nigeria. Environ. Monit. Assess. 2019, 191, 150. [Google Scholar] [CrossRef] [PubMed]
- Idehen, O. Geophysical and water quality index surveys of groundwater quality around Ugbor dumpsite in Benin city, Edo Sstate, Nigeria, West Africa. J. Adv. Phys. 2016, 12, 4383–4392. [Google Scholar] [CrossRef]
- Mgbenu, C.N.; Egbueri, J.C. The hydrogeochemical signatures, quality indices and health risk assessment of water resources in Umunya district, Southeast Nigeria. Appl. Water Sci. 2019, 9, 22. [Google Scholar] [CrossRef] [Green Version]
- Ibanga, O.A.; Ohwo, S.E.; Omonigho, G.M. Application of Water Quality Index in Assessment of Swimming Pools Water Quality in Hotels in Emerging Africa Littoral Metropolis of Warri, Delta State, Nigeria. Geosport Soc. 2020, 13, 91–107. [Google Scholar] [CrossRef]
- Misaghi, F.; Delgosha, F.; Razzaghmanesh, M.; Myers, B. Introducing a water quality index for assessing water for irrigation purposes: A case study of the Ghezel Ozan River. Sci. Total Environ. 2017, 589, 107–116. [Google Scholar] [CrossRef]
- Jagaba, A.H.; Kutty, S.R.M.; Hayder, G.; Abubakar, S.; Ghaleb, A.A.S.; Lawal, I.M.; Noor, A.; Umaru, I.; Almahbashi, N.M.Y. Water quality hazard assessment for hand dug wells in Rafin Zurfi, Bauchi State, Nigeria. Ain Shams Eng. J. 2020, 11, 983–999. [Google Scholar] [CrossRef]
- Bhargava, D.S. Use of a Water Quality Index for River Classification and Zoning of Ganga River. Environ. Pollut. Ser. B Chem. Phys. 1983, 6, 51–67. [Google Scholar] [CrossRef]
- Ayogu, C.N.; Maduka, R.I.; Ayogu, N.O.; Njoku, C.N.; Chinedu-Asogwa, N.C. Hydro-geochemical analysis and quality evaluation of surface water in the Mamu River basin, southeastern Nigeria. Appl. Water Sci. 2020, 10, 159. [Google Scholar] [CrossRef]
- Akakuru, O.C.; Akudinobi, B.; Opara, A.I.; Onyekuru, S.O.; Akakuru, O.U. Hydrogeochemical facies and pollution status of groundwater resources of Owerri and environs, Southeastern Nigeria,”. Environ. Monit. Assess. 2021, 193, 623. [Google Scholar] [CrossRef]
- Icaga, Y. Fuzzy evaluation of water quality classification. Ecol. Indic. 2007, 7, 710–718. [Google Scholar] [CrossRef]
- Mophin-Kani, K.; Murugesan, A.G. Evaluation and Classification of Water Quality of Perennial River Tamirabarani through Aggregation of Water Quality Index. Int. J. Environ. Prot. IJEP 2011, 1, 24–33. [Google Scholar] [CrossRef]
- Dunnette, D.A. A geographically variable water quality index used in Oregon. J. Water Pollut. Control Fed. 1979, 51, 53–61. [Google Scholar]
- Ramakrishnaiah, C.R.; Sadashivaiah, C.; Ranganna, G. Assessment of Water Quality Index for the Groundwater in Tumkur Taluk, Karnataka State, India. E-J. Chem. 2009, 6, 523–530. [Google Scholar] [CrossRef] [Green Version]
- Sahu, P.; Sikdar, P.K. Hydrochemical framework of the aquifer in and around East Kolkata Wetlands, West Bengal, India. Environ. Geol. 2008, 55, 823–835. [Google Scholar] [CrossRef]
- Shah, K.A.; Joshi, G.S. Evaluation of water quality index for River Sabarmati, Gujarat, India. Appl. Water Sci. 2017, 7, 1349–1358. [Google Scholar] [CrossRef] [Green Version]
- Abrahão, R.; Carvalho, M.; Da Silva, W.R.; Machado, T.T.V.; Gadelha, C.L.M.; Hernandez, M.I.M. Use of index analysis to evaluate the water quality of a stream receiving industrial effluents. Water SA 2007, 33, 459–465. [Google Scholar] [CrossRef] [Green Version]
- Rubio-Arias, H.; Contreras-Caraveo, M.; Quintana, R.M.; Saucedo-Teran, R.A.; Pinales-Munguia, A. An overall water quality index (WQI) for a man-made aquatic reservoir in Mexico. Int. J. Environ. Res. Public Health 2012, 9, 1687–1698. [Google Scholar] [CrossRef] [PubMed]
- Debels, P.; Figueroa, R.; Urrutia, R.; Barra, R.; Niell, X. Evaluation of water quality in the Chillán River (Central Chile) using physicochemical parameters and a modified Water Quality Index. Environ. Monit. Assess. 2005, 110, 301–322. [Google Scholar] [CrossRef]
- Kannel, P.R.; Lee, S.; Lee, Y.S.; Kanel, S.R.; Khan, S.P. Application of water quality indices and dissolved oxygen as indicators for river water classification and urban impact assessment. Environ. Monit. Assess. 2007, 132, 93–110. [Google Scholar] [CrossRef]
- World Health Organisation (WHO). Heavy Metals: Understanding the Science and Impacts; World Health Organisation (WHO): Geneva, Switzerland, 2011. [Google Scholar]
- Birniwa, A.H.; Abubakar, A.S.; Huq, A.O.; Mahmud, H.N.M.E. Polypyrrole-polyethyleneimine (PPy-PEI) nanocomposite: An effective adsorbent for nickel ion adsorption from aqueous solution. J. Macromol. Sci. Part A 2021, 58, 206–217. [Google Scholar] [CrossRef]
- Fang, J.; Lang, M.; Ye, X.; Zhang, W.; Zhu, K. Non-isothermal crystallization behavior of polypropylene/zinc oxide composites. Sci. Eng. Compos. Mater. 2016, 23, 505–510. [Google Scholar] [CrossRef]
- Jaishankar, M.; Tseten, T.; Anbalagan, N.; Mathew, B.B.; Beeregowda, K.N. Toxicity, mechanism and health effects of some heavy metals. Interdiscip. Toxicol. 2014, 7, 60–72. [Google Scholar] [CrossRef] [PubMed] [Green Version]
- Nriagu, J. Zinc Toxicity in Humans. Encycl. Environ. Heal. 2011, 801–807. [Google Scholar] [CrossRef]
- Ongley, E.D.; Booty, W.G. Pollution Remediation Planning In Developing Countries Pollution Remediation Planning In Developing Countries. Water Int. 2009, 24, 31–38. [Google Scholar] [CrossRef]
- Abuzaid, A.S. Evaluating Surface Water Quality for Irrigation in Dakahlia Governorate Using Water Quality Index and GIS Soil Quality View Project. 2018. Available online: https://www.researchgate.net/publication/328282660 (accessed on 4 July 2022).
- Sheldon, J.; Alber, M. Recommended indicators of estuarine water quality for Georgia. In Proceedings of the 2011 Georgia Water Resources Conference, University of Georgia, Athens, Georgia, 11–13 April 2011. [Google Scholar]
- Odonkor, S.T.; Ampofo, J.K. Escherichia coli as an indicator of bacteriological quality of water: An overview. Microbiol. Res. 2013, 4, e2. [Google Scholar] [CrossRef] [Green Version]
- Ashbolt, N.J. Water Quality: Guidelines, Standards and Health. Assessment of Risk and Risk Management for Water-Related Infectious Disease; World Health Organisation (WHO): Geneva, Switzerland, 2001; p. 424. Available online: http://www.who.int/iris/handle/10665/42442 (accessed on 10 August 2022).
- Soltani, A.A.; Oukil, B.H.; Bermad, A.; Boulassel, M.R. A new methodology for assessing water quality, based on data envelopment analysis: Application to Algerian dams. Ecol. Indic. 2021, 121, 106952. [Google Scholar] [CrossRef]
- Al-Mezeini, N.K.; Oukil, A.; Al-Ismaili, A.M. Investigating the efficiency of greenhouse production in Oman: A two-stage approach based on Data Envelopment Analysis and double bootstrapping. J. Clean. Prod. 2020, 247, 119160. [Google Scholar] [CrossRef]
- Oukil, A.; Al-Zidi, A. Benchmarking the hotel industry in Oman through a threestage DEA-based procedure. J. Arts Soc. Sci. 2018, 9, 5–23. [Google Scholar] [CrossRef] [Green Version]
- Cook, W.D.; Tone, K.; Zhu, J. Data envelopment analysis: Prior to choosing a model. Omega 2014, 44, 1–4. [Google Scholar] [CrossRef]
- Sturges, H.A. The Choice of a Class Interval. J. Am. Stat. Assoc. 1926, 153, 65–66. [Google Scholar] [CrossRef]
- DWAF. South African Water Quality Guidelines:Volume 1: Domestic Water Use; Department of Water Affairs and Forestry: Pretoria, South Africa, 1996.
- Bouza-Deaño, R.; Ternero-Rodriguez, M.; Fernández-Espinosa, A. Trend study and assessment of surface water quality in the Ebro River (Spain). J. Hydrol. 2008, 361, 227–239. [Google Scholar] [CrossRef]
- Zhao, Y.; Xia, X.H.; Yang, Z.F.; Wang, F. Assessment of water quality in Baiyangdian Lake using multivariate statistical techniques. Procedia Environ. Sci. 2012, 13, 1213–1226. [Google Scholar] [CrossRef] [Green Version]
- Hounsinou, S.P. The Hounsinou scale: Its development and use to determine the overall quality of groundwater used for drinking and bathing in the municipality of Abomey-Calavi in Benin. J. Hydrol. Reg. Stud. 2021, 34, 100777. [Google Scholar] [CrossRef]
Figure 1.
Flow diagram of the research protocol and selection of articles, adapted from [76].
Figure 1.
Flow diagram of the research protocol and selection of articles, adapted from [76].

Figure 2.
The number of articles with adapted WQI for each country over the last ten years.

Figure 3.
An illustration of the development steps of WAWQI in adapted indices.

Figure 4.
Percentage distribution of societal needs addressed by authors in the adapted indices.

Figure 5.
Percentage of WQPs used among the 42 articles under evaluation.

Figure 6.
More WQPs used among the 42 articles as a continuation of Figure 5.
Figure 6.
More WQPs used among the 42 articles as a continuation of Figure 5.

Figure 7.
A parameter combination dendrogram from cluster analysis in modified WQIs. Notes—The numbers provide a visual display of how the branching occurs into various clusters and sub-clusters represented by different colors. Every color possesses similar features where blue, red and green represent combinations 1, 2 and 3 respectively. The dotted line provides an idea of the distance between clusters, or the cut off between the main clusters and sub-clusters.


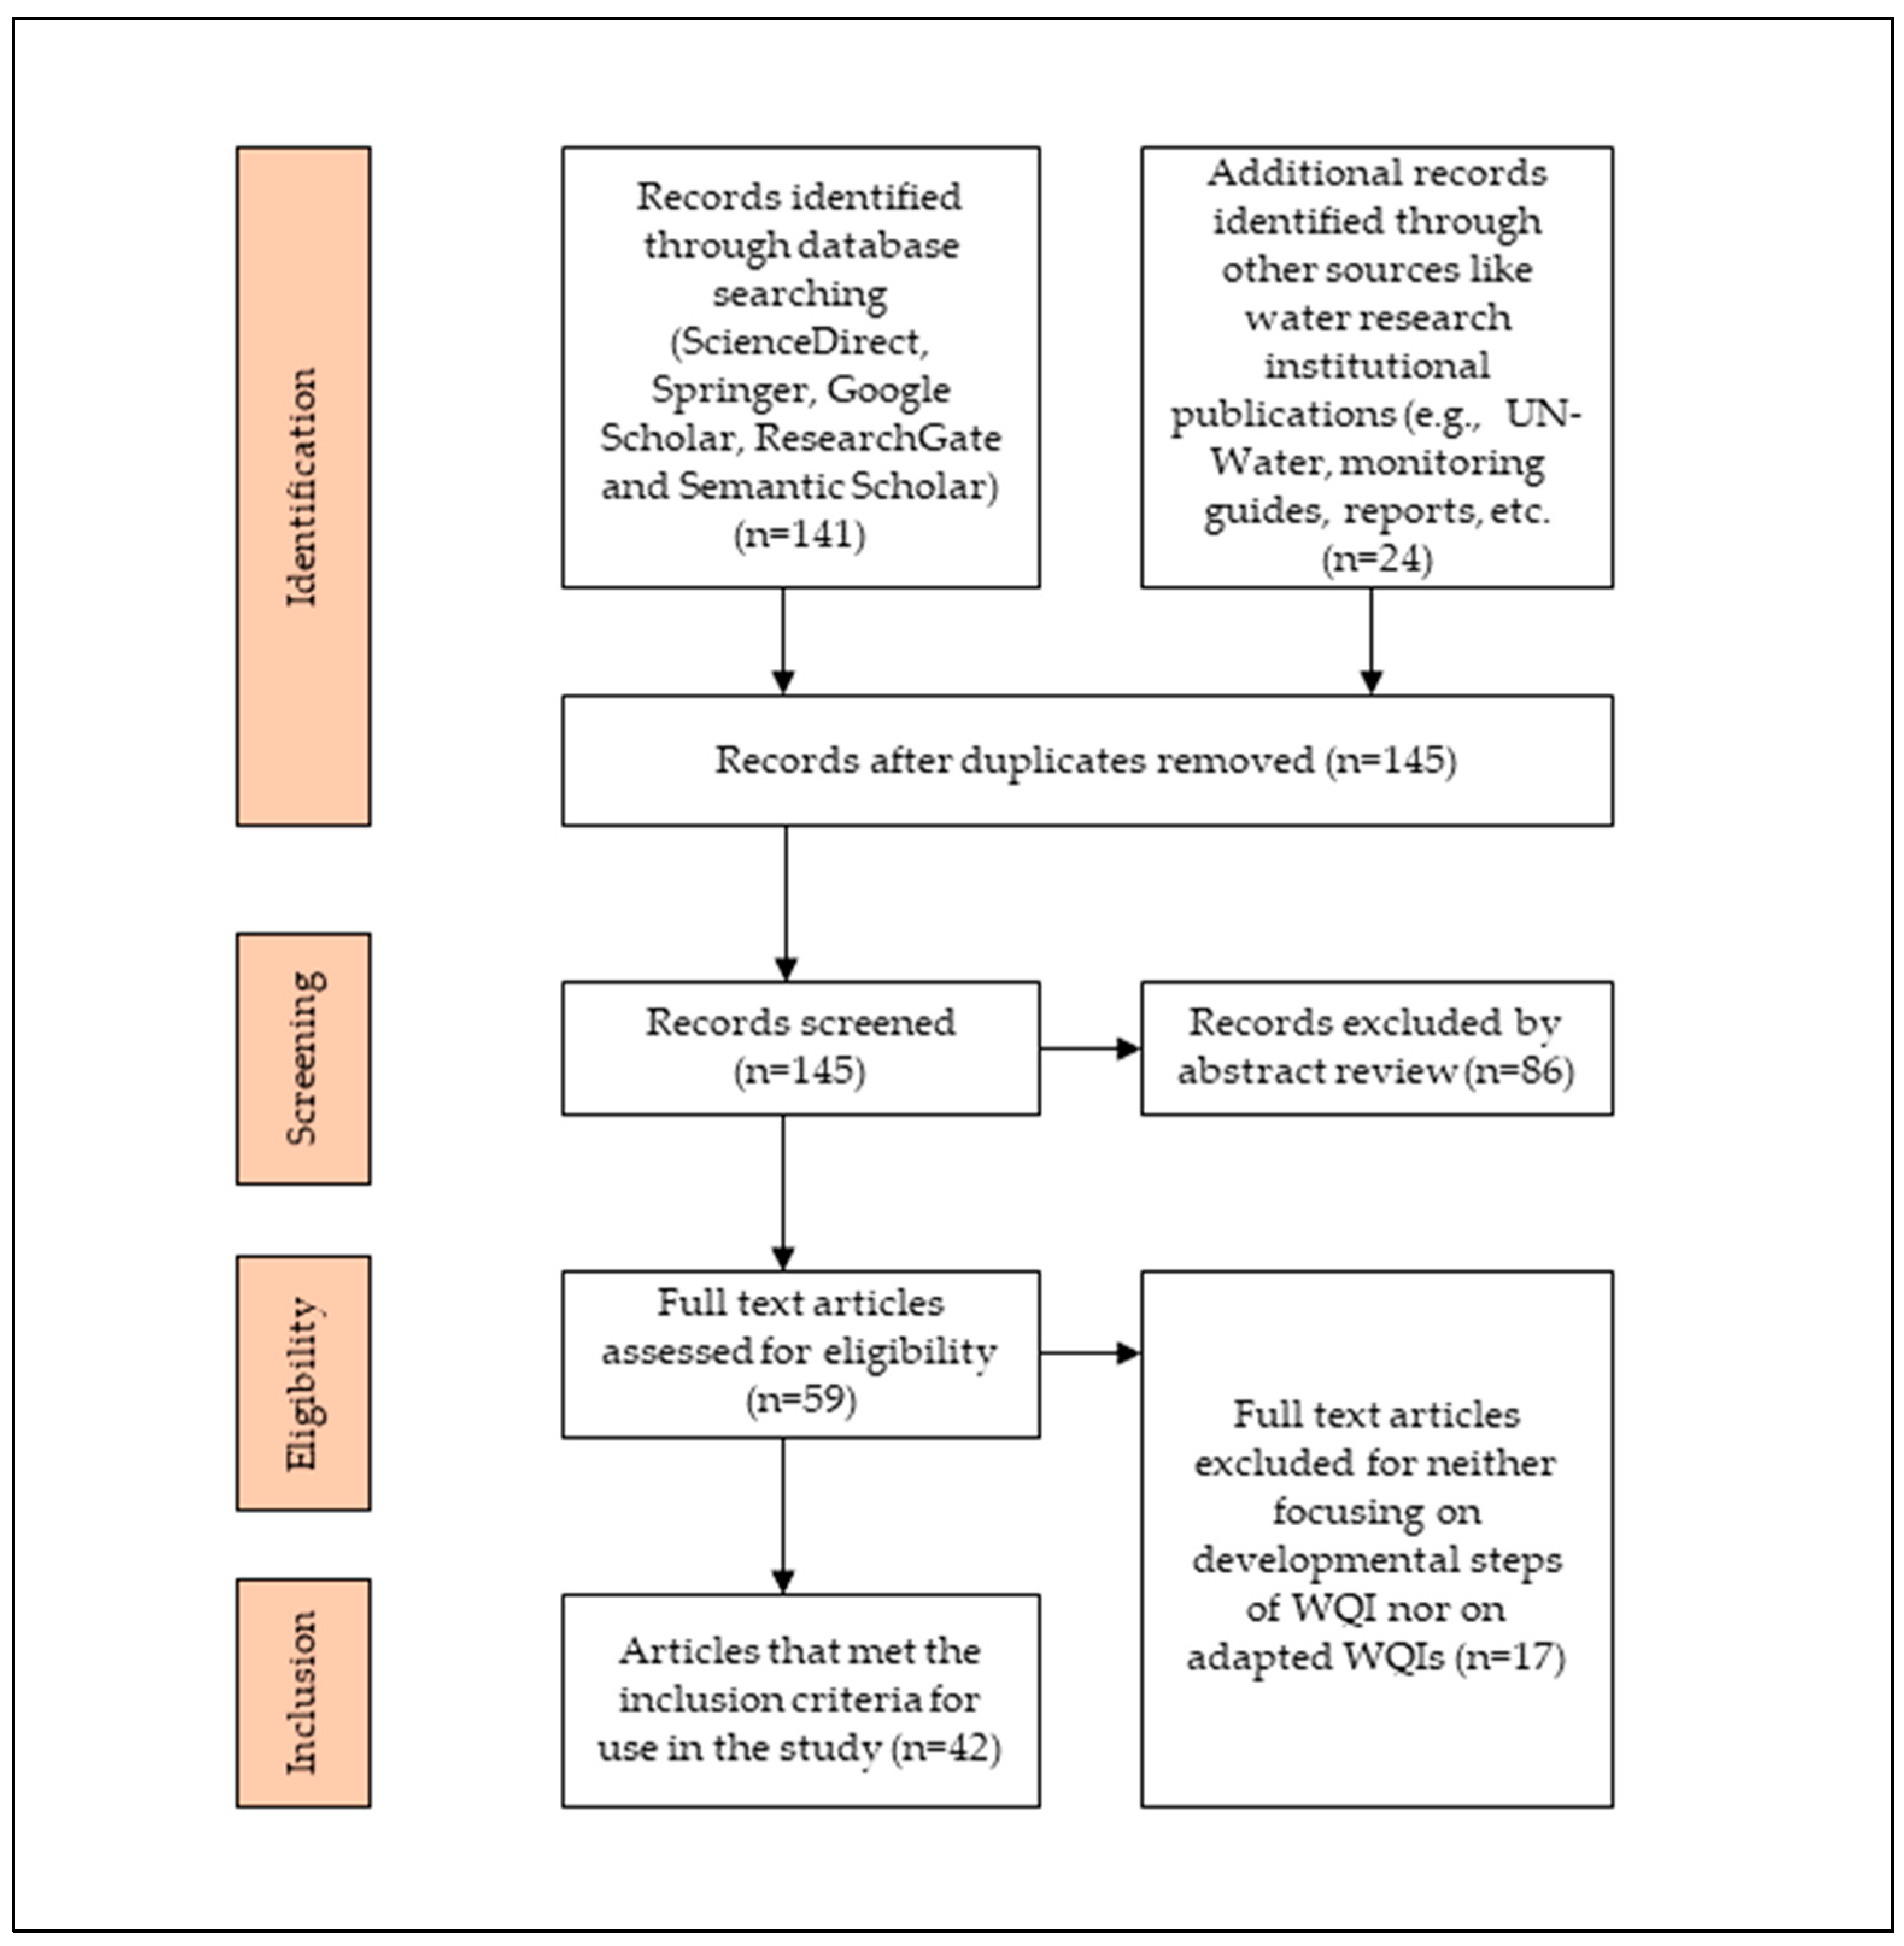
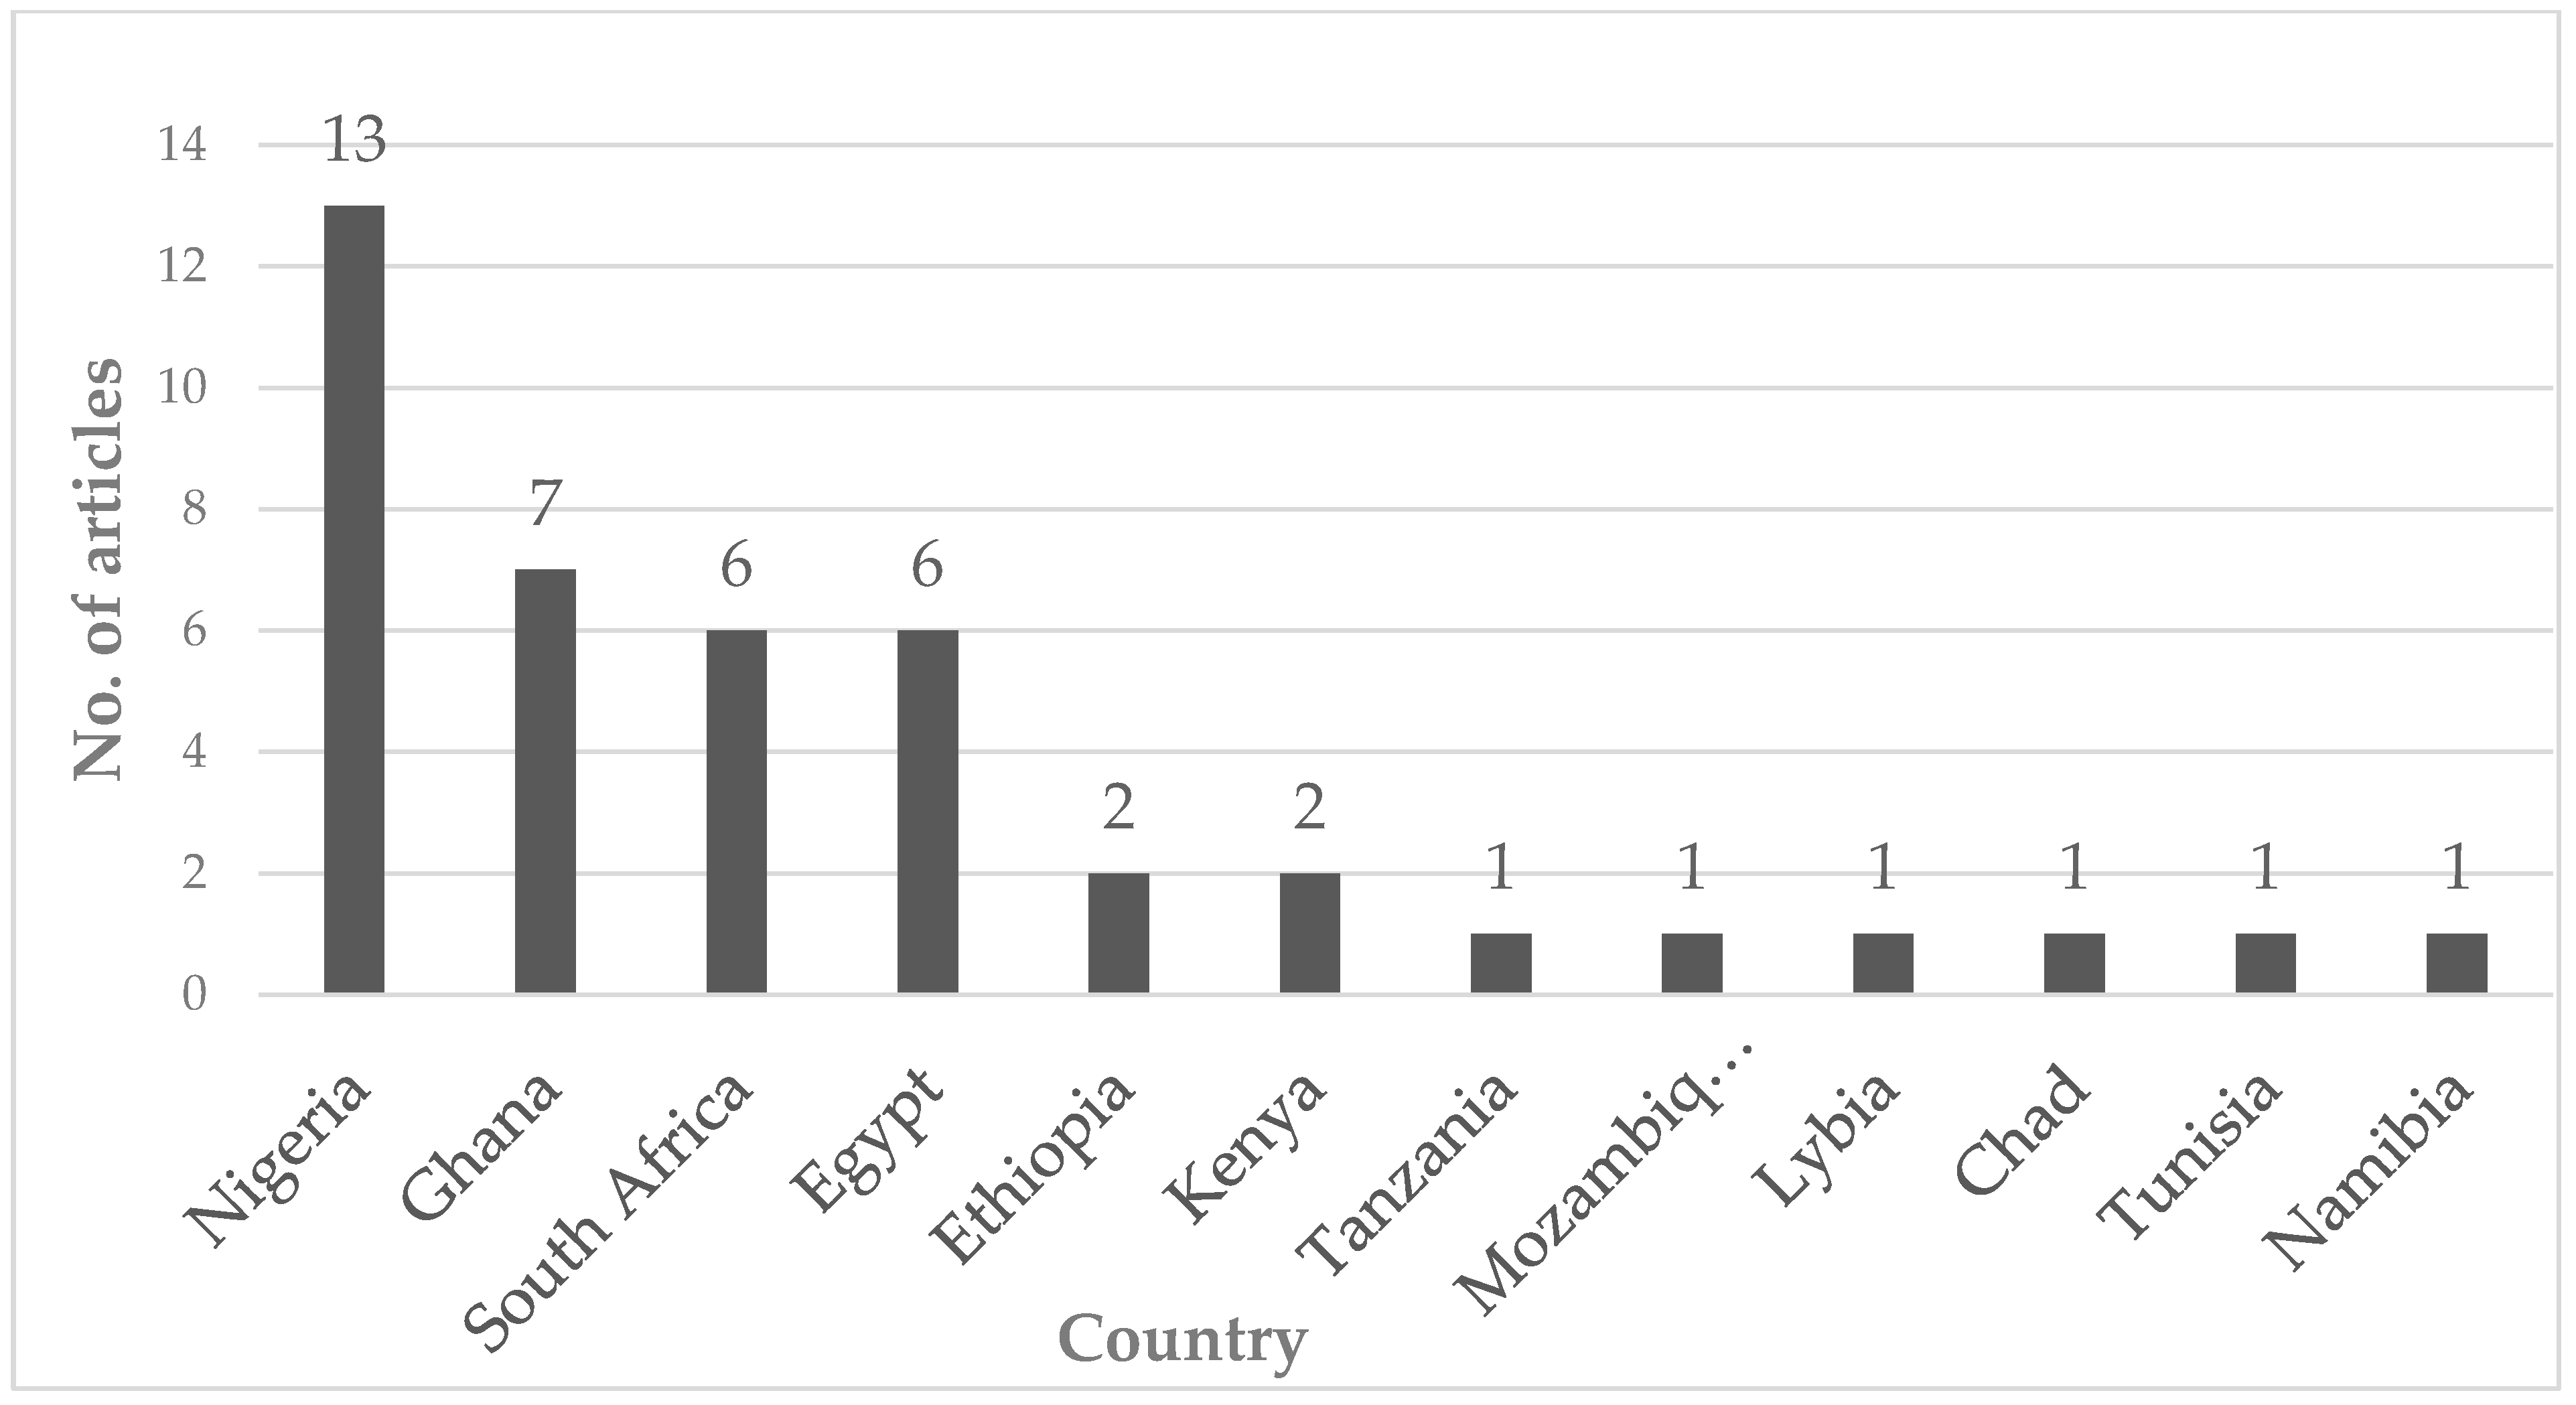
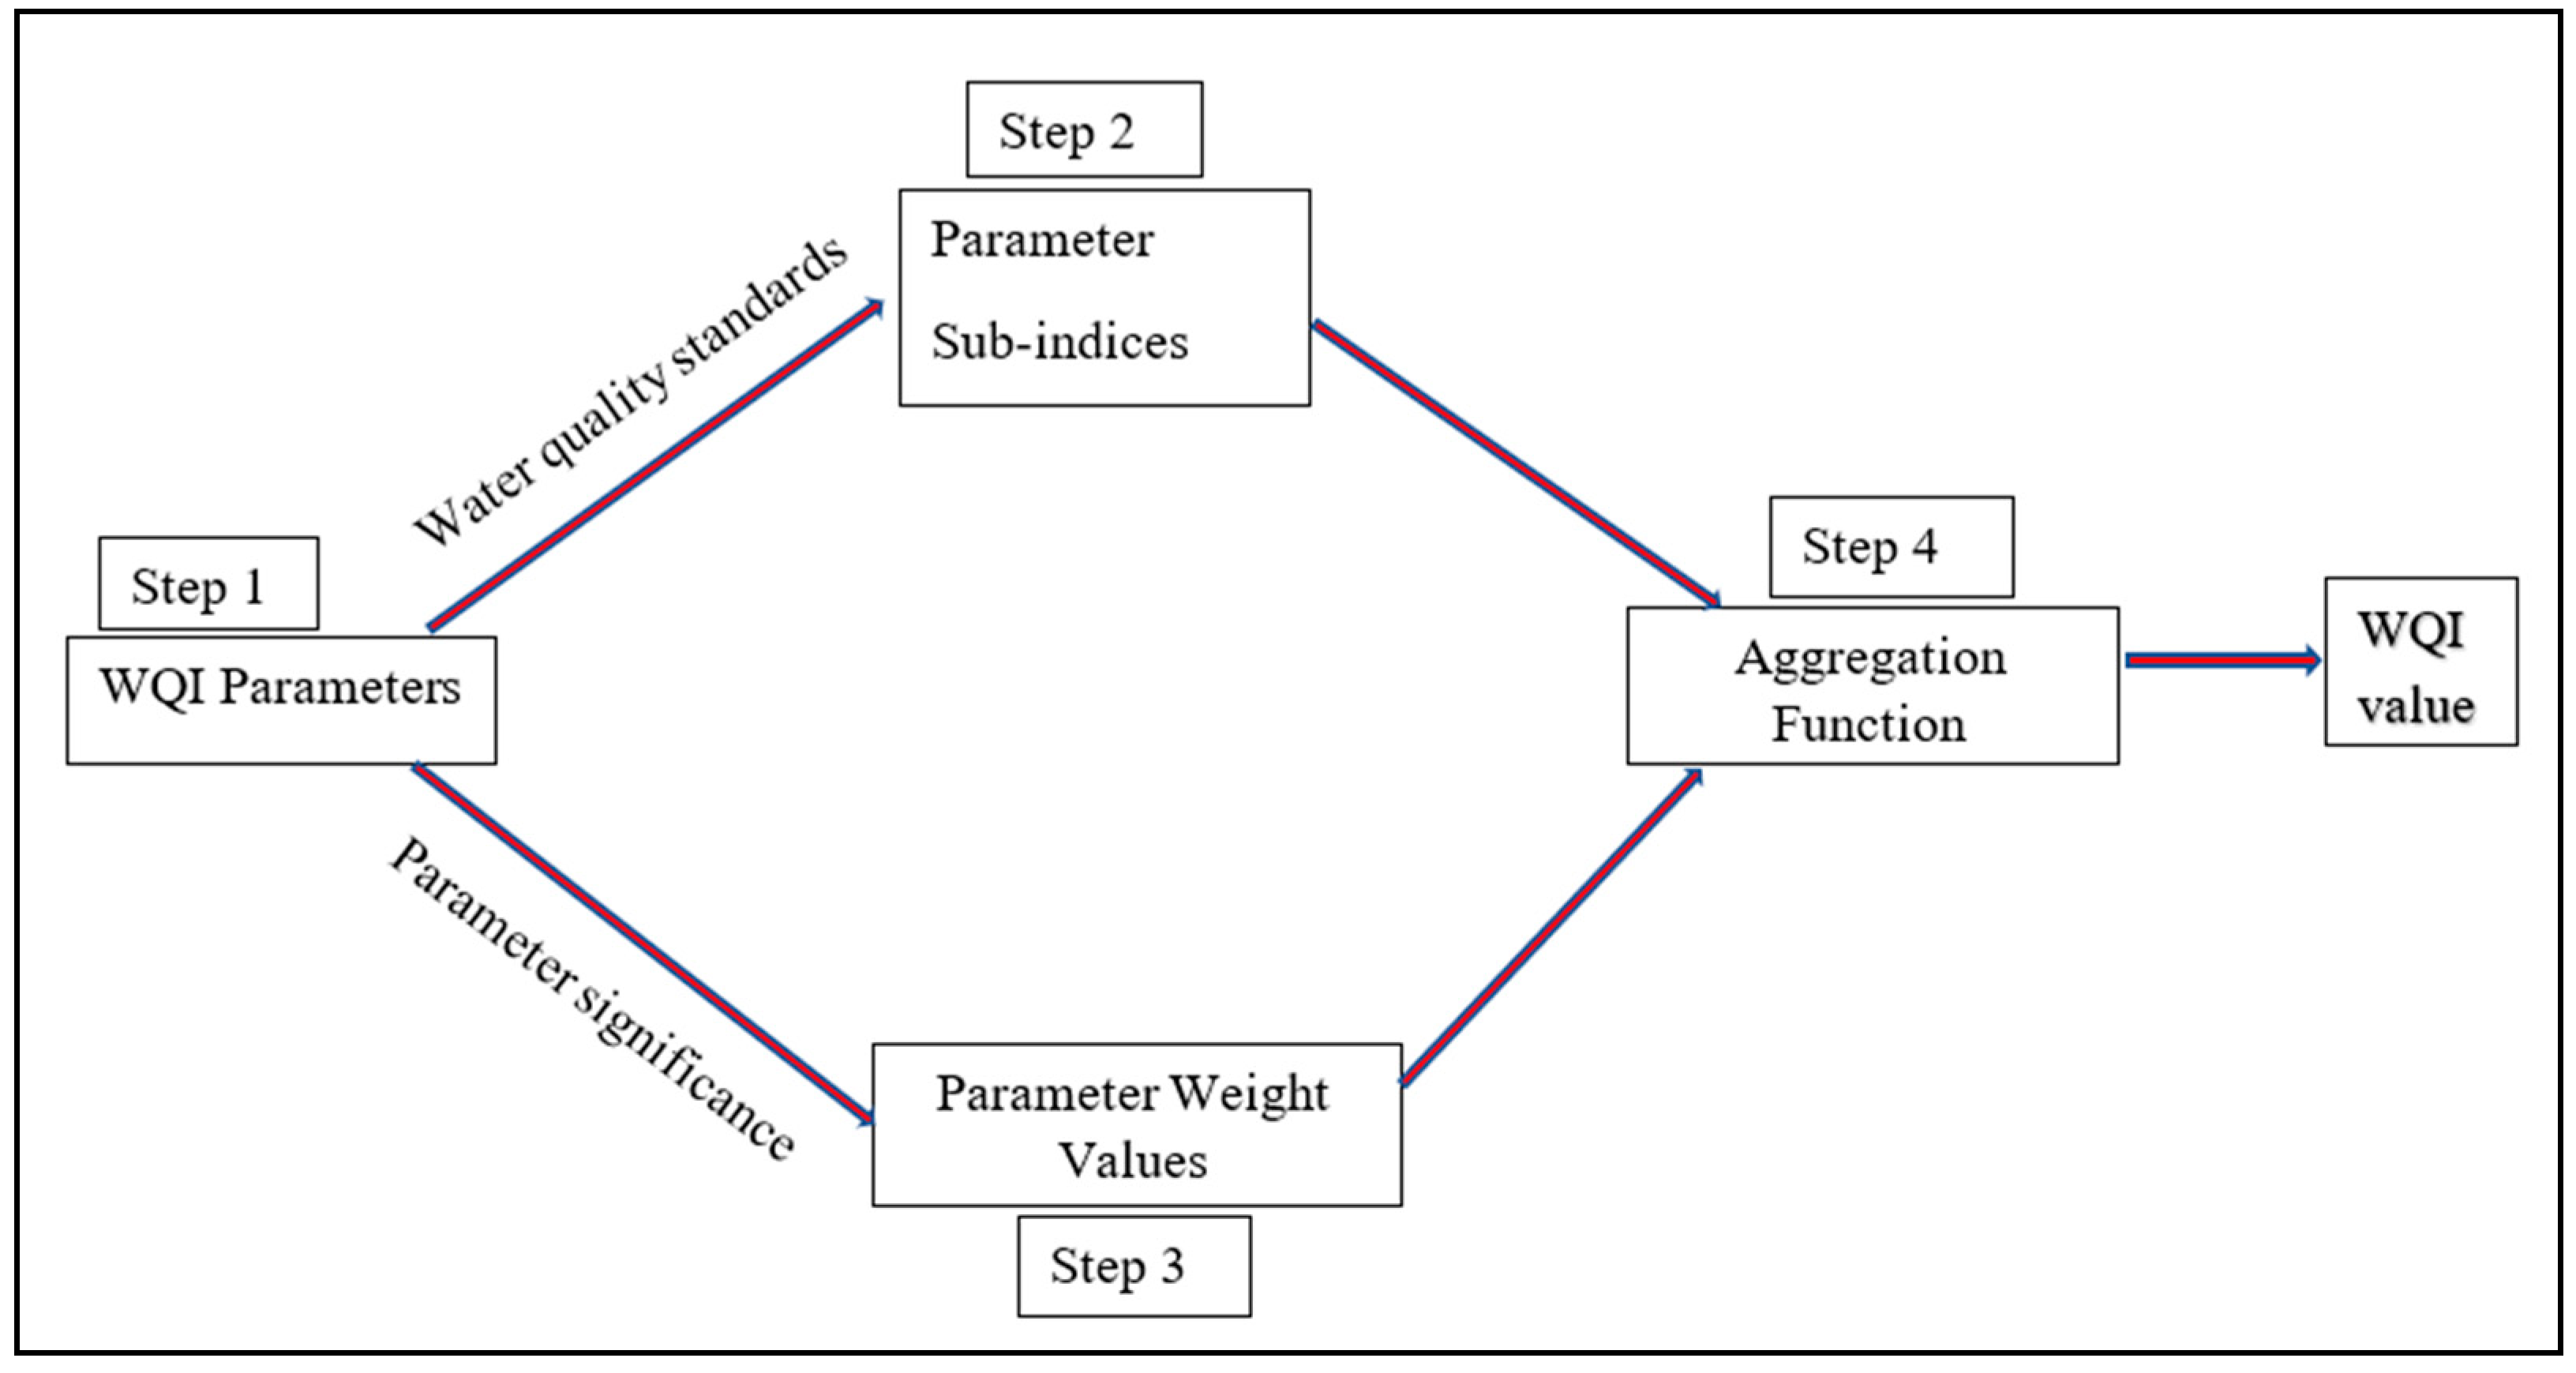
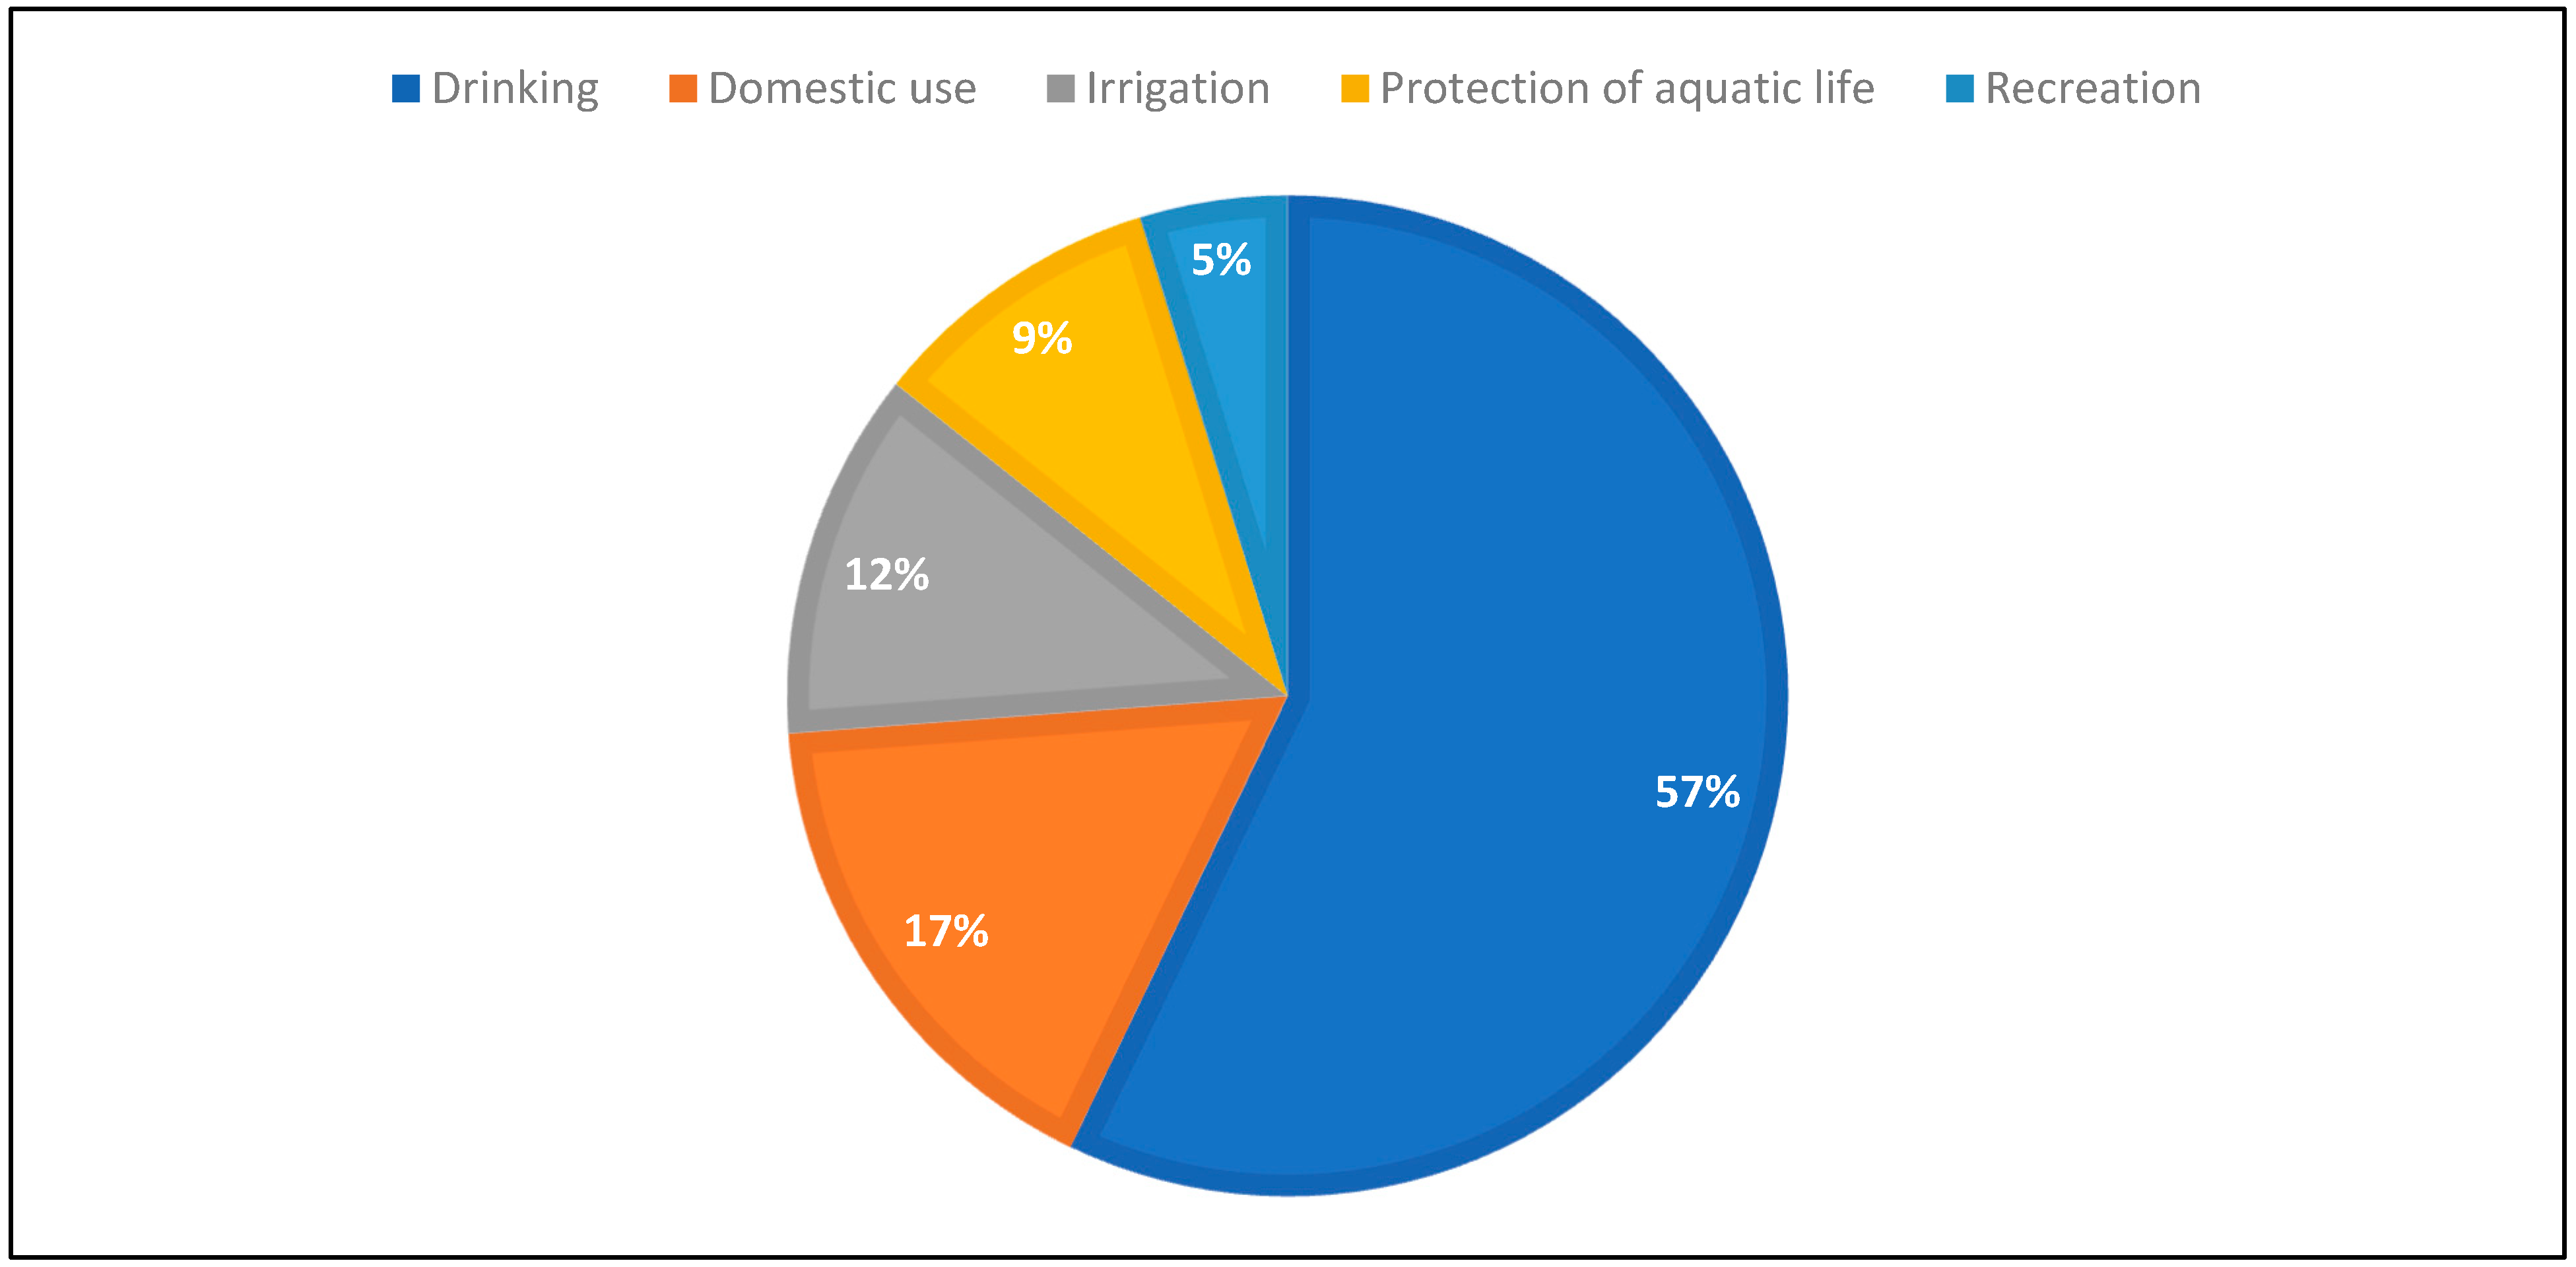
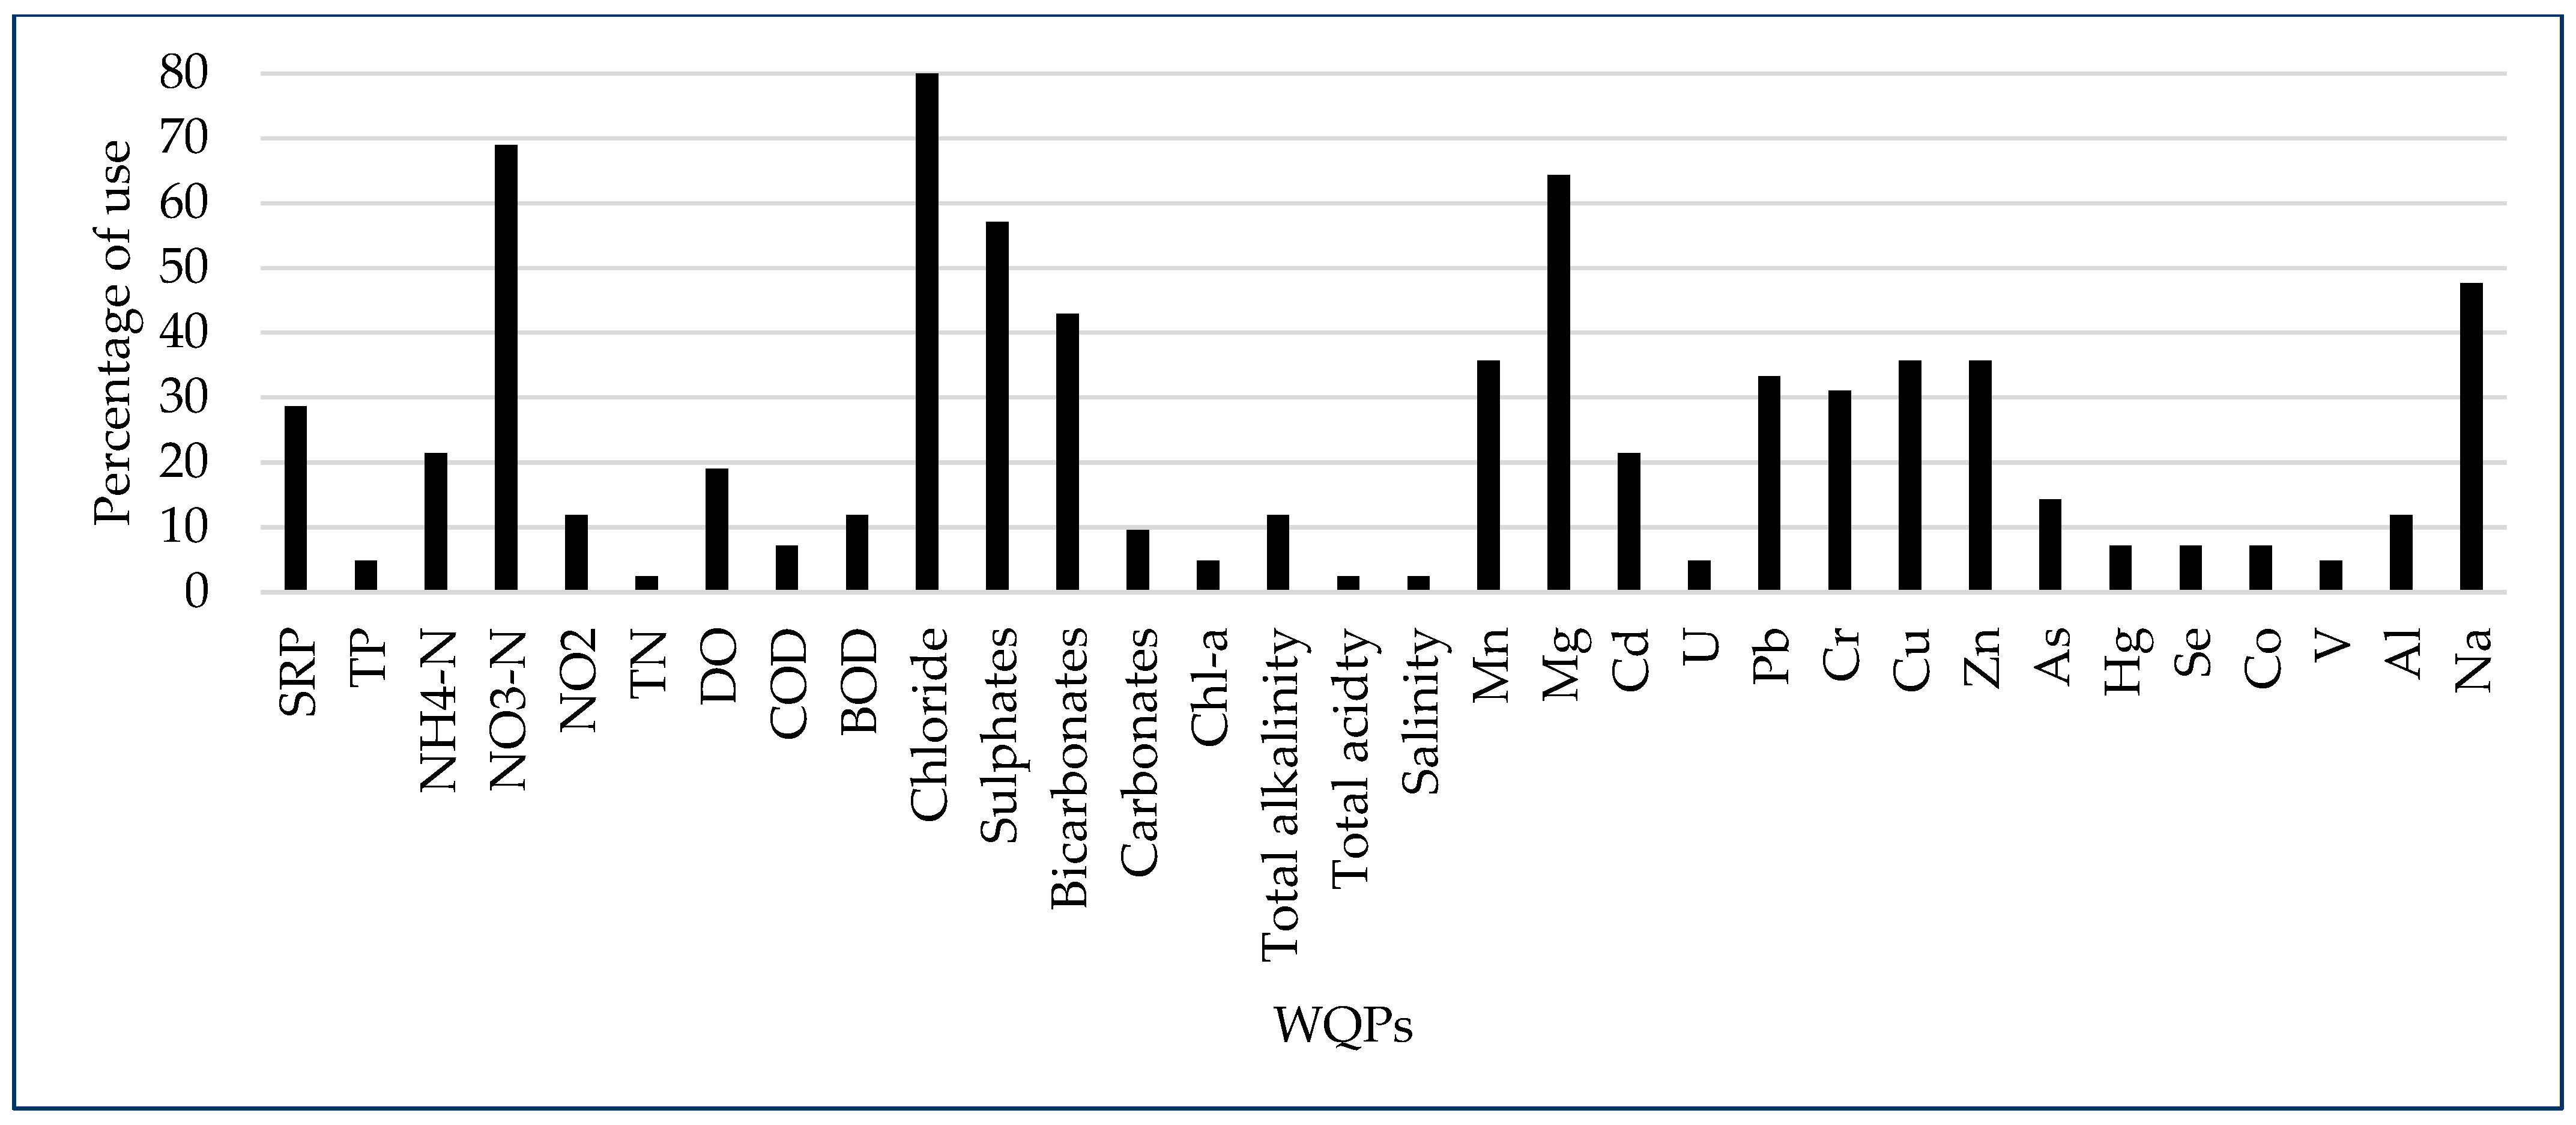
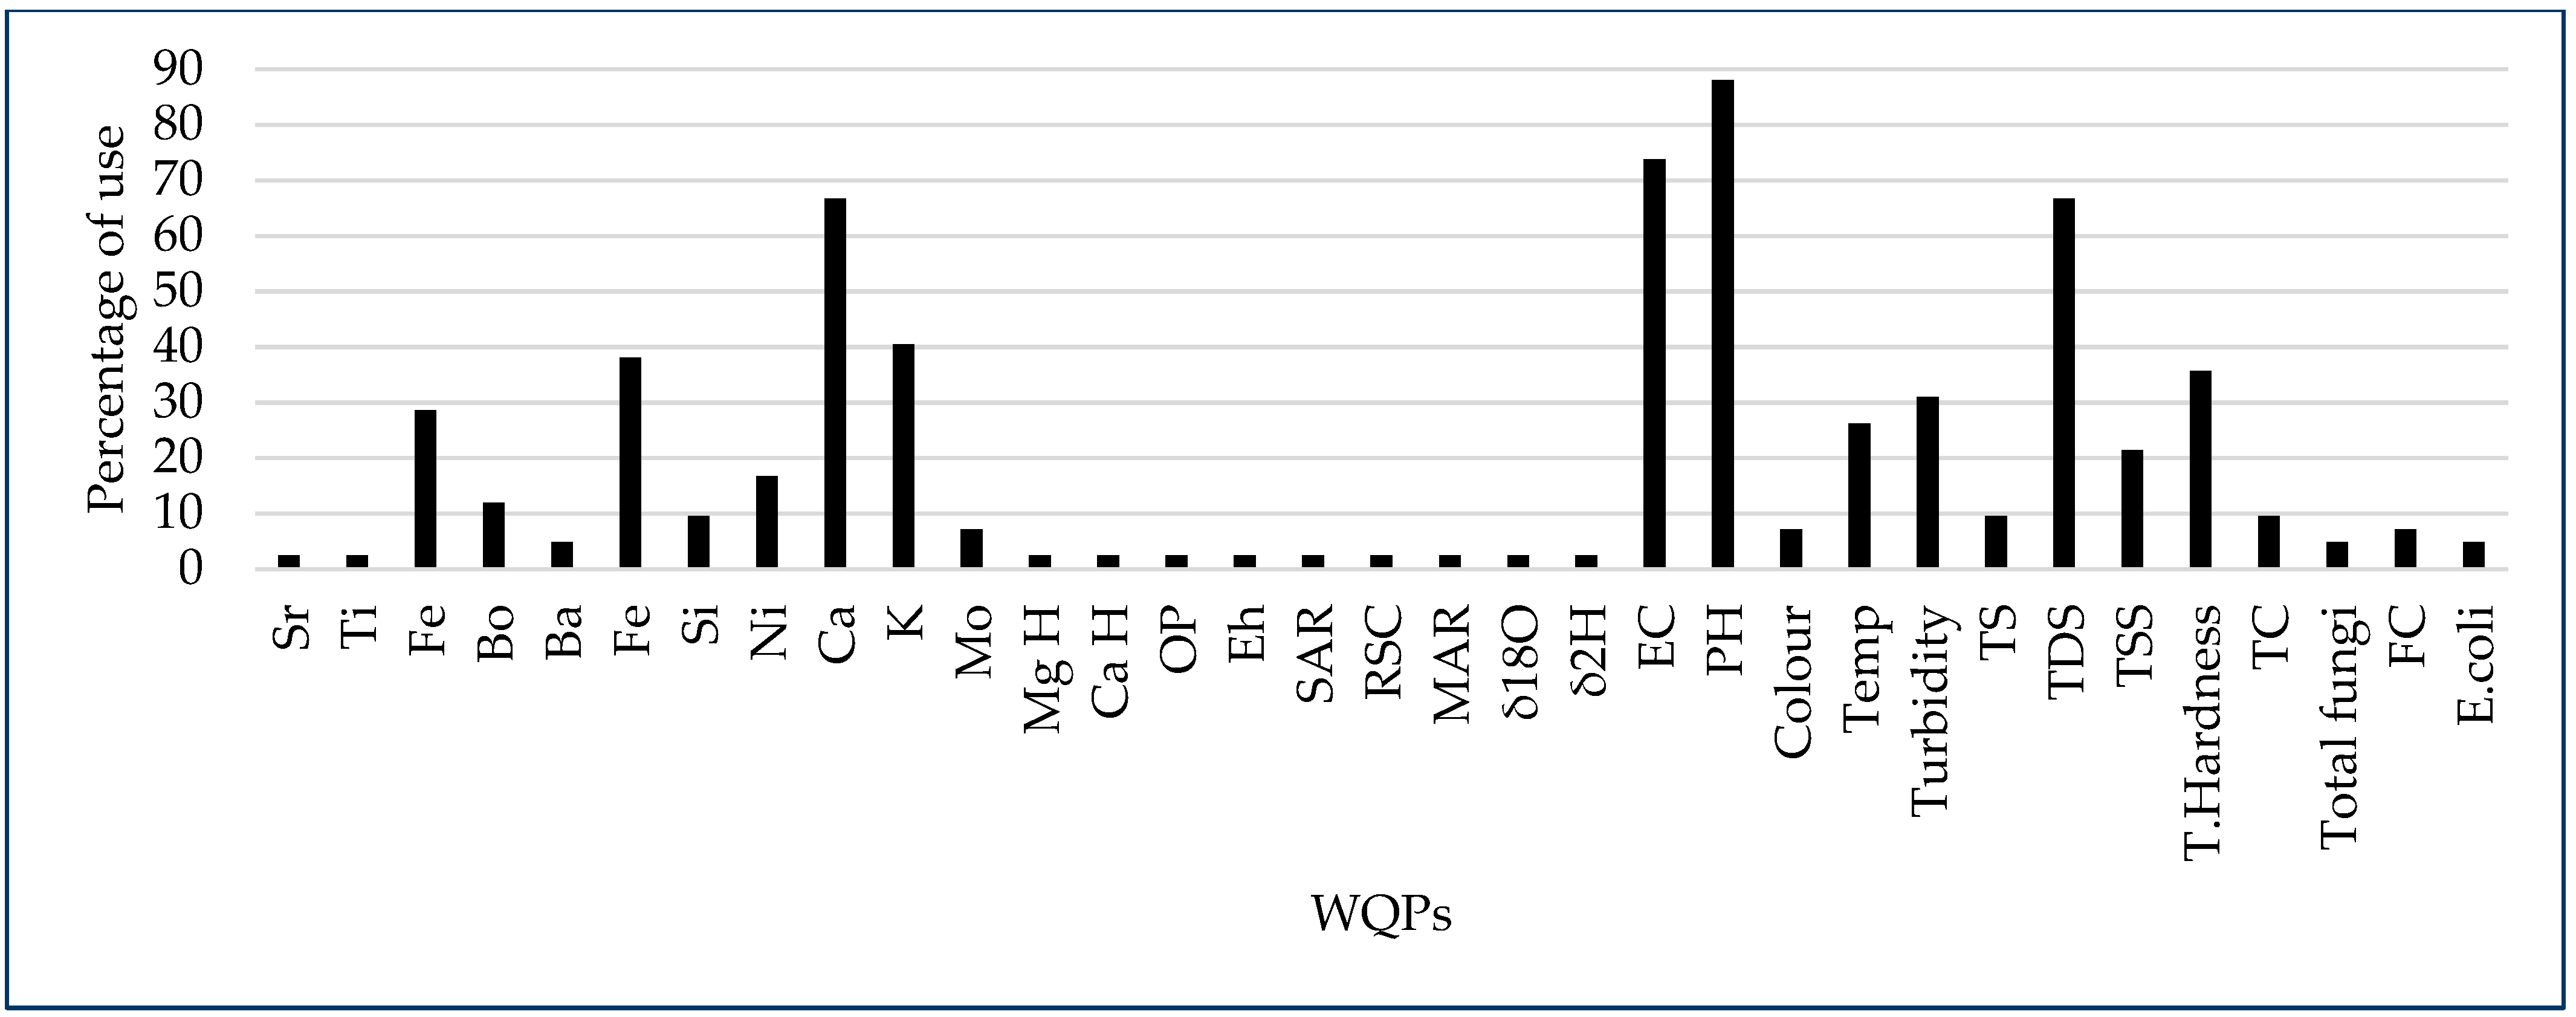
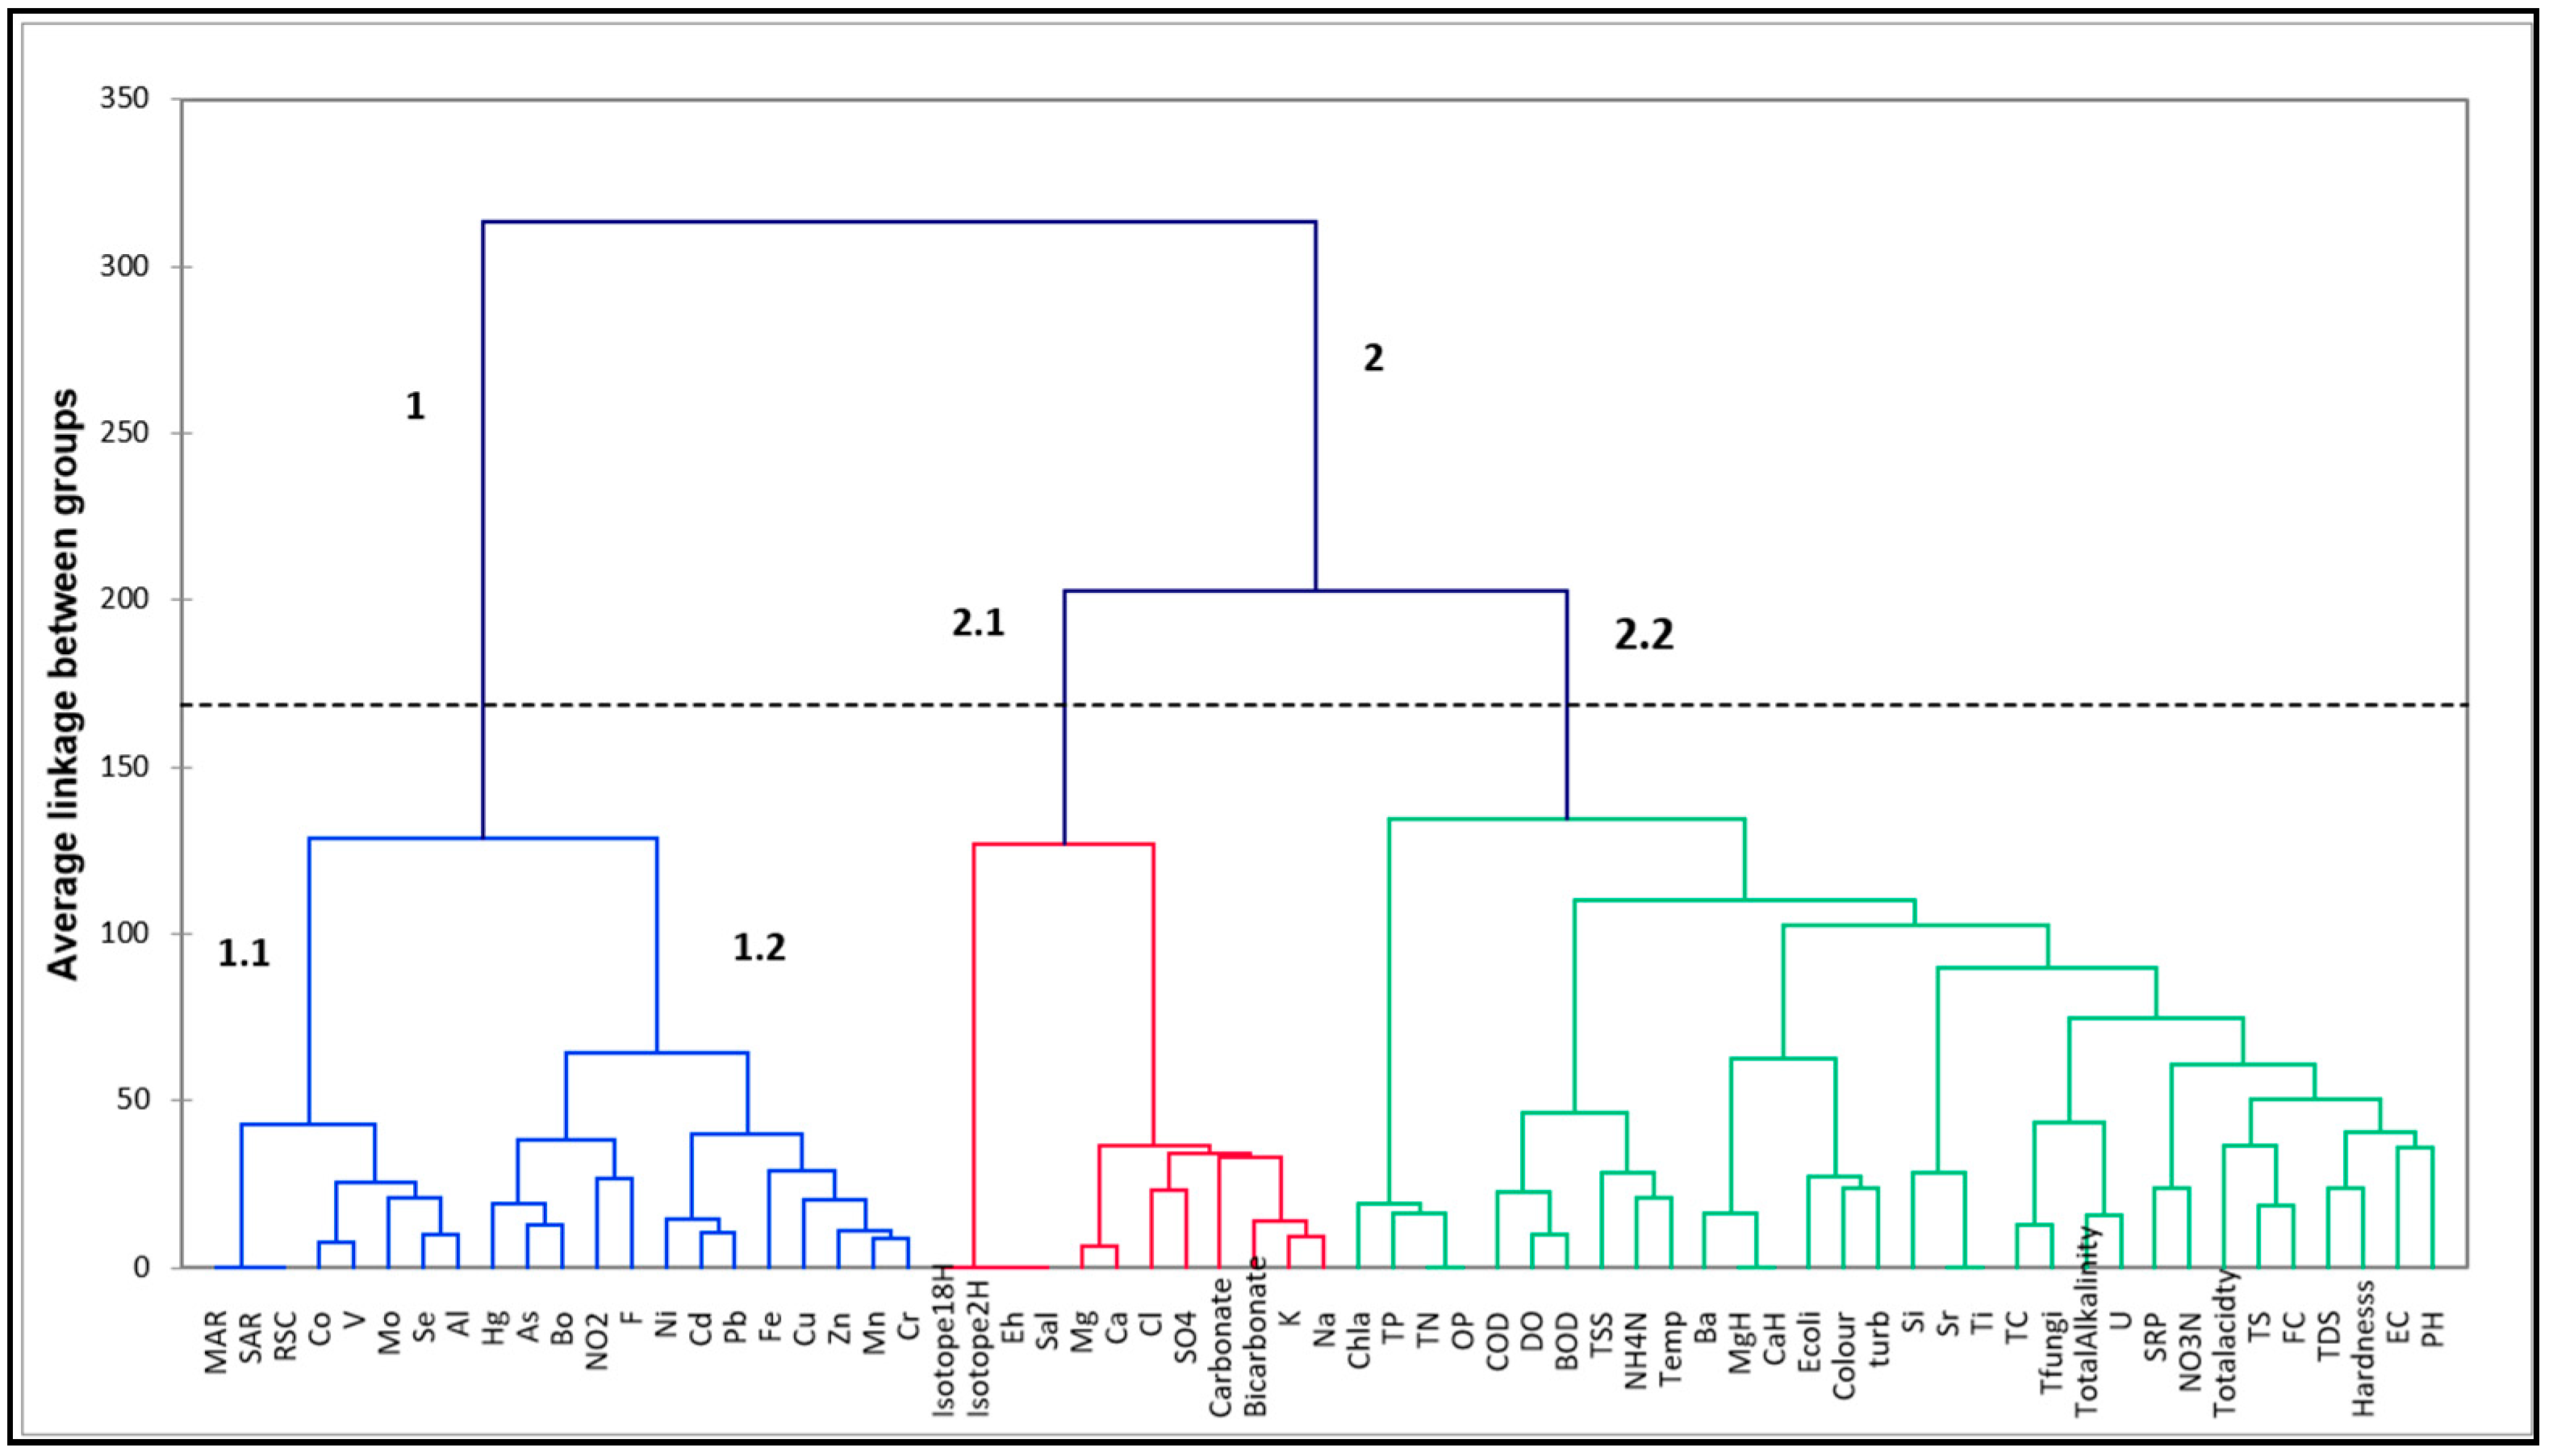
Table 1.
Chronological evolution of WQI development with their respective developmental steps.
| WQI Model | Parameters | Standardisation | Weighting | Aggregation Function | Reference |
|---|---|---|---|---|---|
| Horton index | DO, pH, SC, Alk, temp, CCE, FC, Cl−, PP, OP | Parameters value used as sub-index value | Fixed and unequal system | Weighted Arithmetic Average QI = M1M2 | [15] |
| NSFWQI (1) | DO, BOD, pH, temp, FC, Turb, nitrates, phosphates, TDS | Rating curves; Experts’ opinion | Expert questionnaire | Weighted Arithmetic Average WQI = | [11] |
| Prati’s implicit index | BOD, pH, COD, DO, conc. of permanganate, ammonium, nitrates, Cl−, Fe, Mn, CCE, SS Alkyl Benzene sulphonates | Linear and parabolic function | No | Additive I = | [16] |
| Dinius index (1) | Temp, DO, pH, EC, colour, BOD, Alk, FC, Cl-, hardness, E. coli | Linear and nonlinear function | Delphi technique | Weighted DWQI = | [17] |
| NSFWQI (2) | DO, BOD, PH, temp, FC, Turb, nitrates, phosphates, TDS | Rating curves; Experts’ opinion | Expert questionnaire | Weighted Geometric Average WQI (M) = | [18] |
| Stoner’s index | Irrigation: EC, SAR, SC, Mn, B, As, Cd, Be, Al, Co, Cr, V, Ni, Cu, Zn, F Public water: Cl,MBAs, phenols, nitrates, ammonia, colour, pH, Cu, FC, F, Fe, Zi, sulphates | Limits classes: nonlinear functions | Researcher’s experience | Additive I = + | [19] |
| Dinius Index (2) | Temp, DO, pH, EC, colour, BOD, Alk, FC, Cl−, hardness, E. coli, nitrates | The linear and non-linear function | Delphi technique | Geometrical average IWQ = | [20] |
| Bhargava index | According to the use | Formulas | Weighted Product | Additive WQI = | [21] |
| Smith index | BOD, temp, Turb, SS, DO, ammonia, FC | Rating curves; Experts’ opinion | Delphi technique | Minimum operator I min = | [22] |
| CCME WQI | Minimum of 4, not specified | Standard values | No | Arithmetic average 100 − | [23] |
| New WQI | DO, TP, FC, Turb, SC | No need | Ranking | Logarithmic aggregation SAID WQI = log | [24] |
| Ewaid index | COD, TDS, DO, total hardness, Cl−, TC | Rating curves; Experts’ opinion | Expert opinion | Formula [(−0.019 TDS + 84.587) × 0.2] + [(−0.006 TC + 86.231) × 0.2] + [10 DO × 0.2] + [((−0.119 TH) + 113.68) × 0.15] + [(−5.886 COD +99.846) × 0.1] + [(−0.12 Cl+ 106.58) × 0.15] | [25] |
Notes: The table provides an overview of various WQIs used overtime to monitor water quality. Each WQI has been explained in terms of parameters used, the methods of sub-index development and weighting and finally, the computation of the final index. All the WQIs in the table are original indices developed outside the shores of Africa between 1965 and 2020. Sourced from: [1,3,4,7,22,26,27]. SC—Specific Conductivity, DO—Dissolved Oxygen, Alk—Alkalinity, CCE—Carbon Chloroform Extract, FC—Faecal Coliforms, Cl−—Chloride, PP—Percentage of Population, OP—Obvious Pollution, Turb—Turbidity, BOD—Biochemical Oxygen Demand, TDS—Total Dissolved Solids, Mn—Manganese, Fe—Iron, SS—Suspended Solids, EC—Electrical Conductivity, SAR—Sodium Adsorption Ratio, B—Boron, Be—Beryllium, V—Vanadium, F—Fluorine, TP—Total Phosphorus, COD—Chemical Oxygen Demand, TC—Total Coliforms, As—Arsenic, Cd—Lead, Al—Aluminium, Co—Cobalt, Cr—Chromium, Ni—Nickel, Cu—Copper, Zn—Zinc, MBAs—Methylene Blue Active Substances.
Table 2.
The WQP categories utilised by authors in the 42 articles reviewed.
| Chemical Parameters (52) | Physical Parameters (9) | Microbiological Parameters (4) |
|---|---|---|
| Dissolved Oxygen (DO), pH, Total Phosphorus (TP), chloride (Cl−), Chemical Oxygen Demand (COD), Biochemical Oxygen Demand (BOD), manganese (Mn), Soluble Reactive Phosphorus (SRP), cadmium (Cd), lead (Pb), chromium (Cr), copper (Cu), zinc (Zn), sulphates , arsenic (As), fluoride (F−), mercury (Hg), selenium (Se), cobalt (Co), vanadium (V), magnesium (Mg), sodium adsorption ratio (SAR),Residual Sodium Carbonate (RSC), Magnesium Adsorption Ratio (MAR), nickel (Ni), calcium (Ca2+), nitrites , Total Nitrogen (TN), sodium (Na+), total acidity, total alkalinity, calcium hardness (Ca H), magnesium hardness (Mg H), silica (Si), salinity, boron (Bo), electrode potential (Eh), bicarbonate chlorophyll-a (Chl-a), iron oxide (Fe), Osmotic Potential (OP), barium (Ba), aluminium (Al), potassium (K+), molybdenum (Mo), strontium (Sr), Uranium (U), titanium (Ti), carbonates , ammonium nitrogen (NH4-N), nitrate nitrogen (NO3-N), Isotopes 2-H and 18-O. | Hardness, temperature, colour, total solids (TS), turbidity, suspended solids (SS), total dissolved solids (TDS), and electrical conductivity (EC). | Fecal coliform (FC), Escherichia coli (E. coli), Total Fungi (TF), Total Coliforms (TC). |
Notes: The table illustrates the WQI categories employed in the reviewed articles. Chemical WQPs (81.5%) were the most often employed characteristics, followed by physical WQPs (12.3%) and microbiological WQPs (6.2%).
Table 3.
Parameters selected for various societal needs in the adapted indices.
| Use | Parameters |
|---|---|
| Drinking | Temp, DO, BOD, TDS, TSS, EC, pH, hardness, colour, Alk, total acid, turb, F, Cl− Mn, , , SO4, NO2-N, NO3-N, PO4-P, NH4-N, Cu2+, Fe2+, Fe 3+, Cr, K+, Na+, Zn2+, Ca2+, Mg2+, Pb, As, Ar, Si, Al, Ba, B, U, Se, Mo, Bo, Cd, Hg, Ni, Co, V, E. coli, FC, TC |
| Domestic use | Temp, pH, turb, EC, TDS, TS, hardness, DO, BOD, COD, NO3-N, NH4-N, PO4-P, Cl−, SO4, Mg2+, B, Fe, F, As, Cd, Si, Cr, Sr, Ti, Pb, Ni, Hg, Se, Al, Mn, K+, Na+, Zn2+, Cu2+ Ca2+, Mg2+, , SO4, FC, Eh, salt, SiO2, Isotopes δ2H and δ18O |
| Agriculture and irrigation | Temp, EC, TDS, TS, pH, BOD, DO, Alk, turb, colour, K+, Na+, Zn2+, Ca2+, Mg2+, SO4, Cl−, SO4, , NO3-N, PO4-P, NH4-N, SAR, RSC, , MAR, hardness, B, Al, As, Cd, Co, Cr, Cu, Fe, Mn, Mo, Ni, Pb, Se, V, TC, FC, E. coli, Fungi |
| Protection of aquatic life | Temp, EC, pH, DO, turb, BOD, COD, TSS, TDS, Cl−, Chl-a, F, NH4-N, PO4-N, NO3-N, NO2-N, SO4, OP, Mn, Cu 2+, Zn2+, Pb, Cd, Cr, Ni, Fe, TC |
| Recreation | Temp, pH, turb, EC, Cl−, TSS, SRP, TP, NH4-N, NO3-N, E. coli |
Table 4.
WQI classification using increasing scale.
| Class | a. CCME WQI | b. OWQI | ||
|---|---|---|---|---|
| Rank | Index Score | Rank | Index Score | |
| Class 1 | Excellent | 95–100 | Excellent | 90–100 |
| Class 2 | Good | 80–94 | Good | 85–89 |
| Class 3 | Fair | 60–79 | Fair | 80–84 |
| Class 4 | Marginal | 45–59 | Poor | 60–79 |
| Class 5 | Poor | 0–44 | Very poor | 0–59 |
Table 5.
WQI classification using decreasing scale.
| Class | a. TMWQI | b. RWQI | ||
|---|---|---|---|---|
| Rank | Index Score | Rank | Index Score | |
| Class 1 | Excellent | <26 | Excellent | <50 |
| Class 2 | Good | 26–50 | Good | 50–100 |
| Class 3 | Medium | 51–75 | Poor | 100–200 |
| Class 4 | Poor | 76–100 | Very poor | 200–300 |
| Class 5 | Unsuitable | >100 | Unsuitable | >100 |
Table 6.
Classification of WQI value using colour schemes in the original WAWQI model.
| Colour | Rank | Index Value |
|---|---|---|
| Dark red | Very poor | 0–10 |
| Orange | Poor | * |
| Yellow | Medium/Average | 50 |
| Green | Good | ** |
| Dark blue | Excellent | 90–100 |
Table 7.
Classification scale for WQI scores in the adapted indices.
| Class | a. | b. | ||
|---|---|---|---|---|
| Rank | Index Score | Rank | Index Score | |
| Class 1 | <50 | Excellent | 0–25 | Excellent |
| Class 2 | 50–100 | Good | 26–50 | Good |
| Class 3 | 100–200 | Poor | 51–75 | Poor |
| Class 4 | 200–300 | Very poor | 76–100 | Very poor |
| Class 5 | >300 | Unsuitable for human consumption | >100 | Unsuitable for human consumption |
Table 8.
Classification of WQI scores using logical linguistic descriptions.
| Class | a. | b. | ||
|---|---|---|---|---|
| Rank | Index Score | Rank | Index Score | |
| Class 1 | 91 ≤ Index ≤ 100 | Good | >2.8 | Excellent |
| Class 2 | 61 ≤ Index < 91 | Acceptable | 2.3–2.8 | Good |
| Class 3 | 31 ≤ Index < 61 | Regular | <2.3 | Poor |
| Class 4 | 16 ≤ Index < 31 | Bad | ||
| Class 5 | 0 ≤ Index < 16 | Very bad | ||
Table 9.
Comparison table among adapted WQIs and the new approach WQI models.
| Metrics of Comparison | Adapted WQIs | The DEA Model | UWQI | Surrogate WQI | Hounsinou Scale |
|---|---|---|---|---|---|
| 1. Parameter selection | Researchers’ discretion | Value observation | Expert opinion | Delphi technique multivariate statistics | Researchers’ discretion |
| 2. No. of parameters | average: 14 | 10 | 13 | 4 | 27 |
| 3. Type of parameters | Physical, chemical, microbiological | Physical, chemical | Physical, chemical | Physical, chemical | Physical, chemical, microbiological |
| 4. Index development steps | Parameter selection, the establishment of parameter weights, the formation of sub-indices and the final aggregation function | Creation of input variables, classification to obtain optimistic closeness values, Banker Charnes Cooper, (BCC) model with a single output, WQI | Parameter selection, the establishment of weight coefficients, formation of sub-indices and aggregation formula | Delphi method, PCA, Hierarchical Cluster Analysis (HCA), Multivariate Regression Analysis (MRA), Regression model | Parameter selection, the establishment of parameter weights, formation of sub-indices and the final aggregation function |
| 5. Index aggregation function | Weighted Arithmetic function WQI = | WQI = | Modified weighted sum to to Final UWQI function WQI = to 1.0880563 | Surrogate WQI = f(x) = b0 + b1x1 + b2x2 + … + b4x4 + ε | CWQI = MWQI = 1/3 (10/9 TC + 20 FC + 1000 EI) |
| 6. Water quality standards | Sub-index development using FAO guidelines for irrigation, South African National Water Standards, etc. | Classification of each hydrochemical parameter into quality categories using WHO guidelines for drinking water, National agency for hydraulic resources, etc. | Sub-index development using South Africas water quality guidelines implemented by water and forestry depatment | - | Sub-index development usingWHO guidelines for drinking water quality |
| 7. Index categorisation scheme | Adapted CCMEWQI-increasing categorisation scale with 5 classes Adapted WAWQI- decreasing scale with 5 classes | Sturges’s rule I = 1 + 3.322log10(K) | Increasing categorisation scale with 5 classes, including logical linguistic descriptors | Increasing categorisation scale with 5 classes | CWQI-decreasing categorisation scale with 7 classes MWQI-decreasing categorisation scale with 8 classes |
Notes: The table provides a comparison of similarities and differences between the adapted WQIs and the new models from the African perspective.
Disclaimer/Publisher’s Note: The statements, opinions and data contained in all publications are solely those of the individual author(s) and contributor(s) and not of MDPI and/or the editor(s). MDPI and/or the editor(s) disclaim responsibility for any injury to people or property resulting from any ideas, methods, instructions or products referred to in the content. |
© 2023 by the authors. Licensee MDPI, Basel, Switzerland. This article is an open access article distributed under the terms and conditions of the Creative Commons Attribution (CC BY) license (https://creativecommons.org/licenses/by/4.0/).
Share and Cite
MDPI and ACS Style
Lukhabi, D.K.; Mensah, P.K.; Asare, N.K.; Pulumuka-Kamanga, T.; Ouma, K.O. Adapted Water Quality Indices: Limitations and Potential for Water Quality Monitoring in Africa. Water 2023, 15, 1736. https://doi.org/10.3390/w15091736
AMA Style
Lukhabi DK, Mensah PK, Asare NK, Pulumuka-Kamanga T, Ouma KO. Adapted Water Quality Indices: Limitations and Potential for Water Quality Monitoring in Africa. Water. 2023; 15(9):1736. https://doi.org/10.3390/w15091736
Chicago/Turabian StyleLukhabi, Dorothy Khasisi, Paul Kojo Mensah, Noble Kwame Asare, Tchaka Pulumuka-Kamanga, and Kennedy Ochieng Ouma. 2023. "Adapted Water Quality Indices: Limitations and Potential for Water Quality Monitoring in Africa" Water 15, no. 9: 1736. https://doi.org/10.3390/w15091736
Note that from the first issue of 2016, this journal uses article numbers instead of page numbers. See further details here.