Article

Modeling Hydrological Responses to Land Use Change in Sejnane Watershed, Northern Tunisia

1
LR03AGR02 Research Laboratory of Agricultural Production Systems and Sustainable Development, Higher School of Agriculture, University of Carthage, Zaghouan 1121, Tunisia
2
Centre de Recherches et des Technologies des eaux, Route Touristique de Soliman, P.O. Box 273-8020, Soliman, Tunisia
3
LR17AGR01 Integrated Management of Natural Resources: Remote Sensing, Spatial Analysis and Modeling (GREEN-TEAM), National Agronomic Institute of Tunisia (INAT), University of Carthage, 43, Avenue Charles Nicolle, Tunis 1082, Tunisia
4
New York City College of Technology, The City University of New York, 300 Jay St, Brooklyn, NY 11201, USA
5
Laboratoire Milieu Marin (LMM), Institut National des Sciences et Technologies de la Mer (INSTM), 28 Rue 2 Mars 1934 Carthage Salammbô, Tunis 2025, Tunisia
*
Author to whom correspondence should be addressed.
Water 2023, 15(9), 1737; https://doi.org/10.3390/w15091737
Submission received: 14 February 2023 / Revised: 15 April 2023 / Accepted: 24 April 2023 / Published: 30 April 2023

Abstract

:
Land use change is a crucial driving factor in hydrological processes. Understanding its long-term dynamics is essential for sustainable water resources management. This study sought to quantify and analyze land use change between 1985 and 2021 and its impacts on the hydrology of the Sejnane watershed, northern Tunisia. Remote sensing and a SWAT model using the SUFI-2 algorithm to identify the most sensitive parameters were used to achieve this objective. Land use maps were developed for 1985, 2001 and 2021. For the last 37 years, the watershed experienced a slight decrease in forest, scrubland and forage crops, a significant reduction in grassland, and a conspicuous expansion of olive trees and vegetable crops. Given the scarcity of observed discharge data, a SWAT model was calibrated for the period 1997–2010 and validated for 2011–2019. Model performance was good for both calibration (NSE = 0.78, PBIAS = −6.6 and R2 = 0.85) and validation (NSE = 0.70, PBIAS = −29.2 and R2 = 0.81). Changes in land use strongly affected the water balance components. Surface runoff and percolation were the most influenced, showing an increase in runoff and a decrease in percolation by 15.5% and 13.8%, respectively. The results revealed that the construction of the Sejnane dam, the extension of irrigated perimeters and olive tree plantations were the major contributors to changes in hydrology.

1. Introduction

Water resources are crucial in promoting socio-economic growth in developing countries. Nevertheless, over recent decades, water availability has been increasingly threatened by the combined effect of climate change and human activities, which has become a major constraint for economic progress [1,2]. In Europe, for instance, several studies on extreme hydrological events have indicated a smaller number of floods in the last century, but more severe, and more unprecedented, summer droughts [3,4]. Thus, adaptation to these changes in climate will be vital economically, socially and culturally, not only from an environmental perspective, but in terms of setting political strategies [5].
Human activities affect land cover and resource usage due to a growing population, urban settlements, natural resource use, pressures on land for agriculture, deforestation, desertification, desalination, global warming, and many others which are among the primary driving factors for environmental change in developing countries. From a hydrological viewpoint, land use and land cover (LULC) are important in understanding watershed hydrological response and soil disturbances [6,7]. Thus, changing land use could have major impacts on water availability and safety, especially in fragile arid and semi-arid areas with high population pressure [7,8,9,10].
This research topic has attracted the attention of many researchers in recent decades; several studies have documented the impact of land use changes on hydrological patterns at river basin scale using paired catchment experiments, multivariate statistics, remote sensing and hydrological modeling [11,12,13,14,15]. Yet, the impact of LULC on watershed hydrology, as shown by various studies, is still conflicting and case-dependent. Guzha et al. (2018) [16] indicated that land change alone is not an accurate predictor of hydrological fluxes in east African catchments and supported the need for long-term field monitoring to better understand catchment responses and to improve the calibration of currently used simulation models. They found that there was no significant difference in stream discharge for forest loss between bamboo and pine plantation catchments, and between cultivated and tea plantation catchments, despite forest cover loss. Other studies have indicated that measurable changes in water yield are obtained when there is forest cover change [17].
Further, numerous hydrological models have been employed to understand the interaction between land use and hydrologic behavior, ranging from simple models to assess the relation between land use pattern and different components of the water balance to distributed physically based models, such as SWAT [18], VIC [19], TOPMODEL [20], and MIKE SHE [21,22]. The latter type of model considers the heterogeneity of complex watersheds and provides a better understanding of the relationship between hydrological processes and global changes [12,23,24,25,26]. Among these models, the soil and water assessment tool (SWAT), a distributed agro-hydrological model, which has been reported in several studies documenting its application in this context throughout the world, has demonstrated its effectiveness at different catchment scales and under different climate conditions. For instance, Gashaw et al. (2018) [27] reported acceptable results for LULC changes on hydrology, ecosystem functions and services in the upper Blue Nile basin of Ethiopia. Boongaling et al. (2018) [28] applied the SWAT model to assess the effects of land use change on hydrologic processes and the use of landscape metrics for watershed management in an ungauged catchment in the Philippines. The results showed that there was a strong correlation between landscape pattern and hydrology. Sertel et al. (2019) [29] applied the SWAT model to evaluate the impact of rapid urbanization on the Buyukcekmece water basin of Istanbul metropolitan city in Turkey. The results showed that, among the different hydrological components, percolation, evapotranspiration and base flow were the most sensitive to LULC changes. Zhang et al. (2020) [30] used a coupled SWAT-MODFLOW model to analyze the response of surface runoff and recharge rate to land use change; their results provided useful information for water resources management under the situation of rapid urbanization. Halima et al. (2022) [31] determined the hydrological response to land use and land cover change on the slopes of Kilimanjaro and the Meru Mountains in Kenya.
In Tunisia, although land use changes are significant, studies on the impact of LULC dynamics on the hydrology regime are limited. In particular, the Sejnane river basin, located in the northeast of Tunisia, has experienced important land use changes in the last few decades. The main driving factor has been the construction of a dam leading to the extension of agricultural lands and irrigated areas. Indeed, the Sejnane dam has been of great importance in the water supply scheme as it provides annually about 50 Mm3 for drinking water and irrigation for local and regional inhabitants. Another important factor has been population growth and the resulting development of human activities, which has had noticeable consequences on land use patterns. Further the Sejnane catchment is the major freshwater contributor to the ecosystem of the Ichkeul Lake, a RAMSAR site and a UNESCO biosphere reserve [32].
Hence, this paper provides a case study from the Sejnane watershed to test the performance of the SWAT model in predicting surface runoff under scarce observed discharge values and in assessing the impact of land use changes on hydrologic components over the last 40 years.

2. Materials and Methods
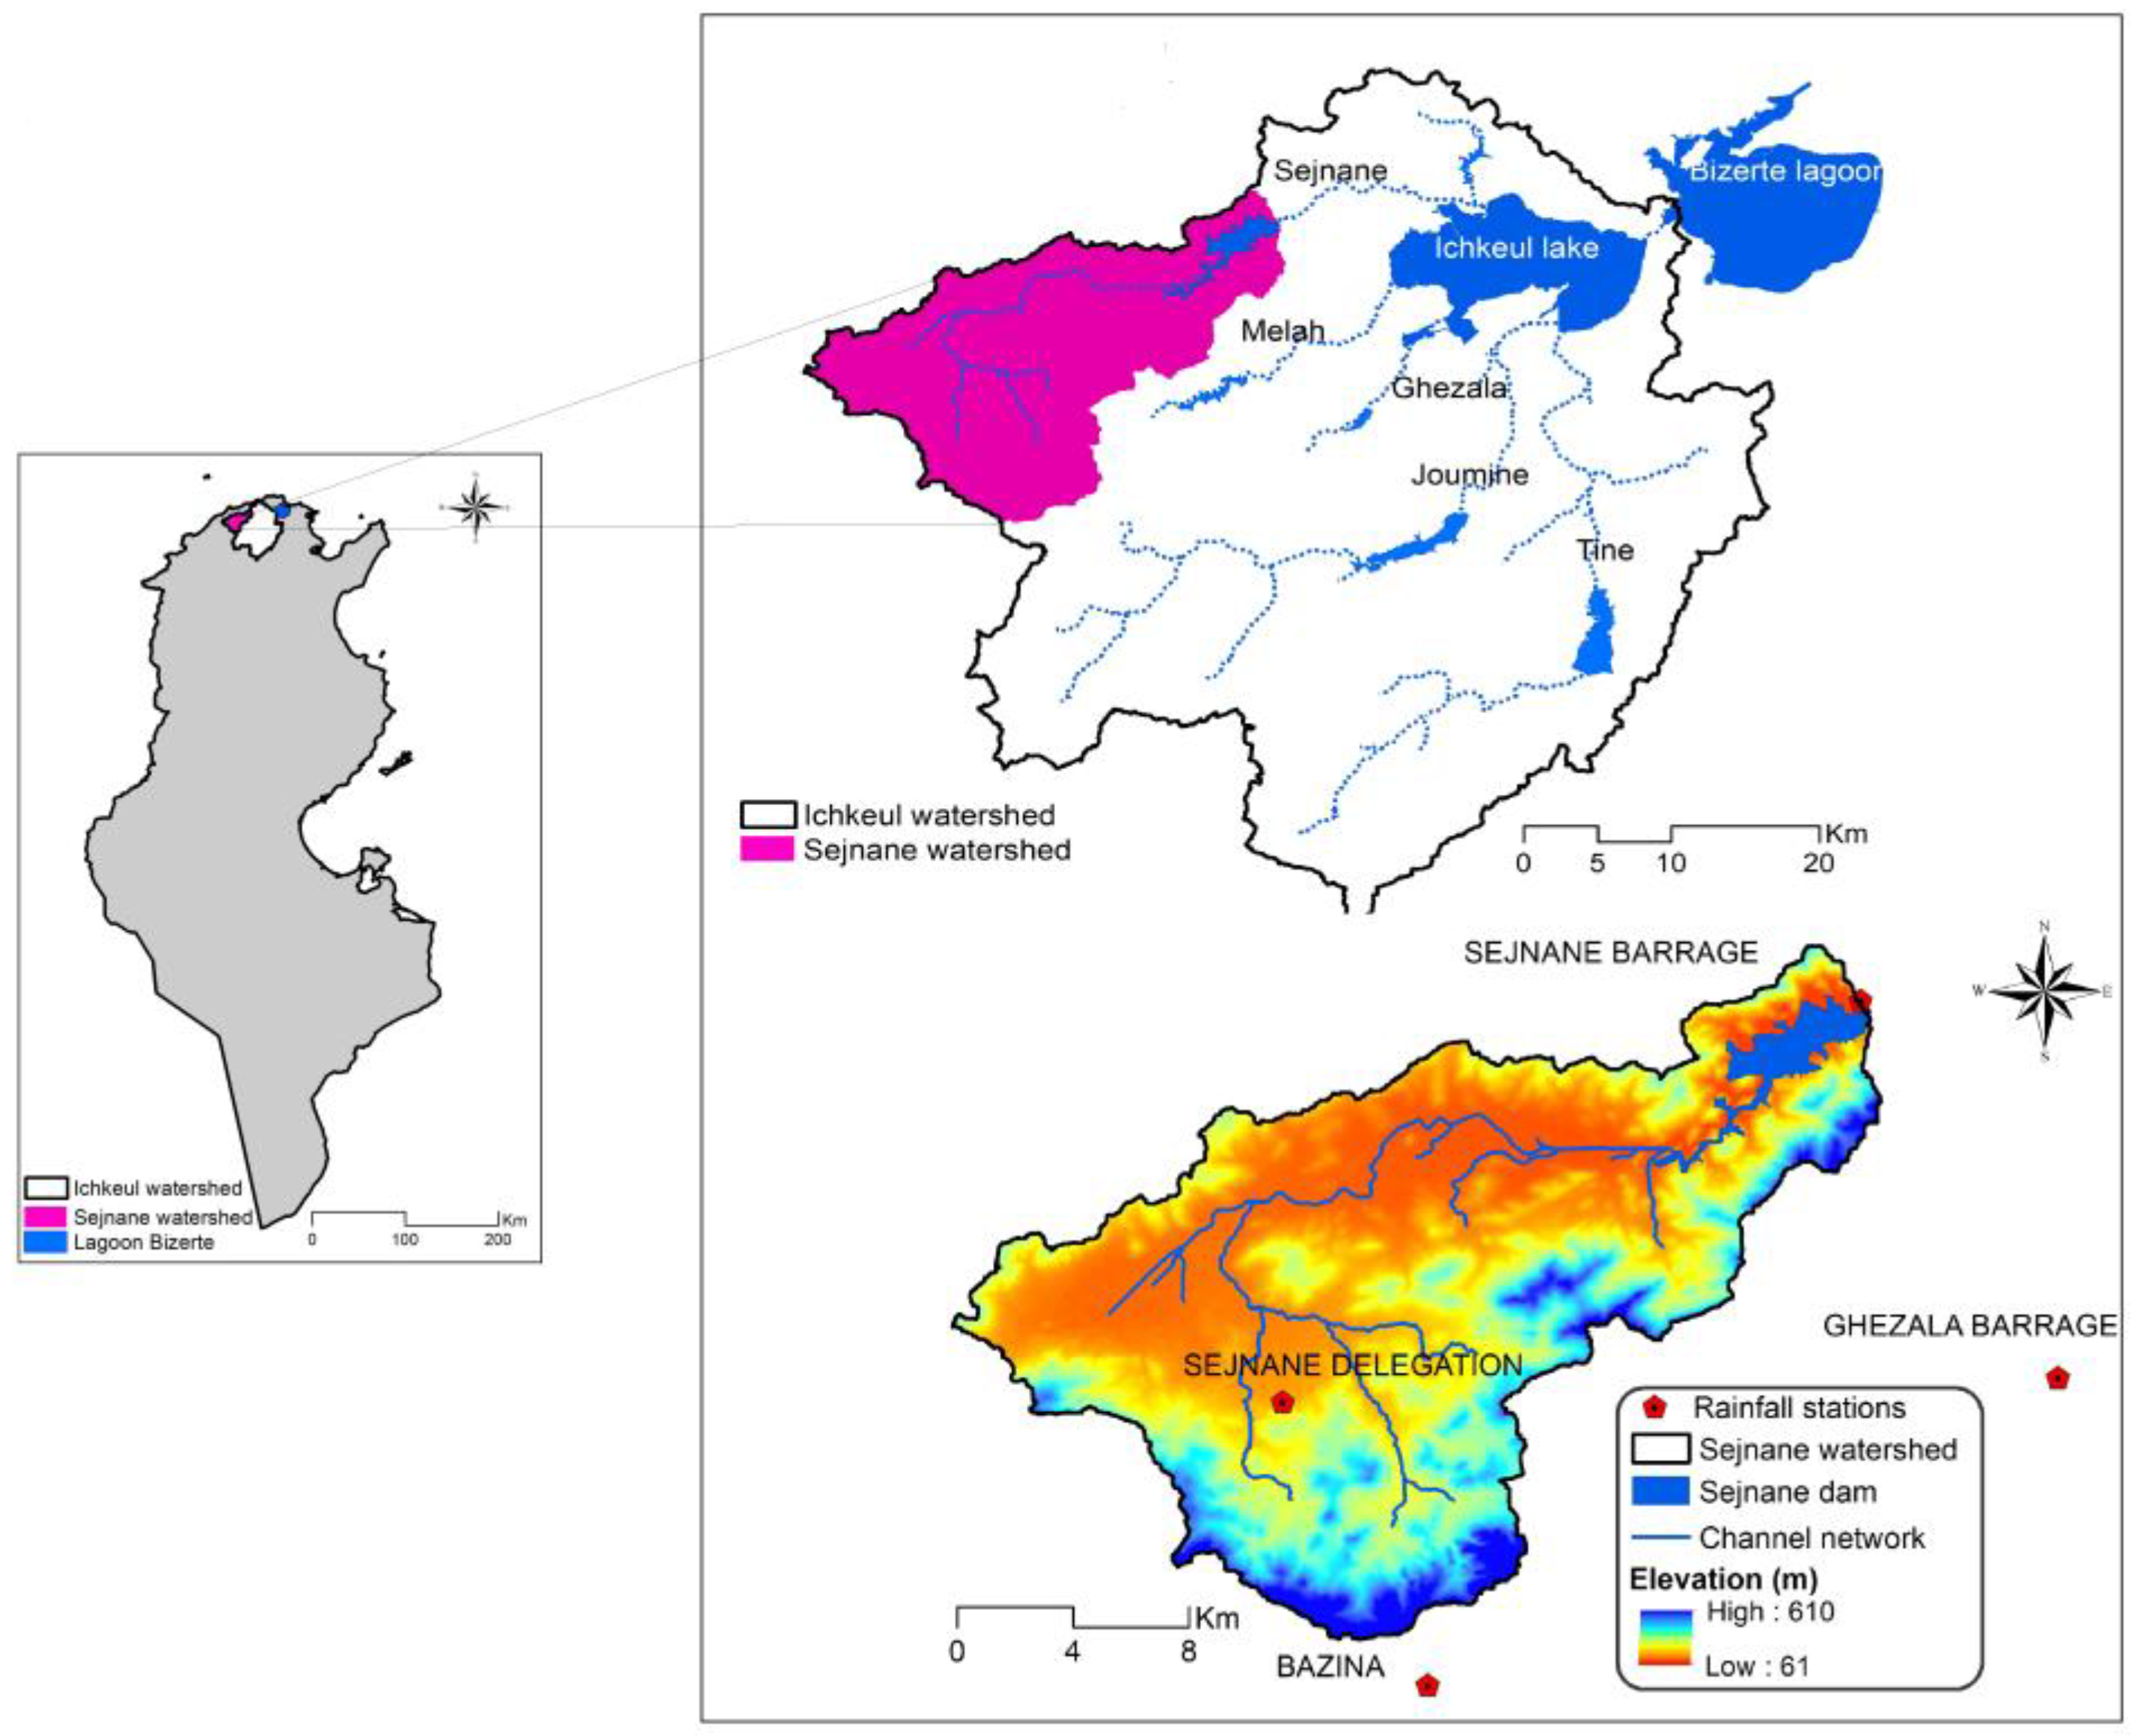
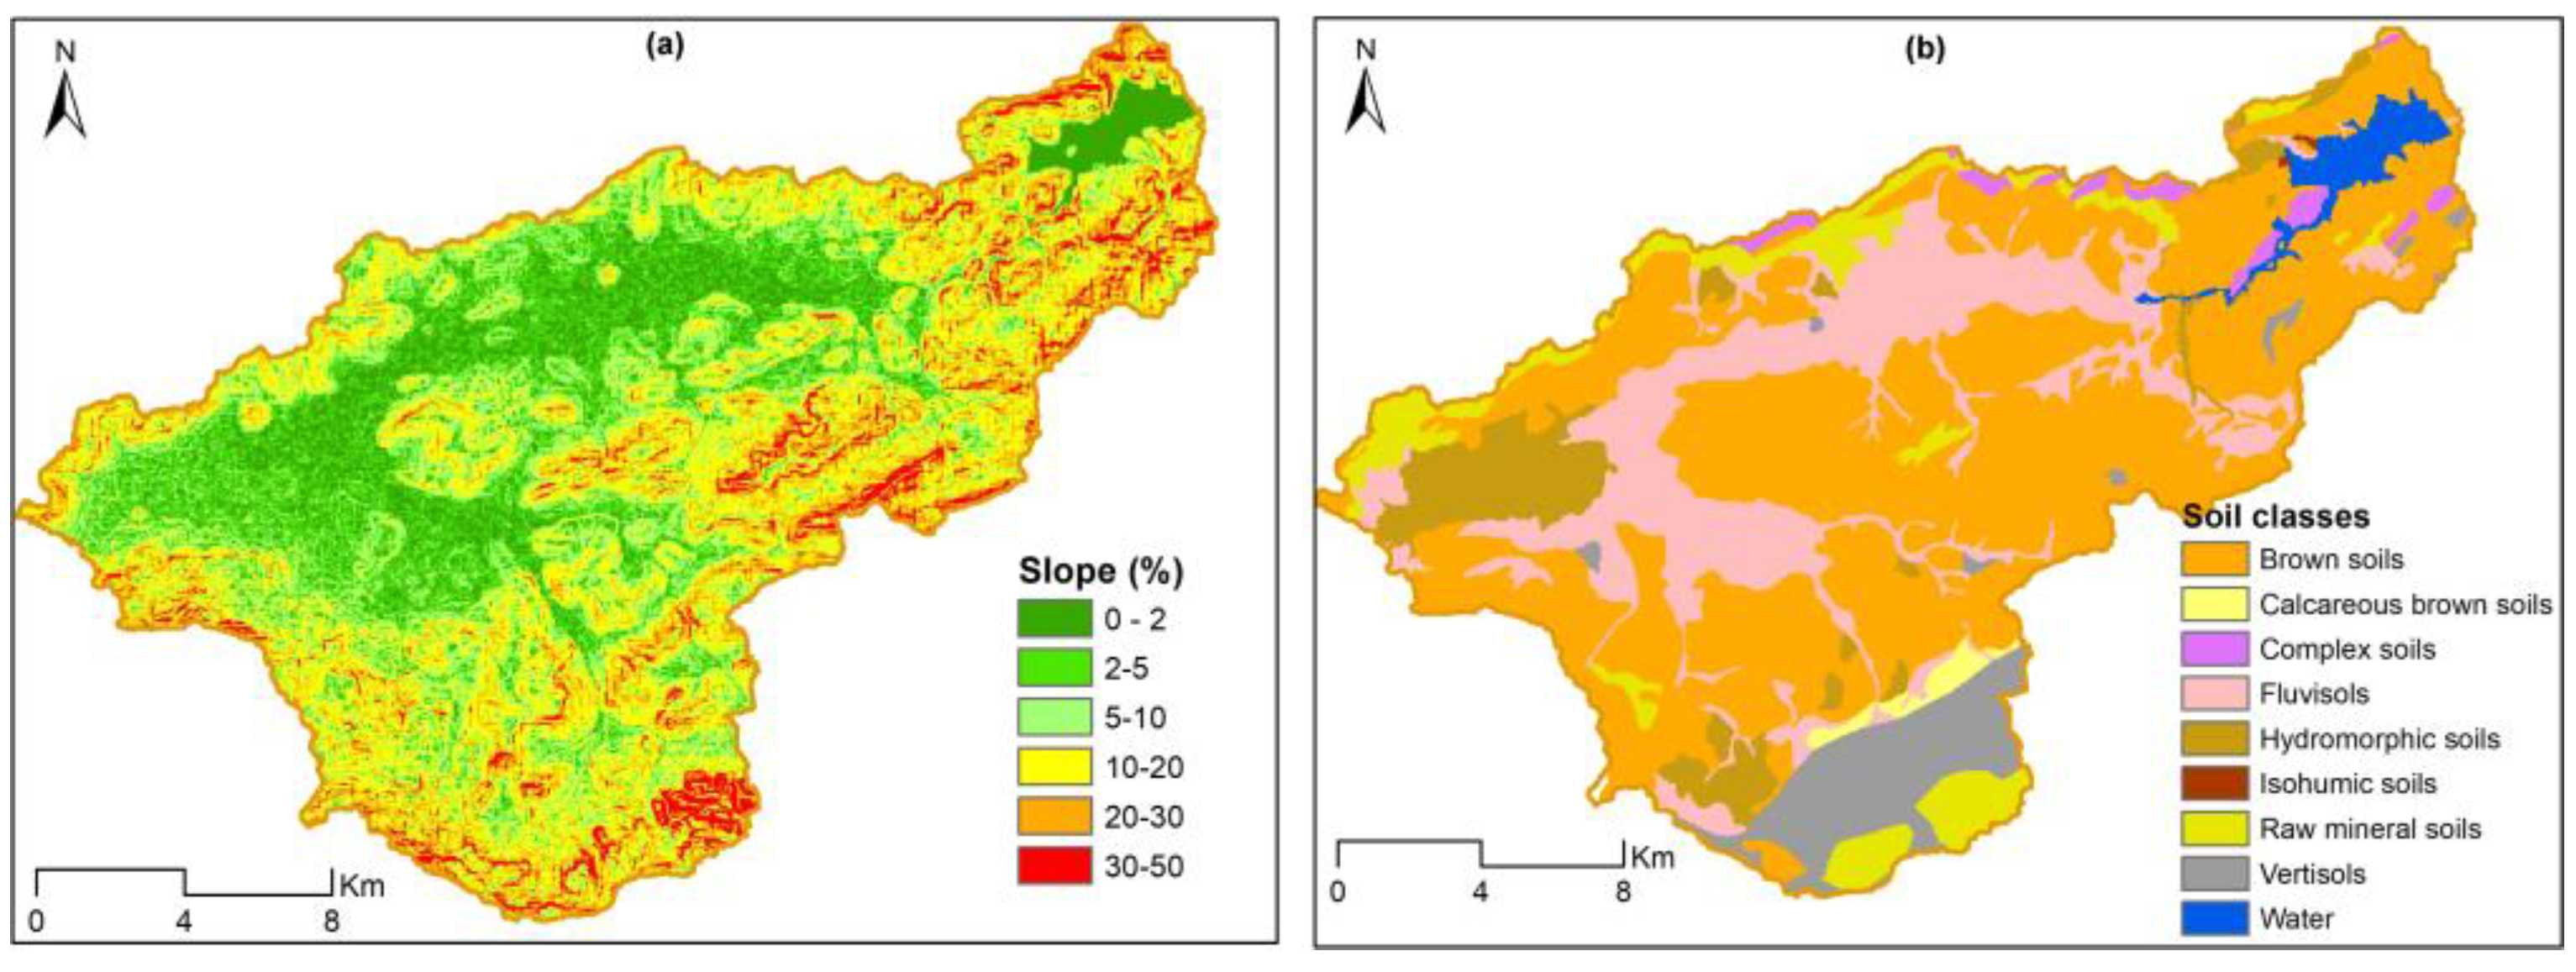
2.1. Study Area

The study site was the Sejnane watershed located in the north of Tunisia, in the large Ichkeul catchment (2230 km2); it covers an area of 367 km2 (Figure 1). The main river flows over 52 km, originating in the El Krab and Fayjel mountains. The Sejnane river crosses a temporary wetland (Garâat Sejnane) and discharges into the northwestern part of Ichkeul lake, feeding it with freshwater. In 1977, this lake was declared a UNESCO World Heritage Site [32]. The topography of the Sejnane basin is characterized by variation from flat to mountainous terrain (Djebel el Krab and al Fayjal), the altitude ranging between 61 and 610 m above the sea level.
The study area has a Mediterranean sub-humid climate with mild winters. It is characterized by high rainfall variability. During the period 1990–2019, mean annual precipitation was 906 mm; the wettest year was 1996 (1331 mm) and the driest year was 1993 (402 mm). At a monthly scale, November and December were the wettest months (140 mm and 144 mm, respectively). The monthly air temperature ranged between 10 °C in February and 27 °C in August. The Sejnane watershed has undergone significant changes in land use and land cover occupation. In 2021, the basin was dominated by hardwood forests (25%), olives (22%), vegetable cropping (14%), scrubland (13.7%), and annual crops (10.6%), while the rest of the basin consisted of bare land (7.9%), grassland (3.6%), water bodies (1.8%) and urban land (1.5%) (Table 1).
The dominant soils are reddish sandstone and silty clays. The Sejnane dam was constructed at the outlet of the basin in 1994 with a capacity of 138 Mm3. This dam supplies water for drinking and irrigation as it is a part of the water transfer scheme.

2.2. SWAT Model Description and Performance Evaluation
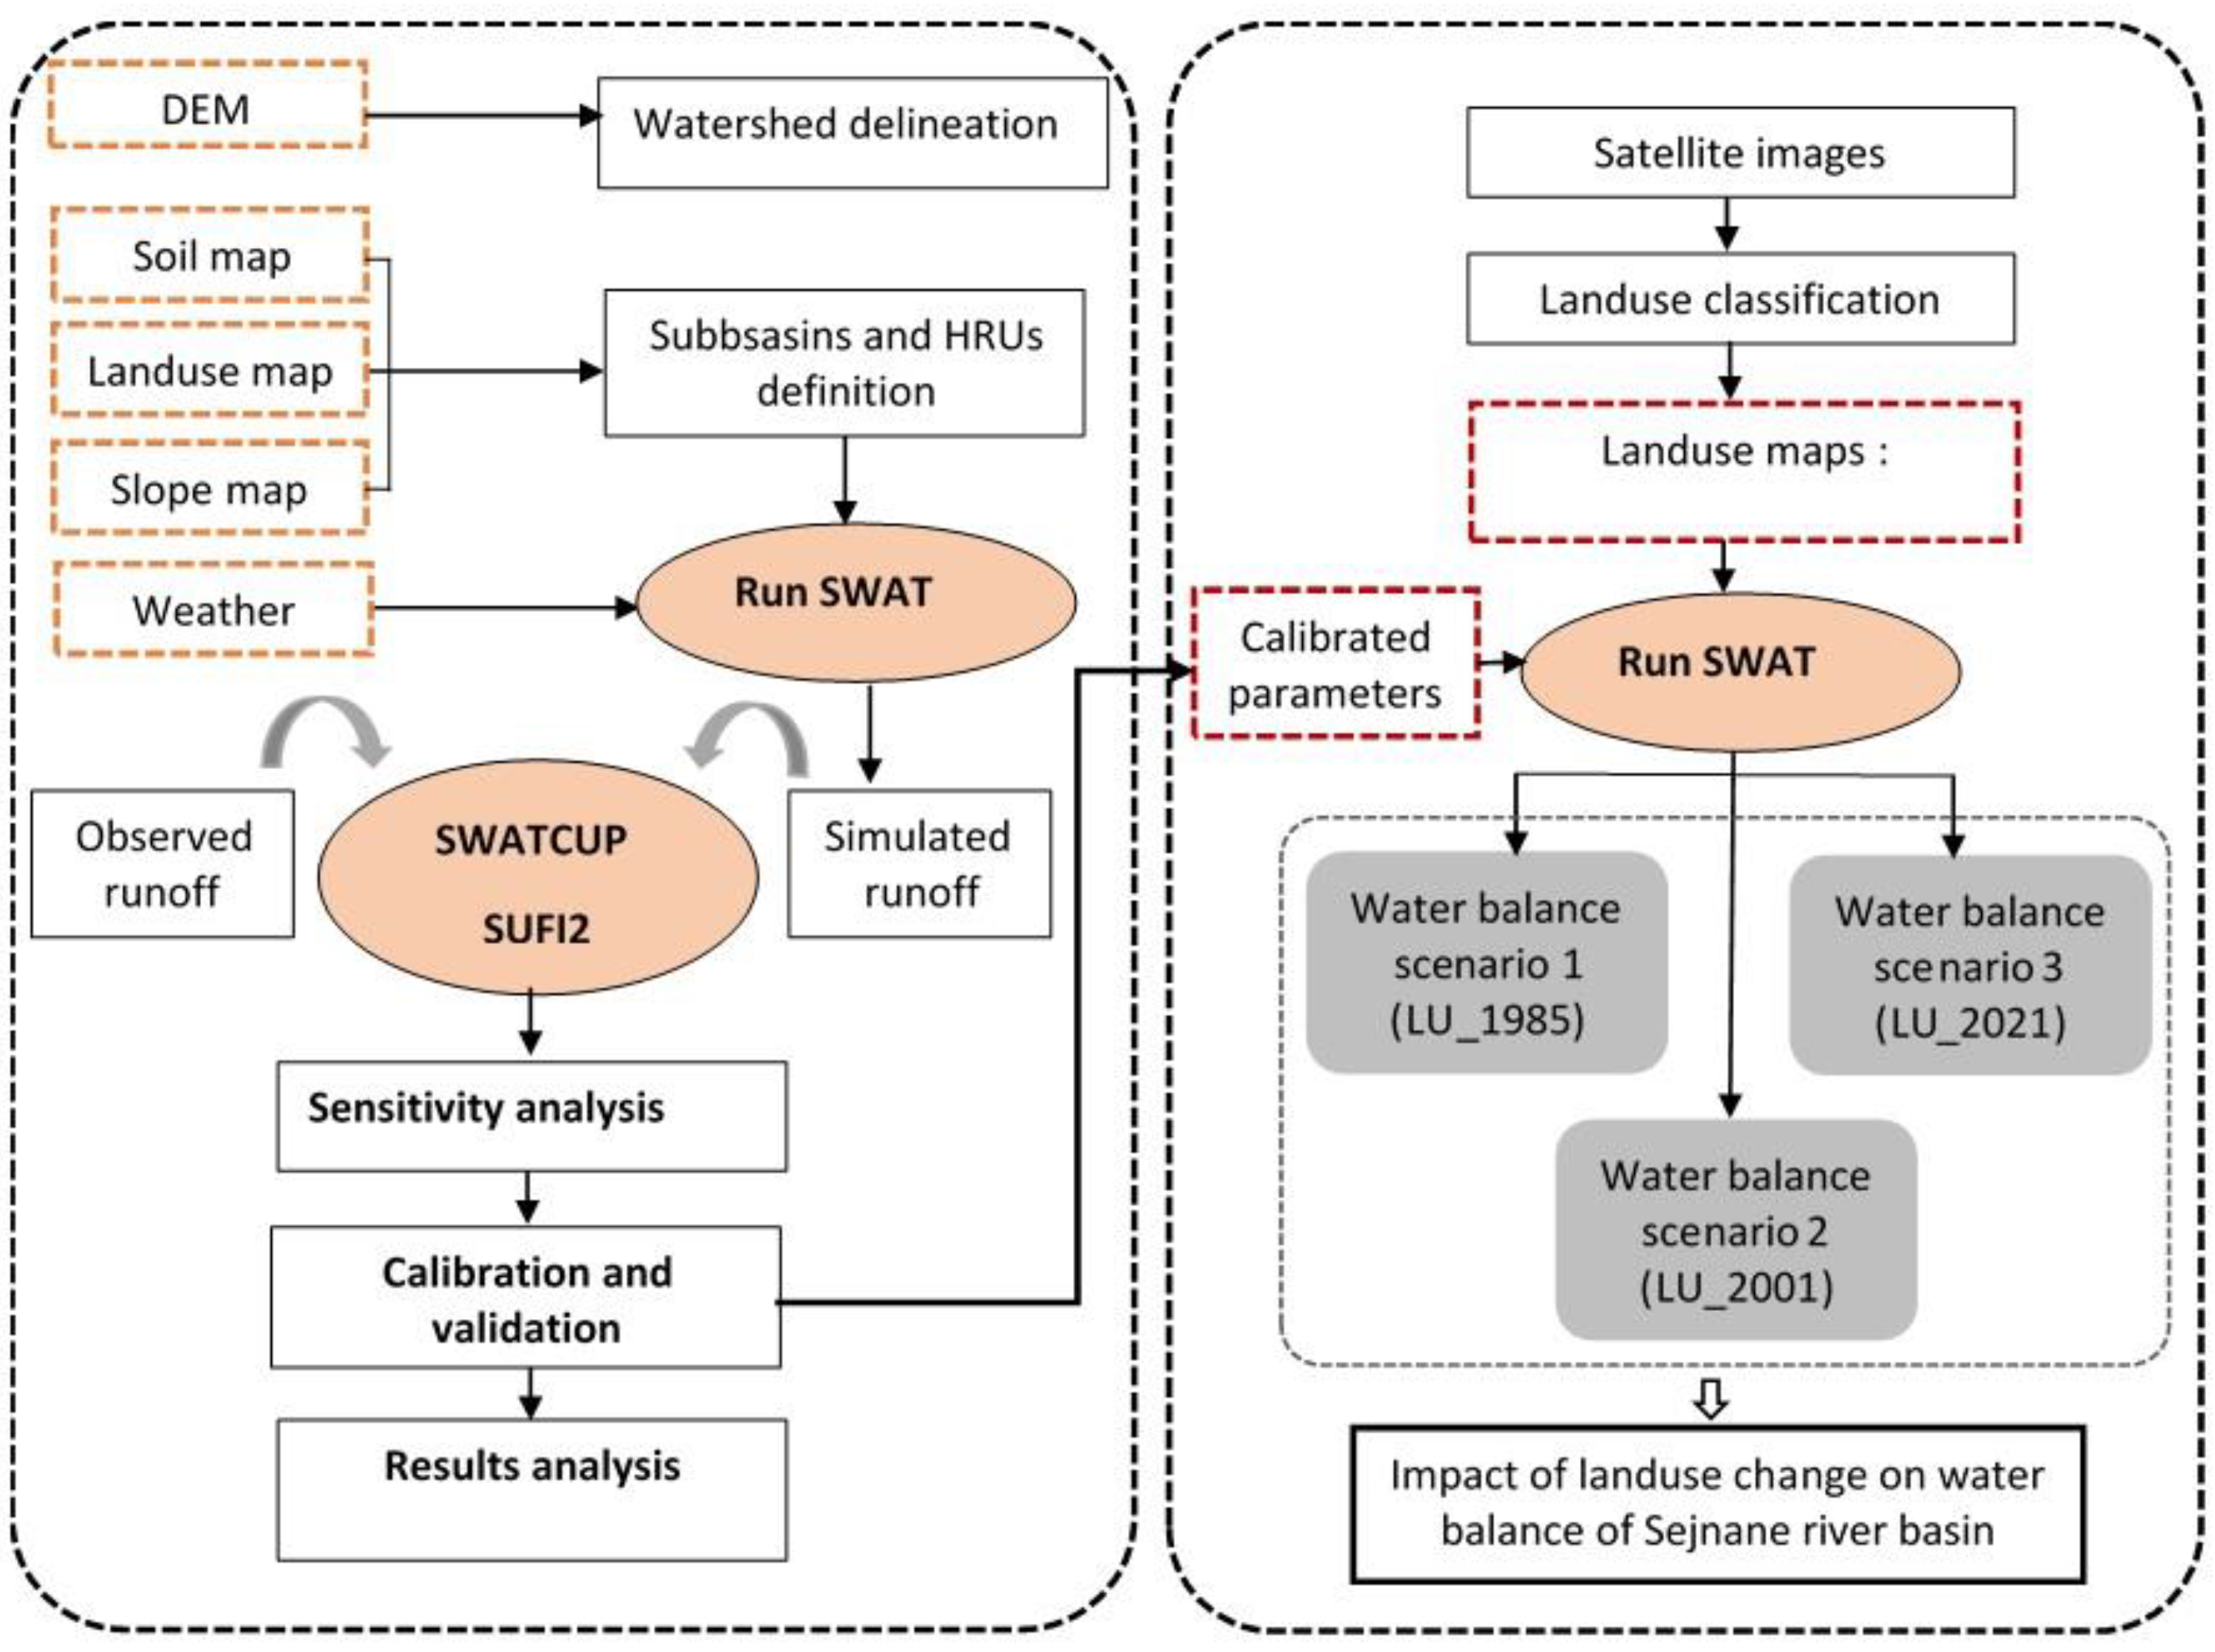
SWAT is a continuous time, physically based, distributed hydrological model developed to simulate the impact of land management practices on water resources, sediment, and agricultural chemical yields in large complex watersheds [33,34]. Hydrological processes, such as precipitation, surface runoff, infiltration and evapotranspiration, are simulated by the SWAT model.
Three statistical criteria were used for model performance evaluation: the Nash–Sutcliffe efficiency (NSE) to indicate the degree of fitness between simulation and observation results; the percent bias (PBIAS) to measure the tendency of simulated values to be higher or lower than observed values; and the coefficient of determination (R2) to express the ability of the model to predict the outcome in a linear regression setting.
N S E = 1 i = 1 n Q i o b s Q i s i m 2 i = 1 n Q i o b s Q m e a n . o b s 2
P B I A S = i = 1 n Q i o b s Q i s i m i = 1 n Q i o b s × 100
R 2 = Q i o b s Q m o y o b s × Q i s i m Q m o y s i m i = 1 n Q i o b s Q m e a n . o b s 2 × i = 1 n Q i s i m Q m e a n . s i m 2 2
where, Qiobs is the observed streamflow, Qisim is the simulated streamflow, Qmean.obs is the average observed streamflow, Qmean.sim is the average simulated streamflow and n is the total number of observed data.

2.3. Methodology

2.3.1. Model Setup and Input Data

The model setup requires meteorological data, topography, land use and soil types. Daily precipitation (1980–2018) was obtained from six rain gauge stations provided by the hydrological service of the Water Resources Directorate in the Ministry of Agriculture. Daily minimal and maximal temperature were collected for the same period by the National Institute of Meteorology (INM) from the Bizerte meteorological station and were used to provide evapotranspiration using the Hargreaves formula [35]. The 30 m digital elevation model (DEM) was downloaded from the portal of https://earthexplorer.usgs.gov (accessed on 1 April 2021) and was used to calculate the slope (Figure 2a). A soil map and soil-related parameters were obtained from the Soil and Agriculture Land Authority [36] (Figure 2b).
The spatial distribution of soil types showed that brown soils represented the dominant soil class with 54% followed by fluvisols (21%). Multidate land use maps (1985, 2001 and 2021) were elaborated using different remote sensing techniques and simulated separately without considering climate change. The main land use types in the Sejnane watershed were forest, scrubland, agricultural land, and grassland (Table 1). The used dates were not chosen arbitrarily: the land use map of 1985 was used to show the landscape pattern of the basin before the construction of the dam; the 2001 map reflects the land use change after the impoundment of the dam; the 2021 land use map illustrates the recent land use in the Sejnane watershed. Based on the topography of the basin, the model divided the watershed into 23 sub-watersheds, which were further sub-divided into 985 hydrologic response units (HRUs). Each HRU consists of a homogeneous soil type, land use and slope [33].

2.3.2. Sensitivity Analysis, Calibration, and Validation

Sensitivity analysis and calibration were performed using the Sequential Uncertainty Fitting version 2 (SUFI-2) algorithm in SWAT-CUP software [37]. The parameter uncertainties were quantified by a measure referred to as the P-factor, which is the percentage of measured data bracketed by the 95% prediction uncertainty (95PPU), and the R-factor, which is the average thickness of the 95PPU band divided by the standard deviation of the measured data [37].
Given the scarcity of daily discharge values, the Sejnane dam inflows were used for comparison with simulated values. The model was calibrated for the period 1997–2010 after a two-year warming-up period, while the period 2011 to 2019 was selected for validation. The historic period 1980–1996 was not taken into consideration for calibration purposes given the lack of observed flow.

2.3.3. Land Use Assessment

Land cover changes in the Sejnane watershed were monitoring using multi-temporal remote sensing data from the Landsat multispectral image Thematic Mapper (Landsat5-TM) and Sentinel 2. Landsat data were download from the United States Geological Survey (USGS) website (http://glovis.usgs.gov (accessed on 1 June 2021)). The Multispectral Instrument (MSI) Sentinel 2A for 2021 (Path/Row: 102/026 and 029) was freely downloaded from the portal https://catalogue.theia-land.fr (accessed on 1 August 2021).
To assess the spatial and temporal variation in LULC, three different dates were selected (1985, 2001 and 2021). In each year, four images were carefully chosen for the same season and combined to reduce cloud cover and to consider LU seasonal changes.
For Landsat5-TM, the visible and near bands were used with 30 m resolution. On the other hand, bands 2, 3, 4 and 8 for Sentinel 2 were used with 10 m resolution. All images were pre-processed by geometric correction with a UTM WGS84 UTM Zone 32N projection and atmospheric correction using dark object subtraction. Table 2 summarizes all the satellite image characteristics and acquisition dates.
The 2021 SENTINEL 2A images were classified based on 200 field observation data and using the random forest algorithm [38,39] and OTB 7.0.0 and QGIS 3.10. A confusion matrix was adopted to evaluate the agreement between the result and the classified image; hence, the Kappa coefficient and the overall accuracy percentage were calculated. In land use map 2021, the Kappa coefficient value was 0.82 and the overall accuracy was 84.3%, indicating significant land use accuracy (Table 3). Nine land use classes were identified: Forest; Scrubland; Grassland; Forage; Vegetable crops; Olives; Bare land; Urban area and Water bodies).
Given the absence of ground truth during 1985 and 2001, the unsupervised classification and the k-means classifier for Landsat data were implemented. The 1985 land use yearly map was classified into six (Forest; Scrubland; Grassland; Forage; Bare land and Urban area). While, for the 2001 map, eight major land classes were identified (Forest; Scrubland; Grassland; Forage; Vegetable crops; Bare land; Urban area and Water bodies).
The evaluation of unsupervised classification remains a difficult task to undertake. Hence, the method of invariant objects was used to evaluate the classified maps. In this case, the selected invariant objects were forest, water, and bare soil. In addition, the following tasks were carried out: (i) choosing training areas in a GIS (Google Earth); (ii) projecting the digitized training areas on the elaborated land use map, and (iii) visually evaluating the percentage of overlap. A Kappa-based index was then calculated for each yearly map (Table 4).

2.3.4. Methodological Framework

The adopted methodology consisted of two main parts: (i) calibration of the SWAT model parameters, and (ii) simulations using different land use maps to assess their impact on the hydrological processes (Figure 3).

3. Results and Discussion

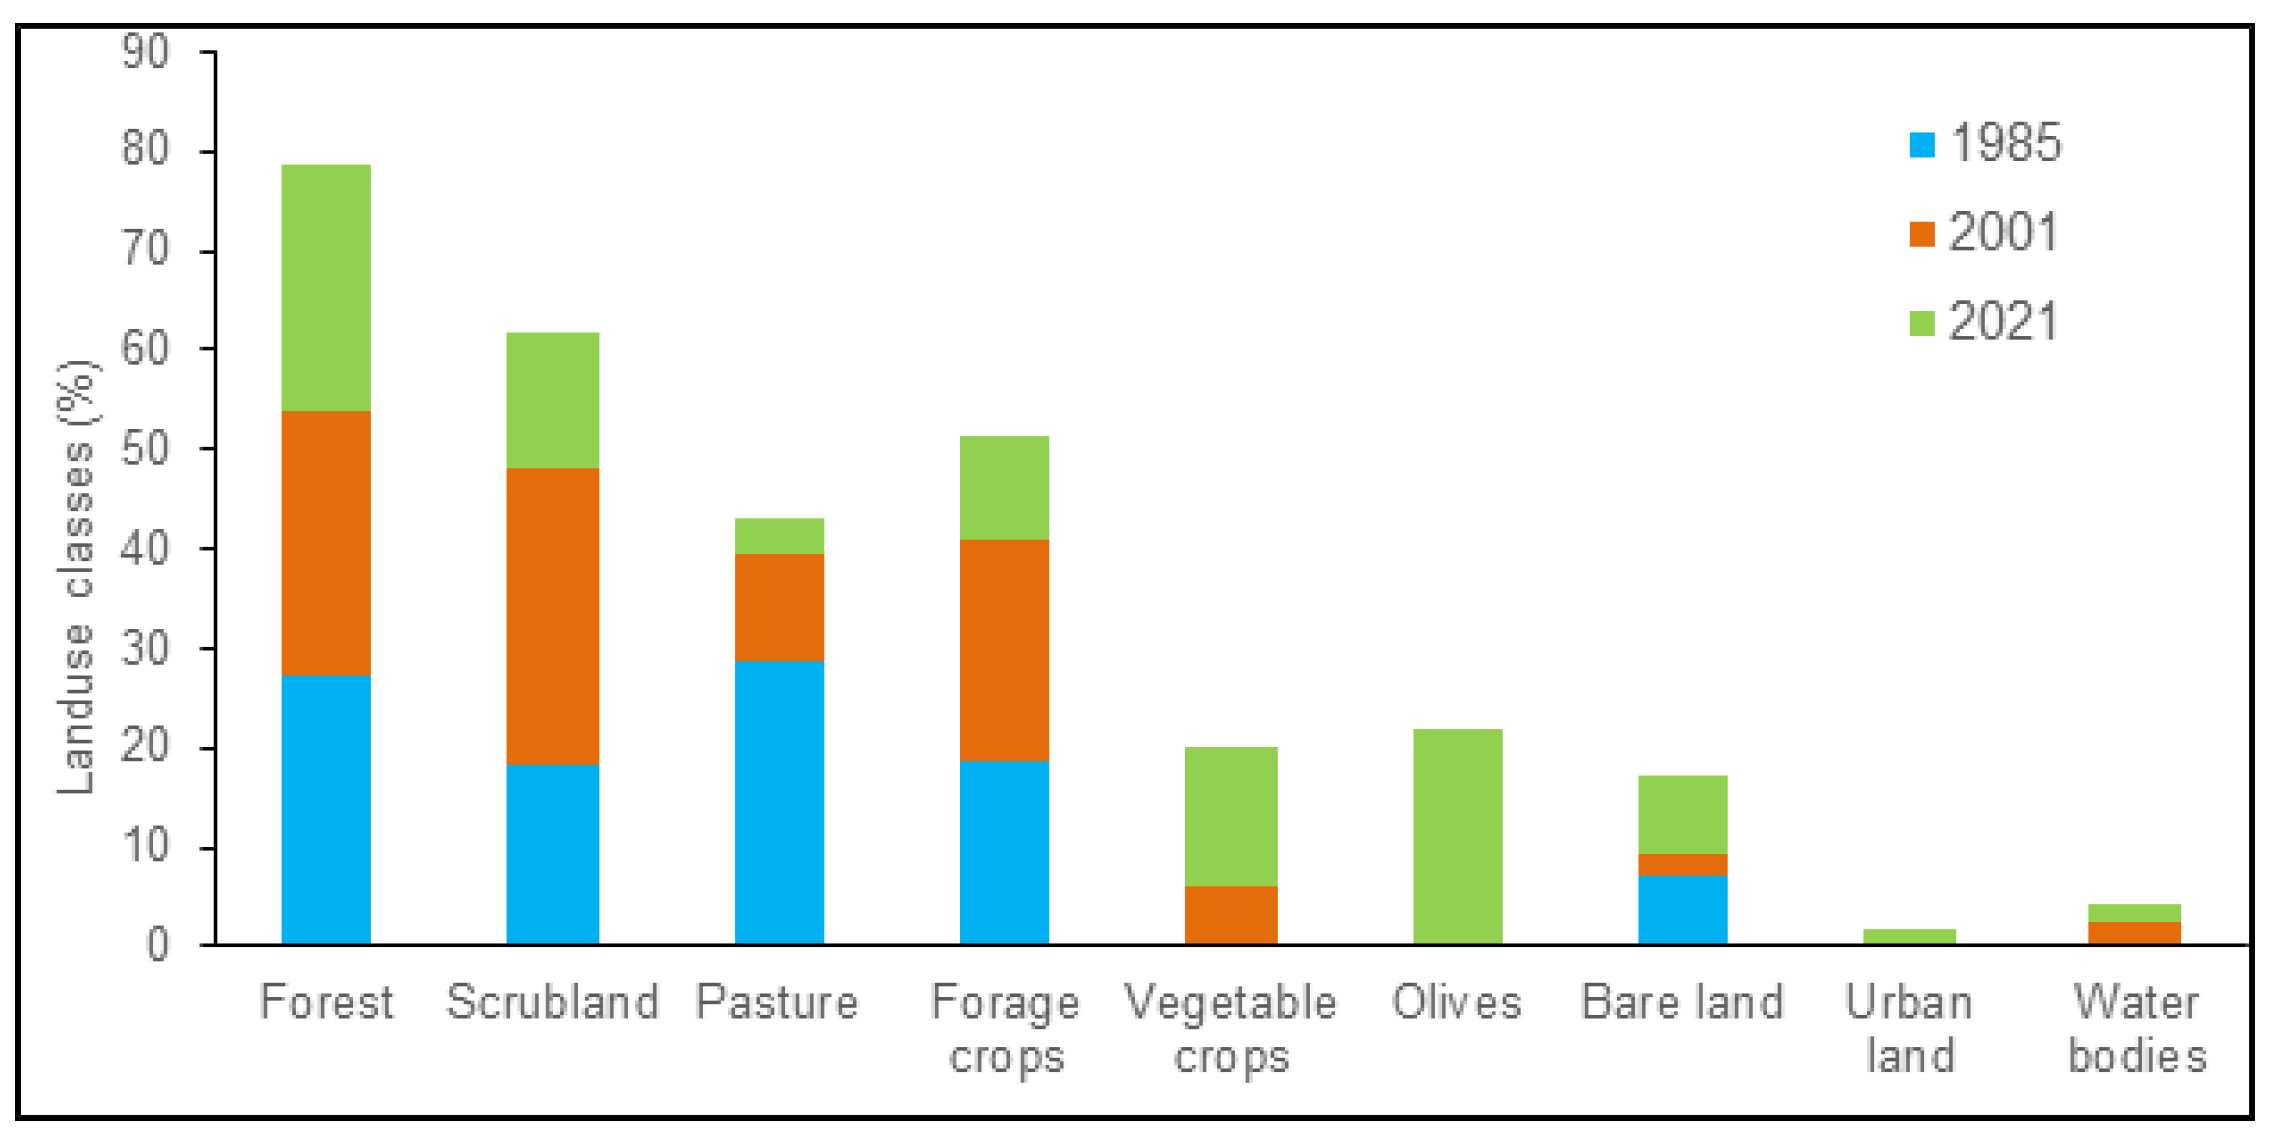
3.1. Land Use Change Detection in the Study Area

Using the approach adopted in the methodology, land cover maps were generated for all three years (1985, 2001 and 2021), and area estimates and change statistics were computed, as shown in Figure 4 and Figure 5. The areas and associated changes for each land use in the Sejnane watershed between 1985 and 2021 are presented in Table 5. The results analysis revealed that the study area has experienced conspicuous changes during the past four decades. In 1985, the major land use classes were grasslands (28.8%), forest (27.2%), forage crops (18.6%) and scrubland (18.2%).
From 1985 to 2001, it can be observed that scrubland (29.8%), was still the dominant land use. Forage crops were increased by only 3.67%. The extension of urban area was slow and estimated at 0.24%, explained by low rural population growth and high internal migration to the large cities on the coast. Water bodies, which were absent in 1985, appeared in 2001 with 2.4%; this was attributed to the construction of the Sejnane dam in 1994. The presence of a water delivery system has encouraged local farmers to install irrigated perimeters and invest in vegetable farming; hence, the vegetable crop class occupied an area of 5.9% of the total basin in 2001. Another identified change was related to the reduction in the pastoral area by −18% that used to be protected by the Bureau of Sylvo-Pastoral Development for the Northwest that is no longer active in this area. In fact, this Bureau was created in 1981 to improve and diversify productive agricultural activities, expand vegetation and forest cover, and develop better natural resource management practices. The uncontrolled use of forest resources has resulted in a decrease in forest cover by 0.48% to the benefit of scrubland.
During the period 2001–2021, olive trees have undergone a notable development; the occupied area reached 22% of the total basin. This expansion has mainly been due to the high economic value of olive oil and the increase in exports, which provides the area with an additional source of income, even though there is no government or local policy encouraging this activity. It is possible that this area could be more suitable for other crops, such as rainfed cereals. Further, the areas occupied by scrubland, forage crops, grasslands and forest decreased by 16.2%, 11.7%, 7.2% and 1.7%, respectively, while urban areas continued their slow expansion by 1.2%.
Comparison between LU_1985 and LU_2021 revealed that the Sejnane river basin has experienced considerable land use changes. A significant expansion of vegetable crops and olives tress was observed (14% and 22%, respectively), in addition to a slight increase in urban land and water bodies (1.4% and 1.8%, respectively). On the other hand, grassland, the most commonly land use type in 1985, decreased by 25.3%, followed by forage crops (8%), scrubland (4.5%) and forest (2.2%).

3.2. Hydrological Modeling

3.2.1. Sensitivity Analysis

A global sensitivity analysis was carried out using the SUFI2 algorithm of SWAT-CUP to identify the most sensitive model parameters. Based on other applications of the SWAT model on Tunisian watersheds [39,40,41,42], eighteen hydrological parameters were considered. The results showed that eight parameters significantly affected the simulated discharge (Table 6). Among these parameters, the SCS runoff curve number (CN2) was found to be the most sensitive, followed by the base flow factor (ALPHA_BF), the channel effective hydraulic conductivity (CH-K2) and parameters related to groundwater (GW_DELAY, SLSUBBSN and RCHRG_DP). Table 6 presents these parameters, their adjusted values and the global sensitivity results.

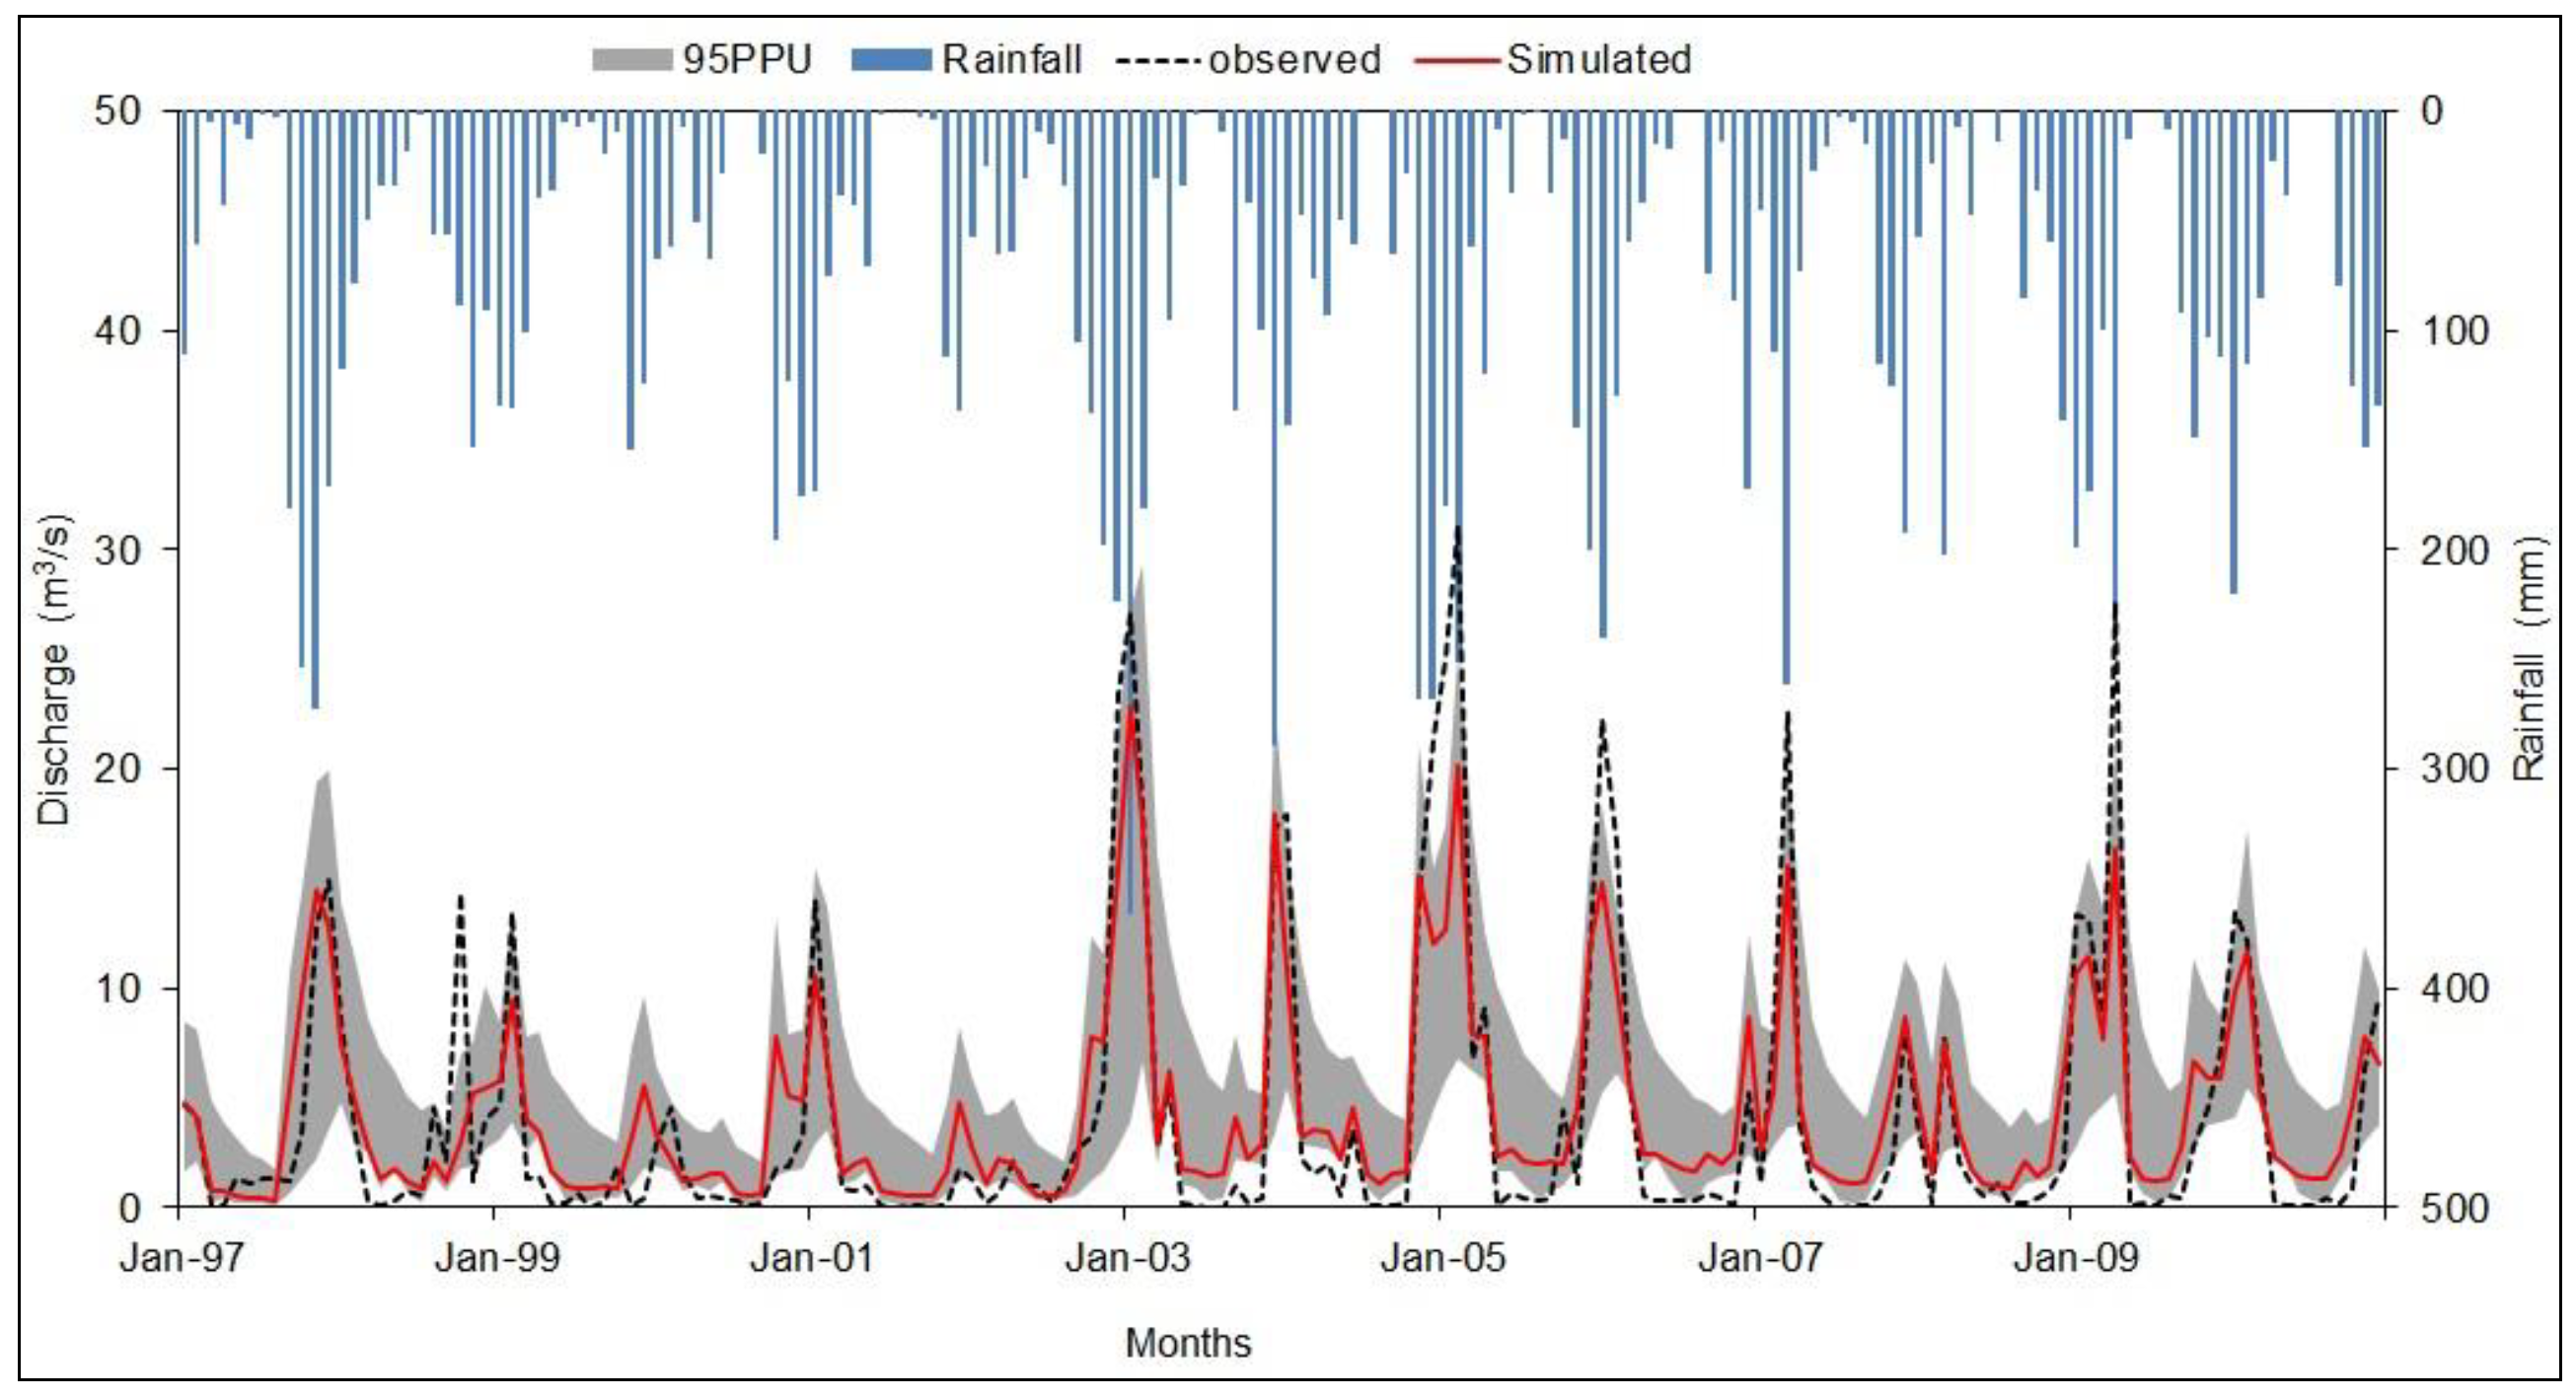
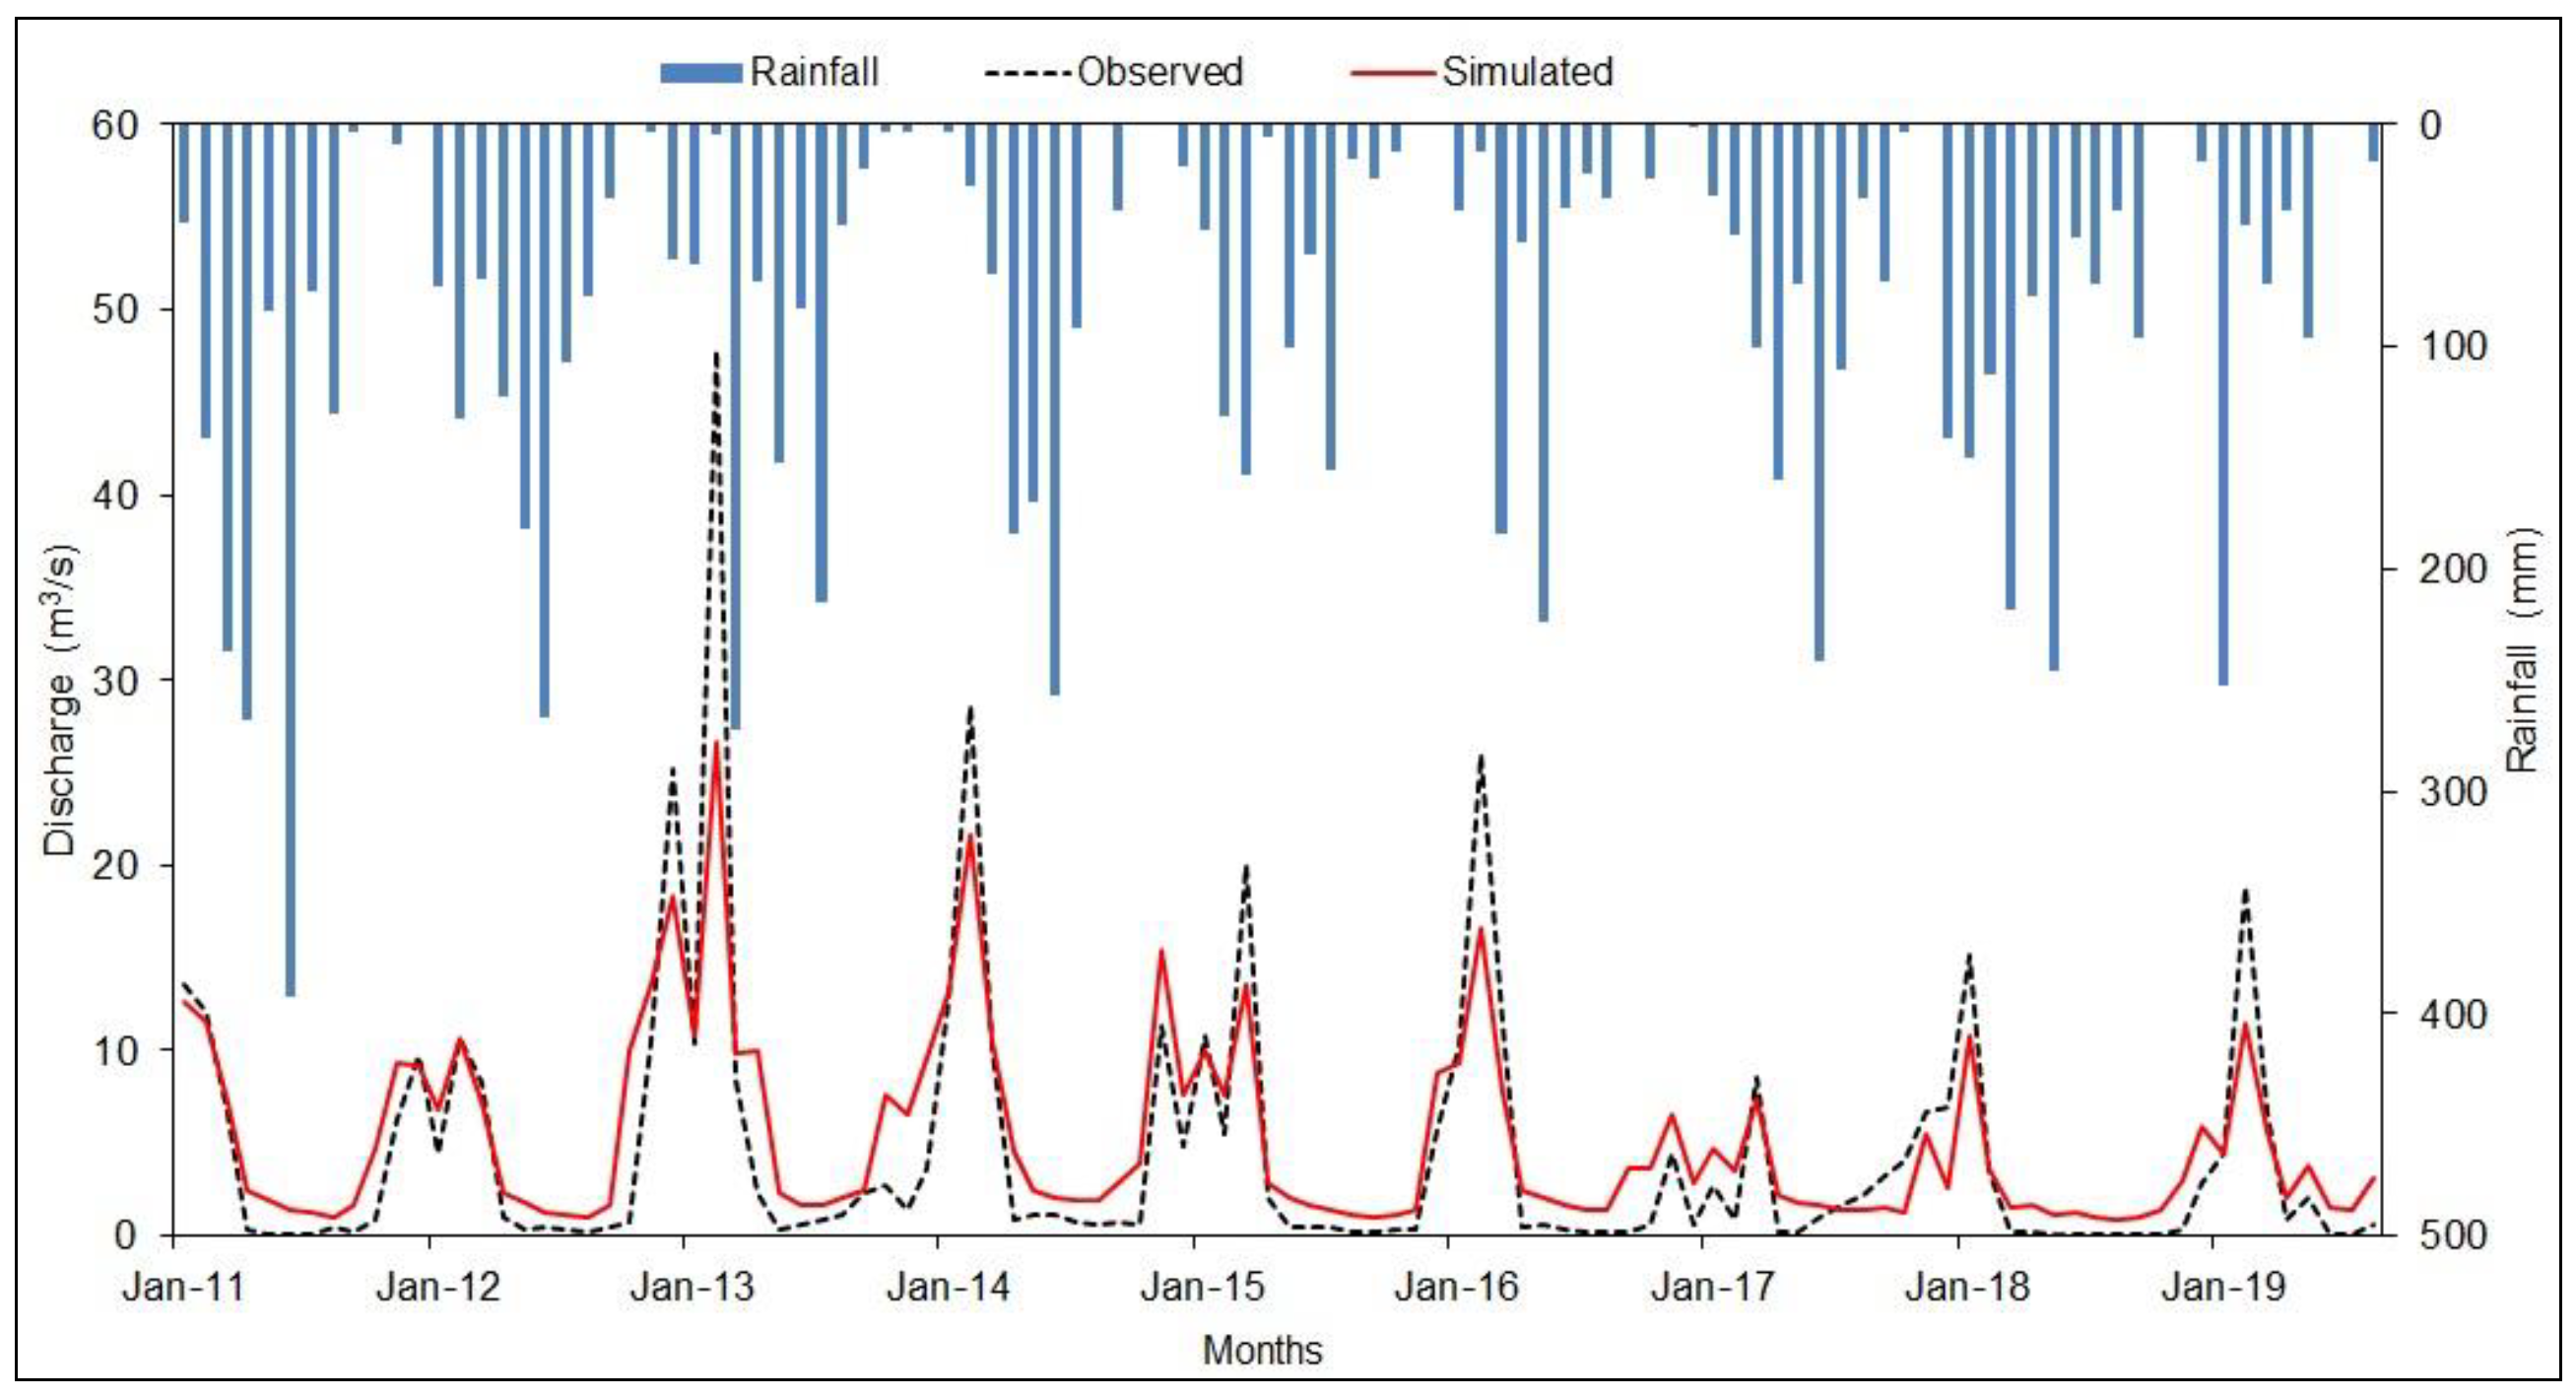
3.2.2. SWAT Model Calibration and Validation

The simulation results for the period (1997–2010), using the land use map of 2001, showed good agreement between observed and estimated monthly discharge of the Sejnane river basin. However, the model overestimated the peak flow, and, with lesser effect on the baseflow, the values of NSE, R2 and PBIAS before calibration were 0.73, 0.79 and −31%, respectively.
The calibration results over the same period demonstrated the ability of the SWAT model to successfully reproduce the streamflow and confirmed its sensitivity to CN2, which influenced peak runoff as well as the groundwater parameters affecting both base flow and soil water storage. The performance statistics for calibration were improved to 0.78, 0.85 and −6.6% for NSE, R2 and PBIAS, respectively. According to Moriasi et al. (2007) [43], the model performance ratings are considered to be very good. The SWAT model was also successful in reproducing streamflow during the validation period (2011–2019), with NSE = 0.70, R2 = 0.81 and PBIAS = −29.2.
The uncertainty analysis of the SWAT model for the calibration period was satisfactory; the P-factor value, which illustrates the percentage of observations bracketed by the 95PPU band, was 0.72. The R-factor, reflecting the average thickness of the 95PPU band divided by the standard deviation of the observed data, was 0.87.
The calibration and validation results proved the performance of the SWAT model in simulating the hydrologic behavior of the Sejnane river basin (Table 7). Hence, the calibrated model was used for assessing the response of hydrologic components to land use change over the period 1985–2021. Graphical presentations of the calibration and validation results are shown in Figure 6 and Figure 7.

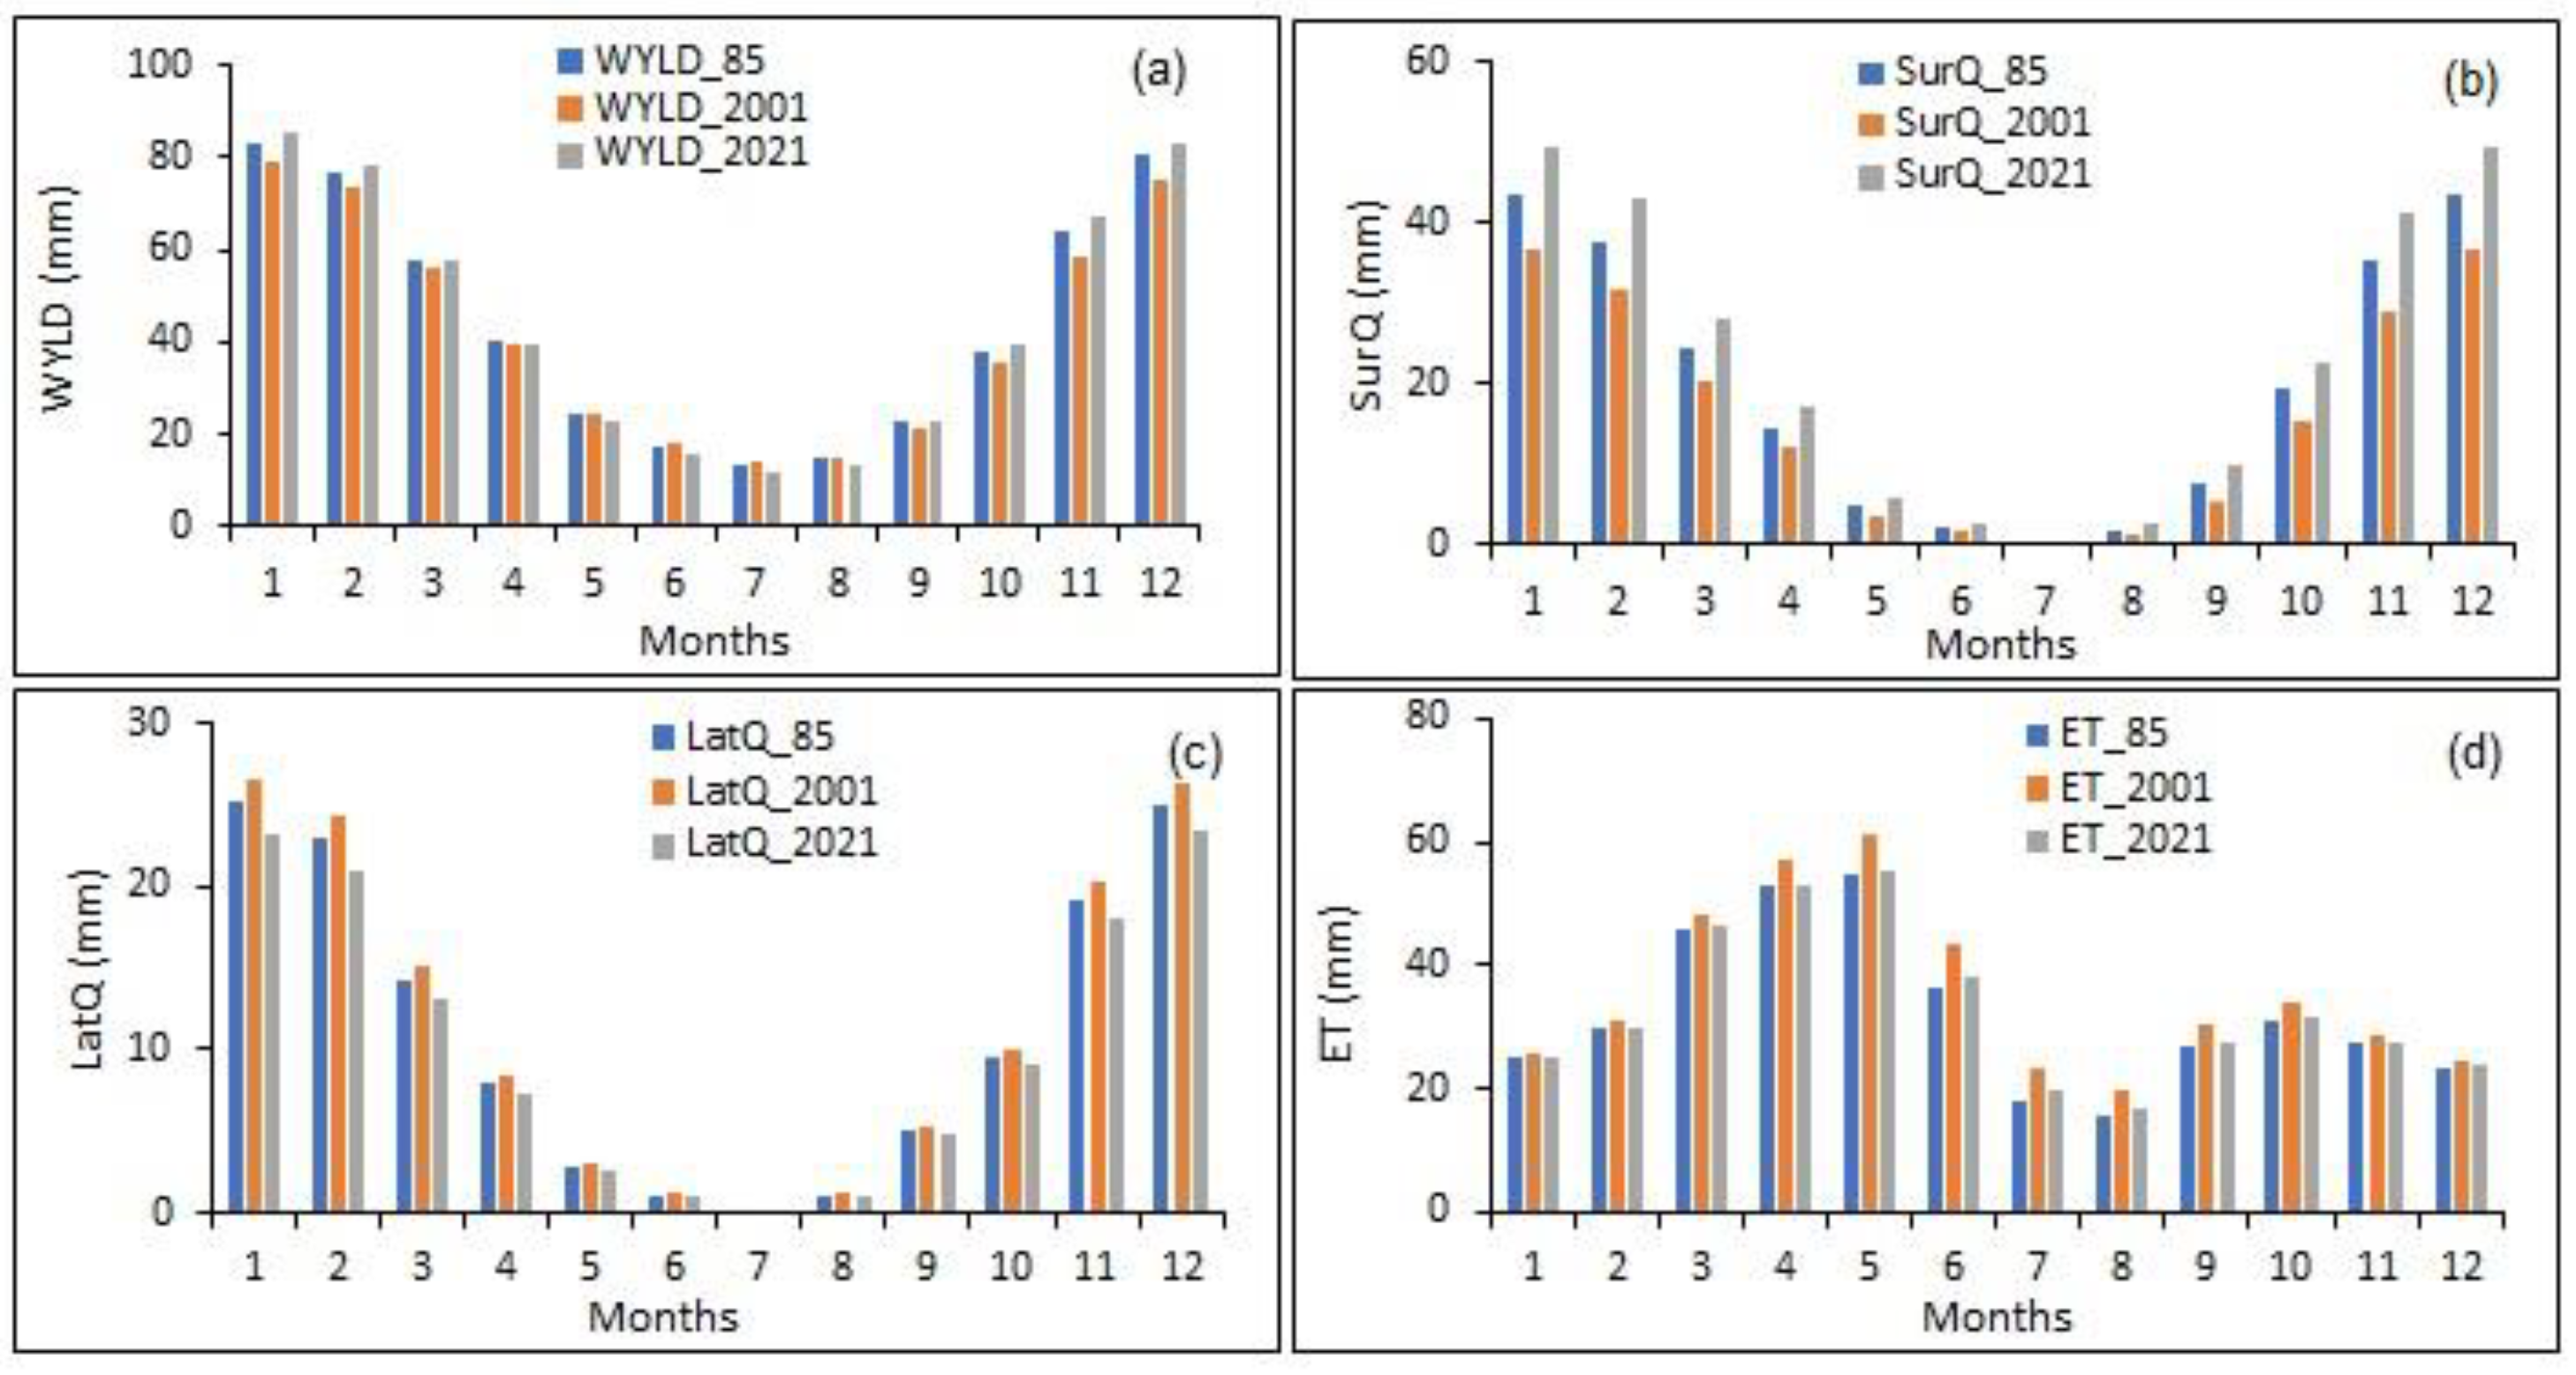
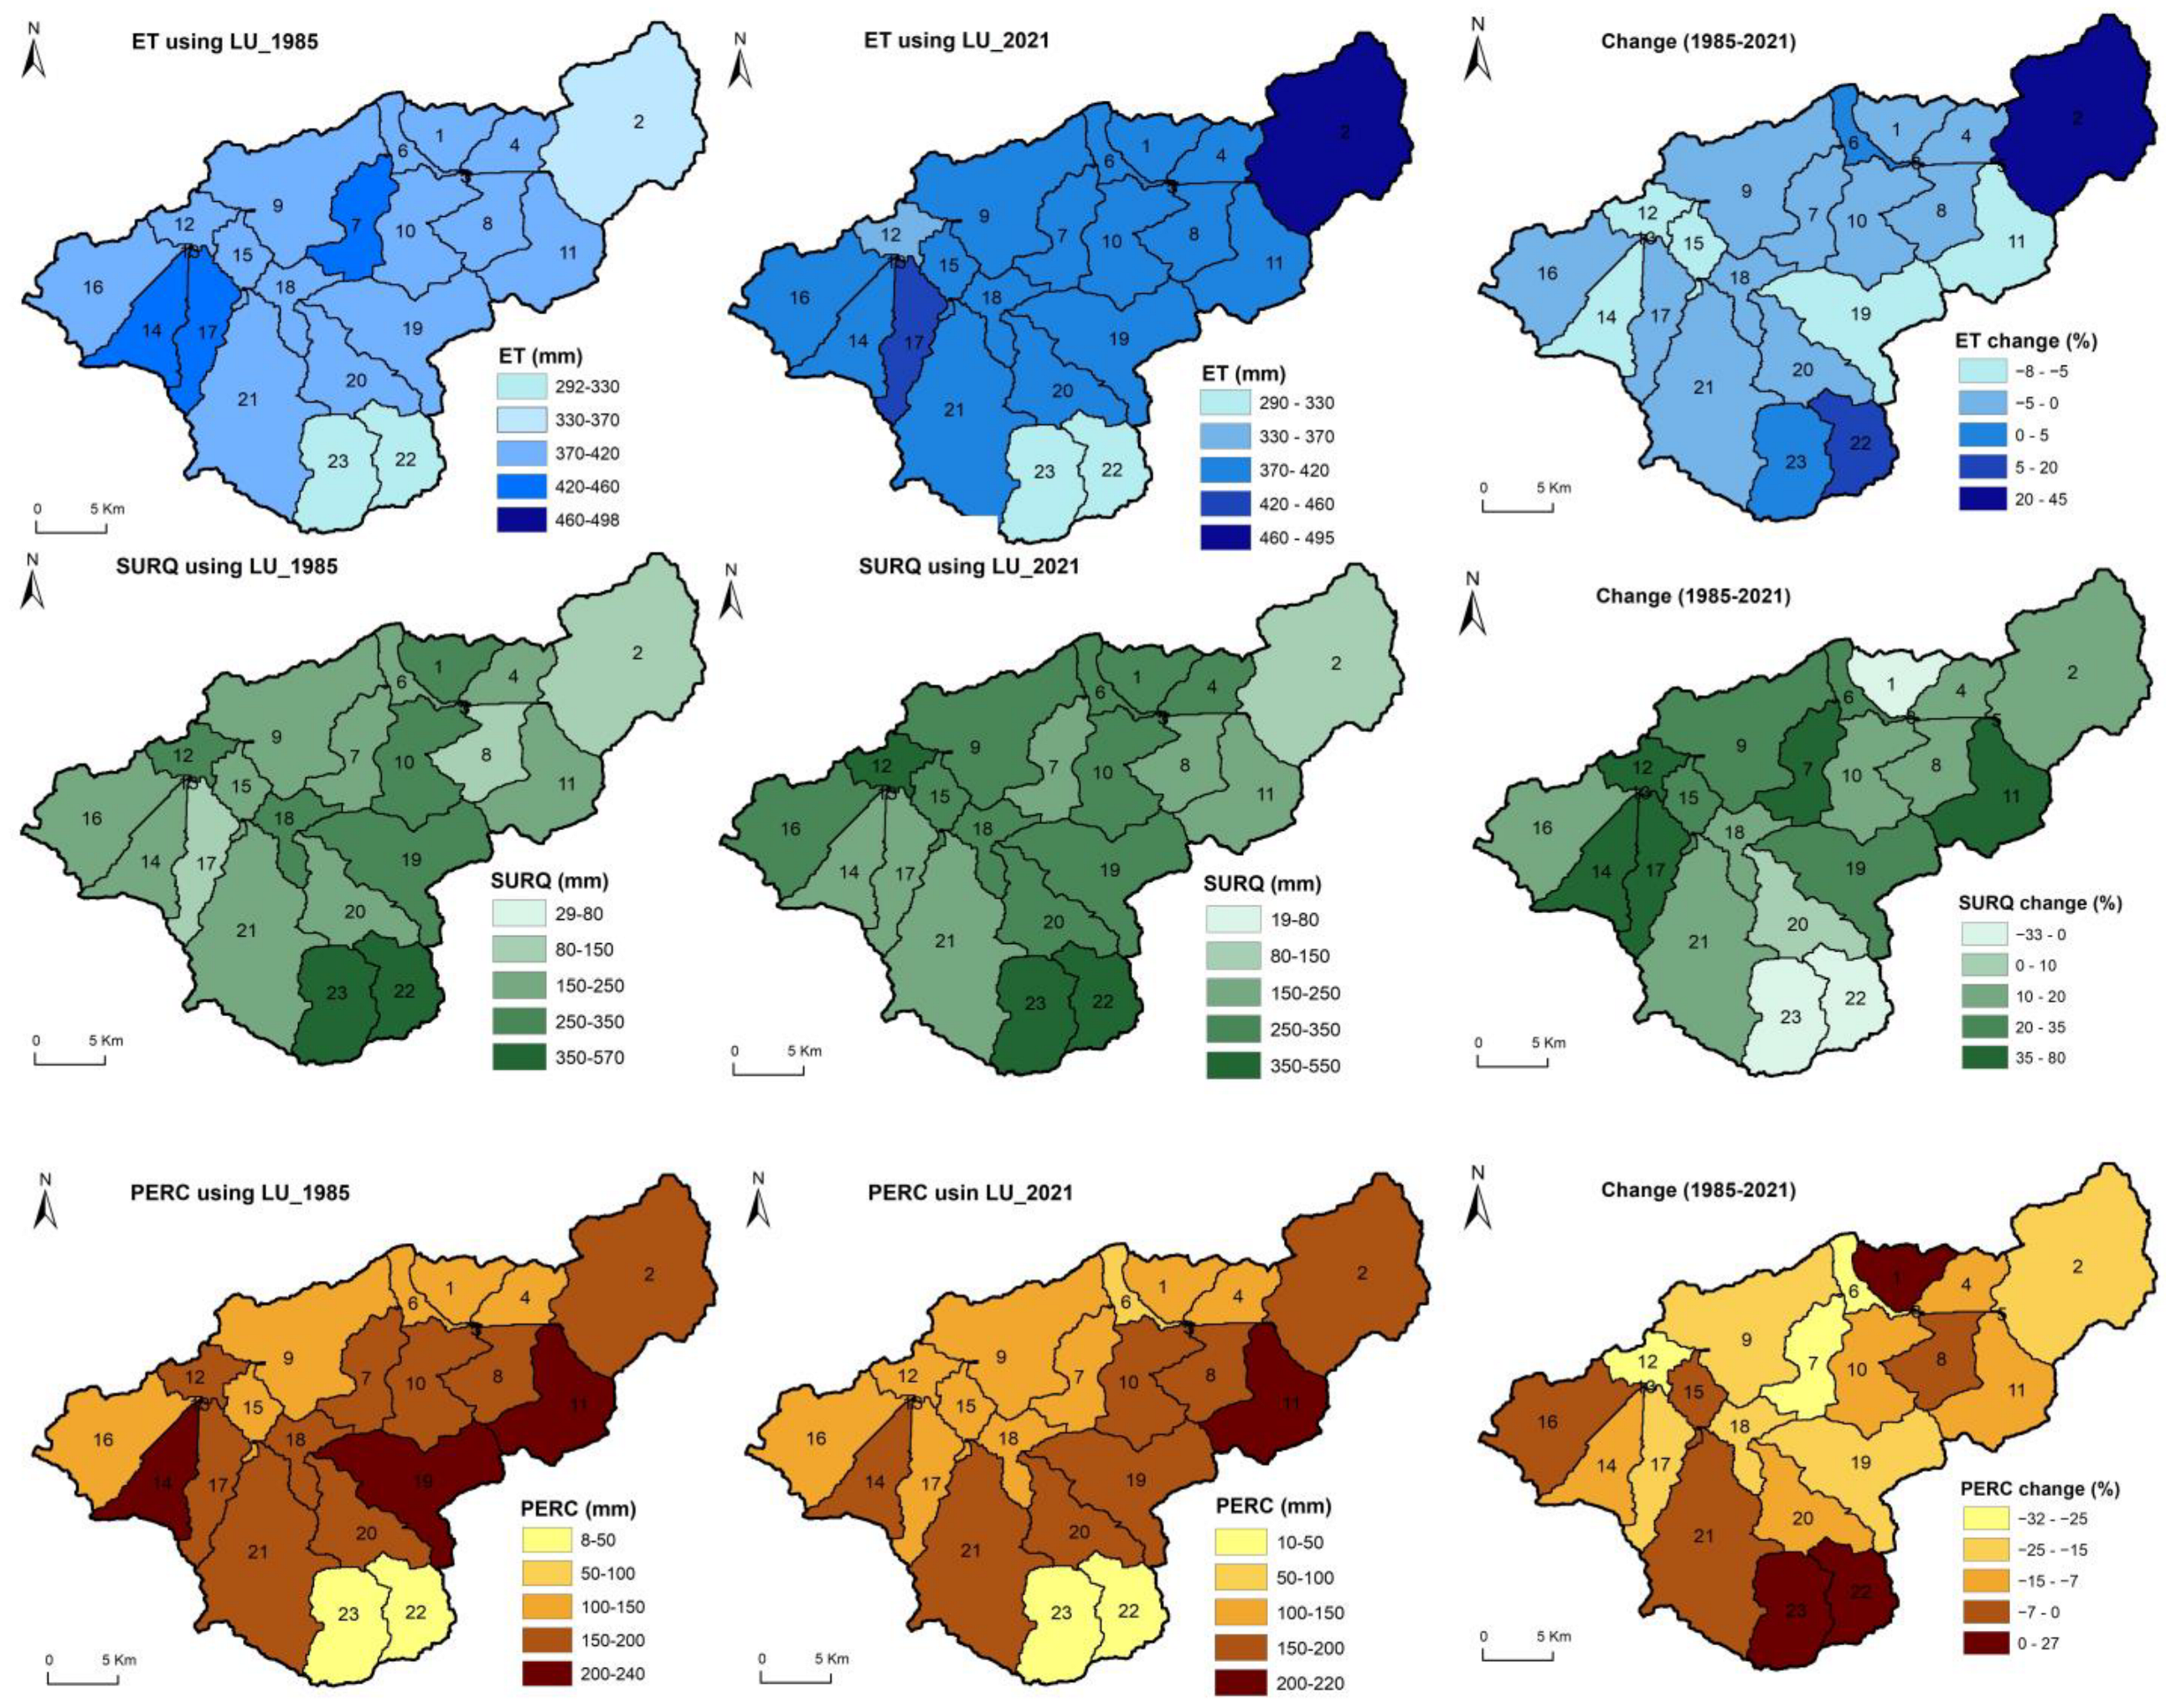
3.2.3. Hydrological Response to Land Use Change

In this study, three multi-temporal land use maps (LU_1985, LU_2001 and LU_2021) were used to assess the influence of land use change on the hydrological response of the Sejnane river basin. Model runs were performed separately using the same climate data and changing the land use input map. From the model runs, mean annual evapotranspiration, water yield, and surface runoff data were extracted. The results showed that different components of the water balance were affected, notably evapotranspiration, showing a significant variation leading to a change in other hydrological processes. The main annual water balance components for 1985, 2001 and 2021, as well as the percent change in the hydrological parameters over the three different periods, are listed in Table 8.
Over the period 1985–2001, the land use changed because of the construction of the dam and the new irrigated areas for vegetable crops that induced an increase in evapotranspiration by about 10.3%, corresponding to 93.3 mm of the average rainfall. This led to a reduction in the amount of water yield and surface runoff, respectively, by 4.5%, 17.7%, and an increase in percolation by 6.2%.
From 2001 to 2021, the extension of olive trees, the reduction in forest and scrubland areas, as well as in forage crops, resulted in the degradation of Garâa Sejnane, a wetland bordering the Sejnane river, inducing a reduction in ET by 7.7%, an increase in surface runoff and a decrease in percolation (40.3% and 18.9%, respectively).
Over the whole study period (1985–2021), changes in land use resulted in a significant increase in surface runoff (15.5%) in the Sejnane watershed, followed by a slight overall increase in water yield (0.9%) and a decrease in percolation by 13.8%. The evapotranspiration was variable and depended on land cover.
The average monthly changes in the water balance components for the three land use conditions are shown in Figure 8. It was found that land change affected evapotranspiration, especially in the dry months from June to August (Figure 8d). Changes in surface runoff, lateral runoff and water yield were most noticeable in the wet months. For instance, SurQ in January showed the highest change and increased from 43.52 mm for LU_1985 to 49.38 for LU_2021, corresponding to an increase of 13% (Figure 8b).
In fact, these changes were due in part to the reduction in scrubland area, a Mediterranean type of vegetation known for its water use efficiency and soil conservation measures, and an increase in olive trees. The model results are in accordance with Cerdà & Doerr (2007) [44] who indicated that runoff coefficients show extremely low average values on scrubland, but high runoff production on olive plots.
WYLD showed a decreasing trend for all dry months, notably in July, where we noticed the maximum reduction (13%), and an increasing trend for wet months from September to February (Figure 8a). LatQ, revealed a slightly decreasing trend with relative variation from 4% in August and 8% in January (Figure 8c). Thus, the actual land use (2021) may have induced a reduction in percolation, while inducing more water storage for the dam.
Consequently, the spatial effect of land use changes from 1985 to 2021 was analyzed to better understand the complex nature of the watershed, as well as the relationship between these changes and the water balance components. The average annual change in water yield, surface runoff, percolation and evapotranspiration in the Sejnane river basin was evaluated at sub-basin level (Figure 9).
A general trend of an increase for surface runoff in all sub-basins was observed, except for sub-basins 1, 22 and 23 (Figure 9b). The higher surface runoff was mainly caused by deforestation of natural cover and the conversion of 46% of forest to vegetable crops following the construction of the dam. It ranged between +9% to +80% depending on the land use changes within the sub-basins (Figure 9b).
The major reduction in mean annual surface runoff clearly observed in the northeast part of the basin can be explained by the rehabilitation of 60% of the bare land to forage crops and olive growing.
At basin level, evapotranspiration, on average, remained not that different between 1985 and 2021 with an increase of 1.8% (Table 8). At sub-basin level, the variation was more pronounced, the values ranging between −8% and +45% (Figure 9a). The reduction in evapotranspiration was mainly due to deforestation, such as in the case of sub-basins 11, 14 and 19. For sub-basin 2, an obvious rise in evapotranspiration was obtained reaching 45% due, in part, to the dam construction with a reservoir covering 790 ha and the extension of irrigated perimeters around the dam.
Percolation varied between −58.2 mm to +11 mm from 1985 to 2021. Some sub-basins were characterized by little change (±5%), such as 8, 16 and 21 (Figure 9c). In 1985, these sub-basins were dominated by forest cover and scrubland (100%, 78% and 44%, respectively), which promoted the percolation. In 2021, natural forests, as well as a large portion of scrubland, were removed in these areas and then converted to olive trees and vegetable crops by smallholder farms to improve their sustainable livelihood opportunities.
The highest increase in percolation was observed in sub-basins 1, 22 and 23 that, in 1985, were dominated by bare lands (35%, 42% and 38%, respectively) and converted to forage and vegetable crops and olive trees.

3.3. Discussion

Climatic extremes, in particular droughts, directly affect land use, impacting on agriculture, livestock and forest, while heavy precipitation and inundation can delay planting, increase soil compaction and cause crop losses. Both these climatic extremes impact on land use. Under water scarcity, farmers try to adapt, seeking plantations that require less water and provide a certain yearly income. In Tunisia, it seems that olive plantations are becoming a way to adapt. Similar conditions were observed on the Siliana catchment located in the northwestern part of Tunisia. The authors of one study reported an increase in olive plantations (+380%), urban area (+200%), and irrigated lands (+309%) from 1990 to 2019 [45]. These changes in LULC induced a decrease in monthly flow and in high flows, but did not impact low flows.
Woldesenbet et al. (2017) [46] reported that the expansion of cultivated land in the Tana and Beles watersheds of the upper Blue Nile basin increased surface runoff and water yield components, while decreasing groundwater components and actual evapotranspiration. The increase in the cultivated and degraded lands in the Geba basin in Ethiopia at the expense of forest, shrubland and grazing lands, resulted in an increase in surface runoff by 72%, and a decrease in the catchment flow by 32%, between 1972 and 2003 [47].
In this study, it has been shown that land-driven changes affect hydrological model predictions. However, LULC and climate interact in many ways and in a complex manner through changes in multiple biophysical conditions and at various spatial and temporal scales. Thus, the effects of land use, such as forestation, deforestation, irrigation, and crop and forest management on climate change and vice versa still need to be explored to provide estimates of their relationships and their effect on each other.

4. Conclusions

The aim of this study was to evaluate the impact of land use change on water resources over the period 1985–2021 in the Sejnane river basin, northern Tunisia, using the hydrologic model SWAT and remote sensing techniques to generate three multi-temporal land use maps (1985, 2001 and 2021). The results showed that SWAT was powerful in reproducing the water balance components at a monthly time scale with good performance with respect to criteria for both calibration and validation.
The assessment of spatial and temporal land use distribution revealed that the Sejnane basin experienced a significant change, notably after the construction of the dam. Between 1985 and 2021, an expansion in vegetable crops and olives and a reduction in grasslands were the major observed changes. However, a reduction in forests and scrublands, as well as change in the area of bare land, was most conspicuous at sub-basin level.
Further, the impact of land use change on hydrological processes, including evapotranspiration (ET), surface runoff (SURQ), percolation (PERC) and water yield (WYLD), were analyzed. The results showed the presence of a close relationship between land use patterns and watershed hydrology. It was found that land use change strongly affected surface runoff that was increased by 36.6 mm. However, percolation declined by 22.6 mm, followed by lateral flow, with a reduction of 9.4 mm. Evapotranspiration was variable and depended on the land cover change.
The land use changes and their effects on hydrological processes were most significant at sub-basin level. Hence, among the 23 sub-basins, the surface runoff showed an increasing trend in 20 sub-basins—the rate of increase reached 85.3 mm in sub-basin 17. This was related to the reduction in forest and scrubland areas, as well as in forage crops, and extension of olive tree production in the watershed due to the paramount importance of their economic value and the increase in Tunisia’s exports over the last few decades.
Evapotranspiration was variable from one sub-basin to another and greatly depended on the land use change—the increase in evapotranspiration reached 145.4 mm in sub-basin 2 due to the dam construction and extension of the irrigated perimeters around the dam.
Through this work, it was possible to evaluate land use changes over 37 years and to simulate their impacts on the hydrologic behavior of the Sejnane basin. The results can be used by policy-makers to implement appropriate strategies for water resources management and to improve sustainable agriculture activities in the area. This work can also be adopted as a basis for further research on the combined effect of future land use and climate change on the hydrology of the basin.

Author Contributions

Conceptualization, S.B. and M.M. (Manel Mosbahi); methodology, M.M. (Manel Mosbahi) and Z.K.; software, M.M. (Manel Mosbahi), Z.K. and R.A.; validation, M.M. (Manel Mosbahi), Z.K. and R.A.; formal analysis, S.B.; investigation, J.A. and M.M. (Manel Mosbahi); writing—original draft preparation, M.M. (Manel Mosbahi); writing—review and editing, S.B.; visualization, M.M. (Mouna Mrad); supervision, B.B., H.N. and R.B.; project administration, B.B.; funding acquisition, B.B and S.B. All authors have read and agreed to the published version of the manuscript.

Funding

This research was funded by the United States Agency for International Development—USAID, USA (AID-OAA-A-11-00012) under the framework for the IMAS-Ichkeul project (Subaward Number: 2000011045) and managed by the National Academies of Sciences, Engineering and Medicine (NASEM).

Data Availability Statement

Data is available upon request from the corresponding author.

Acknowledgments

The authors would like to thank the Directorate of the hydraulic structure and dams for their collaboration. This work is also supported by the City University of New York (CUNY) Remote Sensing Earth System Institute (CUNY-CREST).

Conflicts of Interest

The authors declare no conflict of interest.

References

  1. Wang, Y.-J.; Qin, D.-H. Influence of climate change and human activity on water resources in arid region of Northwest China: An overview. Adv. Clim. Chang. Res. 2017, 8, 268–278. [Google Scholar] [CrossRef]
  2. Zhang, M.; Stodolak, R.; Xia, J. The Impact of the Changes in Climate, Land Use and Direct Human Activity on the Discharge in Qingshui River Basin, China. Water 2021, 13, 3147. [Google Scholar] [CrossRef]
  3. Blöschl, G.; Kiss, A.; Viglione, A.; Barriendos, M.; Böhm, O.; Brázdil, R.; Coeur, D.; Demarée, G.; Llasat, M.C.; Macdonald, N.; et al. Current European flood-rich period exceptional compared with past 500 years. Nature 2020, 583, 560–566. [Google Scholar] [CrossRef] [PubMed]
  4. Büntgen, U.; Urban, O.; Krusic, P.J.; Rybníček, M.; Kolář, T.; Kyncl, T.; Ač, A.; Koňasová, E.; Čáslavský, J.; Esper, J.; et al. Recent European drought extremes beyond Common Era background variability. Nat. Geosci. 2021, 14, 190–196. [Google Scholar] [CrossRef]
  5. Sánchez-García, C.; Francos, M. Human-environmental interaction with extreme hydrological events and climate change scenarios as background. Geogr. Sustain. 2022, 3, 232–236. [Google Scholar] [CrossRef]
  6. Stonestrom, D.A.; Scanlon, B.R.; Zhang, L. Introduction to special section on Impacts of Land Use Change on Water Resources. Water Resour. Res. 2009, 45, W00A00. [Google Scholar] [CrossRef]
  7. Wagner, P.D.; Bhallamudi, S.M.; Narasimhan, B.; Kantakumar, L.N.; Sudheer, K.; Kumar, S.; Schneider, K.; Fiener, P. Dynamic integration of land use changes in a hydrologic assessment of a rapidly developing Indian catchment. Sci. Total Environ. 2016, 539, 153–164. [Google Scholar] [CrossRef]
  8. Woldesenbet, T.A.; Elagib, N.A.; Ribbe, L.; Heinrich, J. Catchment response to climate and land use changes in the Upper Blue Nile sub-basins, Ethiopia. Sci. Total Environ. 2018, 644, 193–206. [Google Scholar] [CrossRef] [PubMed]
  9. Shao, G.; Guan, Y.; Zhang, D.; Yu, B.; Zhu, J. The Impacts of Climate Variability and Land Use Change on Streamflow in the Hailiutu River Basin. Water 2018, 10, 814. [Google Scholar] [CrossRef]
  10. Hachemaoui, A.; Elouissi, A.; Benzater, B.; Fellah, S. Assessment of the hydrological impact of land use/cover changes in a semi-arid basin using the SWAT model (case of the Oued Saïda basin in western Algeria). Model. Earth Syst. Environ. 2022, 8, 5611–5624. [Google Scholar] [CrossRef]
  11. Brown, A.E.; Zhang, L.; McMahon, T.A.; Western, A.W.; Vertessy, R.A. A review of paired catchment studies for determining changes in water yield resulting from alterations in vegetation. J. Hydrol. 2005, 310, 28–61. [Google Scholar] [CrossRef]
  12. Zhang, L.; Nan, Z.; Yu, W.; Ge, Y. Hydrological Responses to Land-Use Change Scenarios under Constant and Changed Climatic Conditions. Environ. Manag. 2016, 57, 412–431. [Google Scholar] [CrossRef] [PubMed]
  13. Gebremicael, T.; Mohamed, Y.; Van der Zaag, P. Attributing the hydrological impact of different land use types and their long-term dynamics through combining parsimonious hydrological modelling, alteration analysis and PLSR analysis. Sci. Total Environ. 2019, 660, 1155–1167. [Google Scholar] [CrossRef]
  14. Torabi Haghighi, A.; Darabi, H.; Shahedi, K.; Solaimani, K.; Kløve, B. A Scenario-Based Approach for Assessing the Hydrological Impacts of Land Use and Climate Change in the Marboreh Watershed, Iran. Environ. Model. Assess. 2020, 25, 41–57. [Google Scholar] [CrossRef]
  15. Mosbahi, M.; Benabdallah, S. Assessment of land management practices on soil erosion using SWAT model in a Tunisian semi-arid catchment. J. Soils Sediments 2020, 20, 1129–1139. [Google Scholar] [CrossRef]
  16. Guzha, A.; Rufino, M.; Okoth, S.; Jacobs, S.; Nóbrega, R. Impacts of land use and land cover change on surface runoff, discharge and low flows: Evidence from East Africa. J. Hydrol. Reg. Stud. 2018, 15, 49–67. [Google Scholar] [CrossRef]
  17. Stednick, J.D. Monitoring the effects of timber harvest on annual water yield. J. Hydrol. 1996, 176, 79–95. [Google Scholar] [CrossRef]
  18. Arnold, J.G.; Srinivasan, R.; Muttiah, R.S.; Williams, J.R. Large area hydrologic modeling and assessment part I: Model development. JAWRA J. Am. Water Resour. Assoc. 1998, 34, 73–89. [Google Scholar] [CrossRef]
  19. Liang, X.; Lettenmaier, D.P.; Wood, E.F.; Burges, S.J. A simple hydrologically based model of land surface water and energy fluxes for general circulation models. J. Geophys. Res. Atmos. 1994, 99, 14415–14428. [Google Scholar] [CrossRef]
  20. Beven, K.J.; Kirkby, M.J. A physically based variable contributing area model of basin hydrology. Hydrol. Sci. Bull. 1979, 24, 43–69. [Google Scholar] [CrossRef]
  21. Refsgaard, J.C.; Storm, B. Computer Models of Watershed Hydrology. Singh, V.P., Ed.; Water Resources Publications: Englewood, NJ, USA, 1995; pp. 809–846. [Google Scholar]
  22. Abbott, M.B.; Bathurst, J.C.; Cunge, J.A.; O’Connell, P.E.; Rasmussen, J. An introduction to the European hydrological system—Système Hydrologique Européen, “SHE”, 1: History and philosophy of a physically based distributed modelling system. J. Hydrol. 1986, 87, 45–59. [Google Scholar] [CrossRef]
  23. Hurkmans, R.T.W.L.; Terink, W.; Uijlenhoet, R.; Moors, E.J.; Troch, P.A.; Verburg, P.H. Effects of land use changes on streamflow generation in the Rhine basin. Water Resour. Res. 2009, 45, W06405. [Google Scholar] [CrossRef]
  24. Wijesekara, G.N.; Farjad, B.; Gupta, A.; Qiao, Y.; Delaney, P.; Marceau, D.J. A Comprehensive Land-Use/Hydrological Modeling System for Scenario Simulations in the Elbow River Watershed, Alberta, Canada. Environ. Manag. 2014, 53, 357–381. [Google Scholar] [CrossRef] [PubMed]
  25. Gao, J.; Holden, J.; Kirkby, M. A distributed TOPMODEL for modelling impacts of land-cover change on river flow in upland peatland catchments. Hydrol. Process. 2015, 29, 2867–2879. [Google Scholar] [CrossRef]
  26. Yin, Z.; Feng, Q.; Yang, L.; Wen, X.; Si, J.; Zou, S. Long Term Quantification of Climate and Land Cover Change Impacts on Streamflow in an Alpine River Catchment, Northwestern China. Sustainability 2017, 9, 1278. [Google Scholar] [CrossRef]
  27. Gashaw, T.; Tulu, T.; Argaw, M.; Worqlul, A.W. Modeling the hydrological impacts of land use/land cover changes in the Andassa watershed, Blue Nile Basin, Ethiopia. Sci. Total Environ. 2018, 619–620, 1394–1408. [Google Scholar] [CrossRef]
  28. Boongaling, C.G.K.; Faustino-Eslava, D.V.; Lansigan, F.P. Modeling land use change impacts on hydrology and the use of landscape metrics as tools for watershed management: The case of an ungauged catchment in the Philippines. Land Use Policy 2018, 72, 116–128. [Google Scholar] [CrossRef]
  29. Sertel, E.; Imamoglu, M.Z.; Cuceloglu, G.; Erturk, A. Impacts of Land Cover/Use Changes on Hydrological Processes in a Rapidly Urbanizing Mid-latitude Water Supply Catchment. Water 2019, 11, 1075. [Google Scholar] [CrossRef]
  30. Zhang, H.; Wang, B.; Liu, D.L.; Zhang, M.; Leslie, L.M.; Yu, Q. Using an improved SWAT model to simulate hydrological responses to land use change: A case study of a catchment in tropical Australia. J. Hydrol. 2020, 585, 124822. [Google Scholar] [CrossRef]
  31. Mangi, H.O.; Onywere, S.M.; Kitur, E.C.; Lalika, M.C.; Chilagane, N.A. Hydrological response to land use and land cover change on the slopes of Kilimanjaro and Meru Mountains. Ecohydrol. Hydrobiol. 2022, 22, 609–626. [Google Scholar] [CrossRef]
  32. United Nations Environment Programme World Conservation Monitoring Centre. Ichkeul National Park, Tunisia. 2008. Available online: http://www.eoearth.org/view/article/153760/ (accessed on 26 June 2013).
  33. Neitsch, S.L.; Arnold, J.G.; Kiniry, J.R.; Williams, J.R. Soil and Water Assessment Tool (SWAT), Theoretical Documentation Version 2009; Texas Water Resources Institute Technical Report; Blackland Research Center, Grassland, Soil and Water Research Laboratory: Temple, TX, USA, 2011; pp. 406–618. [Google Scholar]
  34. Arnold, J.G.; Moriasi, D.N.; Gassman, P.W.; Abbaspour, K.C.; White, M.J.; Srinivasan, R.; Santhi, C.; Harmel, R.D.; van Griensven, A.; Van Liew, M.W.; et al. SWAT: Model Use, Calibration, and Validation. Trans. ASABE 2012, 55, 1491–1508. [Google Scholar] [CrossRef]
  35. Hargreaves, G.H.; Samani, Z.A. Reference Crop Evapotranspiration from Temperature. Appl. Eng. Agric. 1985, 1, 96–99. [Google Scholar] [CrossRef]
  36. Ministry of Agriculture. Cartes agricoles De La Tunisie; Ministry of Agriculture: Tunis, Tunisia, 2002. [Google Scholar]
  37. Abbaspour, K.C.; Rouholahnejad, E.; Vaghefi, S.; Srinivasan, R.; Yang, H.; Kløve, B. A continental-scale hydrology and water quality model for Europe: Calibration and uncertainty of a high-resolution large-scale SWAT model. J. Hydrol. 2015, 524, 733–752. [Google Scholar] [CrossRef]
  38. Gislason, P.O.; Benediktsson, J.A.; Sveinsson, J.R. Random Forests for land cover classification. Pattern Recognit. Lett. 2006, 27, 294–300. [Google Scholar] [CrossRef]
  39. Rodriguez-Galiano, V.F.; Ghimire, B.; Rogan, J.; Chica-Olmo, M.; Rigol-Sanchez, J.P. An assessment of the effectiveness of a random forest classifier for land-cover classification. ISPRS J. Photogramm. Remote Sens. 2012, 67, 93–104. [Google Scholar] [CrossRef]
  40. Aouissi, J.; Benabdallah, S.; Lili Chabaâne, Z.; Cudennec, C. Valuing scarce observation of rainfall variability with flexible semi-distributed hydrological modelling—Mountainous Mediterranean context. Sci. Total Environ. 2018, 643, 346–356. [Google Scholar] [CrossRef] [PubMed]
  41. Mosbahi, M.; Benabdallah, S.; Boussema, M.R. Sensitivity analysis of a GIS-based model: A case study of a large semi-arid catchment. Earth Sci. Inform. 2015, 8, 569–581. [Google Scholar] [CrossRef]
  42. Ben Khelifa, W.; Strohmeier, S.; Benabdallah, S.; Habaieb, H. Evaluation of bench terracing model parameters transferability for runoff and sediment yield on catchment modelling. J. Afr. Earth Sci. 2021, 178, 104177. [Google Scholar] [CrossRef]
  43. Moriasi, D.N.; Arnold, J.G.; van Liew, M.W.; Bingner, R.L.; Harmel, R.D.; Veith, T.L. Model evaluation guidelines for systematic quantification of accuracy in watershed simulations. Trans. ASABE 2007, 50, 885–900. [Google Scholar] [CrossRef]
  44. Cerdà, A.; Doerr, S.H. Soil wettability, runoff and erodibility of major dry-Mediterranean land use types on calcareous soils. Hydrol. Process. 2007, 21, 2325–2336. [Google Scholar] [CrossRef]
  45. El Ghoul, I.; Sellami, H.; Khlifi, S.; Vanclooster, M. Impact of land use land cover changes on flow uncertainty in Siliana watershed of northwestern Tunisia. Catena 2023, 220 Pt B, 106733. [Google Scholar] [CrossRef]
  46. Woldesenbet, T.A.; Elagib, N.A.; Ribbe, L.; Heinrich, J. Hydrological responses to land use/cover changes in the source region of the Upper Blue Nile Basin, Ethiopia. Sci. Total Environ. 2017, 575, 724–741. [Google Scholar] [CrossRef] [PubMed]
  47. Gashaw, T.; Tulu, T.; Argaw, M.; Worqlul, A.W. Evaluation and prediction of land use/land cover changes in the Andassa watershed, Blue Nile Basin, Ethiopia. Environ. Syst. Res. 2017, 6, 17. [Google Scholar] [CrossRef]
Figure 1. Location of the Sejnane river basin.
Water 15 01737 g001
Figure 2. Slope classes (a) and soil map (b) of the Sejnane river basin.
Water 15 01737 g002
Figure 3. The methodological framework for model calibration and land use change assessment.
Water 15 01737 g003
Figure 4. Land use yearly maps of the study area for 1985, 2001 and 2021.
Water 15 01737 g004
Figure 5. Percentage of land use classes for 1985, 2001 and 2021.
Water 15 01737 g005
Figure 6. Measured and simulated monthly streamflow for the calibration period.
Water 15 01737 g006
Figure 7. Measured and simulated monthly streamflow for the validation period.
Water 15 01737 g007
Figure 8. Mean monthly water balance components for different land use conditions. (a) Water yield, (b) surface runoff, (c) Lateral flow and (d) Evapotranspiration.
Water 15 01737 g008
Figure 9. Spatial and temporal change in evapotranspiration (a), surface runoff (b) and percolation (c) in the watershed between 1985 and 2021.
Water 15 01737 g009
Table 1. LULC classes and SWAT code for 2021.
ValueLULC ClassesSWAT CodeArea (%)
1ForestFRSE24.95
2
3
ScrublandGRAR13.67
3
4
GrasslandPAST3.54
4Forage cropHAY10.51
5
6
Vegetable cropsAGRL14.07
6OlivesOLIV22.04
7Bare landBARR7.92
8Urban landURML1.49
9Water bodiesWATR1.8
Table 2. Satellite image acquisition dates.
NoSatelliteAquisition DateUsed BandSpatial Resolution (m)Produced Landuse Map
1LANDSAT54 September 1984Band 1
Band 2
Band 3
Band 4
Band 5
301985
2
3
26 January 198530
3
4
21 July 198530
431 March 198530
5
6
16 September 2000302001
65 December 200030
77 March 200130
815 June 200130
9SENTINEL2A9 November 2020Band 2
Band 3
Band 4
Band 8
102021
10SENTINEL2A12 January 202110
11SENTINEL2A15 March 202110
12SENTINEL2A31 August 202110
Table 3. Field observation data and validation for 2021.
ValueLULC ClassesField Used Observation Data for ClassificationField Used Observation Data for ValidationPrecision (%)
1Forest353070
2
3
Scrubland241729.4
3
4
Grassland201050
4Forage crop209100
5
6
Vegetable crops362255
6Olive trees453548.5
7Bare land208100
8Urban land464288.1
9Water bodies2518100
KAPPA index0.82
Table 4. Validation of 1985 and 2001 maps using the invariant method.
ValueLULC ClassesField Used Observation Data for Classification% Identification for 1985 Image% of Identification for 2001 Image
1Forest9510087
2Scrubland708079.1
3
3Grassland757585
4
4Forage crop708370
5Vegetable crops-70-
6
6Olive trees---
7Bare land808290
8Urban land100100100
9Water bodies-10020
Kappa index81.686.25
Table 5. Land use areas and percentage changes between 1985–2021 period in the Sejnane river basin.
Land Use Yearly Map 198520012021Change 1985–2001Change 2001–2021Change 1985–2021
Area (km2)Area (%)Area (km2)Area (%)Area (km2)Area (%)Area (%)Area (%)Area (%)
Forest99.3327.1697.4726.6891.1924.95−0.48−1.73−2.21
Scrubland66.3918.15109.0029.8549.9813.6711.7−16.18−4.48
Grassland105.3728.8139.1410.7212.953.54−18.09−7.18−25.27
Forage 67.8518.5581.1522.2238.4110.513.67−11.71−8.04
Vegetable crops--21.685.9451.4414.075.948.1314.07
Olives----80.5822.04-22.0422.04
Bare land26.627.286.791.8628.967.92−5.426.060.64
Urban area0.180.051.070.296.511.490.241.21.44
Water bodies--8.92.45.51.82.4−0.61.8
Table 6. Sensitive parameters for monthly flow and global sensitivity results.
ParametersParameters DescriptionParameters RangeFitted Valuep-Valuet-Stat
R_CN2SCS runoff curve number for moisture condition−0.3–0.30.110.0015.36
V_ALPHA- BFBase flow alpha factor (days)0–10.450.0012.25
V_CH-K2Channel effective hydraulic conductivity−0.1–550.12.960.00−5.67
V-GW_DELAYGroundwater delay (days)200–500310.60.012.55
V_SLSUBBSNAverage length of the slope (m)30–11131.310.02−2.17
V_RCHRG_DPDeep aquifer percolation0–10.640.19−1.13
V_SURLAGSurface runoff lag time (mm)0.05–152.980.22−1.03
V_ESCOSoil evaporation compensation factor0–10.900.27−1.00
Notes: “R_” and “V_” means a relative change and a replacement based on the initial parameter values, respectively.
Table 7. Performance evaluation of SWAT model.
PeriodNSER2PBIAS (%)
Calibration period (1997−2010)
3
0.780.85−6.6
Validation period (2011−2019)
4
0.700.81−29.2
Table 8. Average annual water balance components using the different land use maps (1985 to 2021).
Hydrological Parameters
(mm)
Land Use Detection of Change (%)
Lu_1985Lu_2001LU_2021Change 1985–2001Change 2001–2021Change 1985–2021
Surface runoff (SurQ) (SUR_Q)236.6194.7273.2−17.740.315.5
Water yield (WYLD)534.3510.3538.9−4.55.60.9
Evapotranspiration (ET)387.6427.7394.710.3−7.71.8
Percolation (PERC)163.7173.9141.16.2−18.9−13.8
Disclaimer/Publisher’s Note: The statements, opinions and data contained in all publications are solely those of the individual author(s) and contributor(s) and not of MDPI and/or the editor(s). MDPI and/or the editor(s) disclaim responsibility for any injury to people or property resulting from any ideas, methods, instructions or products referred to in the content.

