Article

Utilizing Electricity-Producing Bacteria Flora to Mitigate Hydrogen Sulfide Generation in Sewers through an Electron-Pathway Enabled Conductive Concrete

1
Faculty of Urban Engineering, Mientrung University of Civil Engineering, Tuy Hoa 620000, Vietnam
2
Graduate School of Sciences and Technology for Innovation, Yamaguchi University, Yamaguchi 755-8611, Japan
3
Fuso Cooperation, Takamatsu 761-8551, Japan
4
Kajima Technical Research Institute, Kajima Cooperation, Tokyo 182-0036, Japan
5
Nakagawa Humepipe Industry Co., Ltd., Ibaraki 300-0051, Japan
6
Department of Civil and Environmental Engineering, Cleveland State University, Cleveland, OH 44115, USA
*
Author to whom correspondence should be addressed.
Water 2023, 15(9), 1749; https://doi.org/10.3390/w15091749
Submission received: 20 March 2023 / Revised: 20 April 2023 / Accepted: 27 April 2023 / Published: 1 May 2023
(This article belongs to the Special Issue Water Quality Engineering and Wastewater Treatment III)

Abstract

:
This study aims to demonstrate the effectiveness of using biological oxidation for hydrogen sulfide (H2S) control. A long-term experiment was conducted using a rod-shaped electrode made of highly conductive concrete, which provided an electron pathway for H2S mitigation. Bacterial flora analysis was conducted using PCR-DGGE and metagenomic analysis by next-generation sequencing to identify electricity-producing bacteria. Results showed that H2S was effectively mitigated, and electricity-producing bacteria, including Geobacter sp. and Pelobacter sp., were found around the inner surface of the anode. The study found that highly conductive concrete can create an electron pathway for biological oxidation of H2S. Oxygen from the air layer near the surface of the water can act as an electron acceptor, even under anaerobic conditions, enabling effective H2S control in sewer systems.

1. Introduction

Microbiologically influenced corrosion (MIC) has emerged as a significant concern for civil engineers to protect construction materials, such as pipeline systems, sewers, and underground water systems. Corrosion by hydrogen sulfide can occur in wastewater treatment systems where anaerobic microorganism convert sulfates in the wastewater to aqueous H2S. Sulfate-reducing bacteria (SRB) are known to generate a variety of destructive substances as organic acids, hydrogen sulfide, and other sulfur-containing compounds that can initiate degradation of material surfaces. Sewage pipeline corrosion caused by hydrogen sulfide is a common problem that can lead to the deterioration of sewer infrastructure, causing high maintenance costs and potential structure failures [1,2]. In anaerobic conditions and moisture, hydrogen sulfide formed by SRB communities of wastewater can react with sulfur oxidizing bacteria (SOB) to form sulfuric acid. This biogenic acid can then dissolute with calcium-silicate-hydrate as hydrate products in the concrete, developing calcium sulfate and water [3,4,5]. This degradation process can be accelerated by time to lead to structural failures and collapsing concrete and posing a risk to safety.
Most sewer systems are located underground and directly exposed to wastewater, making them highly susceptible and prone to microbiologically induced corrosion. Consequently, significant financial resources are often required to repair and maintain these systems. Governments worldwide are increasingly being compelled to seek solutions to address this ongoing challenge, which may involve implementing preventive measures or replacing aging infrastructure [6]. The costs associated with corrosion prevention methods can vary significantly depending on the size and complexity of the sewer system.
To prevent corrosion by H2S, using oxidant chemicals can be used to minimize the amount of sulfate in the wastewater and to maintain adequate levels of dissolved oxygen to prevent the growth of anaerobic bacteria. Protective coatings and liners can also be consumed to reduce the exposure of concrete surfaces to biogenic acid and corrosive compounds. The use of oxidant as an electron acceptor to oxidize sulfide through biological means has been investigated in sewer systems. Sewer aeration or bio-oxidation has been identified as an effective measure for mitigating sulfide generation and corrosion in sewer systems [7,8]. Adjoining nitrate/nitrite into sewers can be an effective solution for preventing the occurrence of sulfide. This is because SRBs, which typically produce sulfide as a byproduct of their metabolism, can use nitrate as an alternative electron acceptor [9]. In addition to reducing sulfide production, nitrate injection can also benefit sewer infrastructure by preventing the formation of sulfuric acid. Sulfuric acid can corrode concrete and metal pipes, so by reducing its formation, nitrate injection can help to extend the lifespan of sewer infrastructure. Microbial fuel cells (MFCs) have been investigated as a green potential approach to mitigate hydrogen sulfide emissions in sewer systems by utilizing the microorganisms in the MFCs to degrade organic matter in wastewater and produce electrons, which can be harnessed by an electrode to generate electricity [10,11]. By contrast, to protect sewer concrete materials, several recent studies have explored the use of protective coatings and liners, such as polysiloxane, epoxy coatings, or polyurea inners to prevent exposure of biogenic acid and H2S [12,13]. Recent studies have emphasized the importance of microorganisms surrounding the electrodes of MFCs in the removal of hydrogen sulfide by utilizing it as a substrate for biological oxidation. MFCs utilize microorganisms to generate electrical energy while simultaneously removing organic matter from wastewater.
Research into MFCs for biocorrosion mitigation is ongoing, with promising results thus far. Researchers are working toward developing practical and effective and sustainable solutions for the long-term protection of biocorrosion of concrete structures. In previous studies, the authors applied the principle of microbial fuel cells and conducted experiments on suppressing hydrogen sulfide generation using conductive concrete [14]. Based on their demonstration, it has been shown that the conductive substance within the concrete is capable of absorbing hydrogen sulfide. Furthermore, that study also confirmed that hydrogen sulfide can be biologically oxidized through the inoculation of electricity-producing bacteria (EPB). While conductive concrete has been recognized as a useful technology for deicing snow and heated pavements [15], its potential as a MFC in sewer systems for treating wastewater has been largely unexplored. Further research is needed to investigate this application and its implications for sustainable infrastructure. Figure 1 illustrates the proposed mechanism of this biological oxidation process as previously researched. However, despite this, there is currently no molecular biological evidence supporting the claim that EPB present in sewage sludge can biologically oxidize hydrogen sulfide even when the inoculation of EPB is not performed.
The present study aims to demonstrate the mechanisms behind biocorrosion by identifying the microbial communities responsible for the process. In addition, we will explore the efficacy of using conductive concrete as a microbial fuel cell system to target these organisms. Specifically, we will test the ability of electrically conductive concrete to suppress the generation of hydrogen sulfide, a key contributor to biocorrosion, through experimental trials. Furthermore, we will use molecular biological methods to analyze the microbial community in the sludge and determine the changes resulting from the use of conductive concrete.

2. Materials and Methods

The experiment was conducted under controlled laboratory conditions with a temperature of 25 ± 1 °C. The aqueous solution was prepared using distilled water (SA-2100A·A type, Tokyo Rikakikai Co., Ltd., Tokyo, Japan), which was of high purity and ensured that the solution was free from any impurities. Additionally, reagents of high grade were used in the experiment from reliable suppliers such as Fujifilm Wako Pure Chemical Co., Ltd. (Osaka, Japan), Kishida Chemical Co., Ltd. (Osaka, Japan), and Nakarai Tesc Co., Ltd. (Kyoto, Japan). The selection of high-grade reagents ensured the accuracy and reliability of the experiment results.

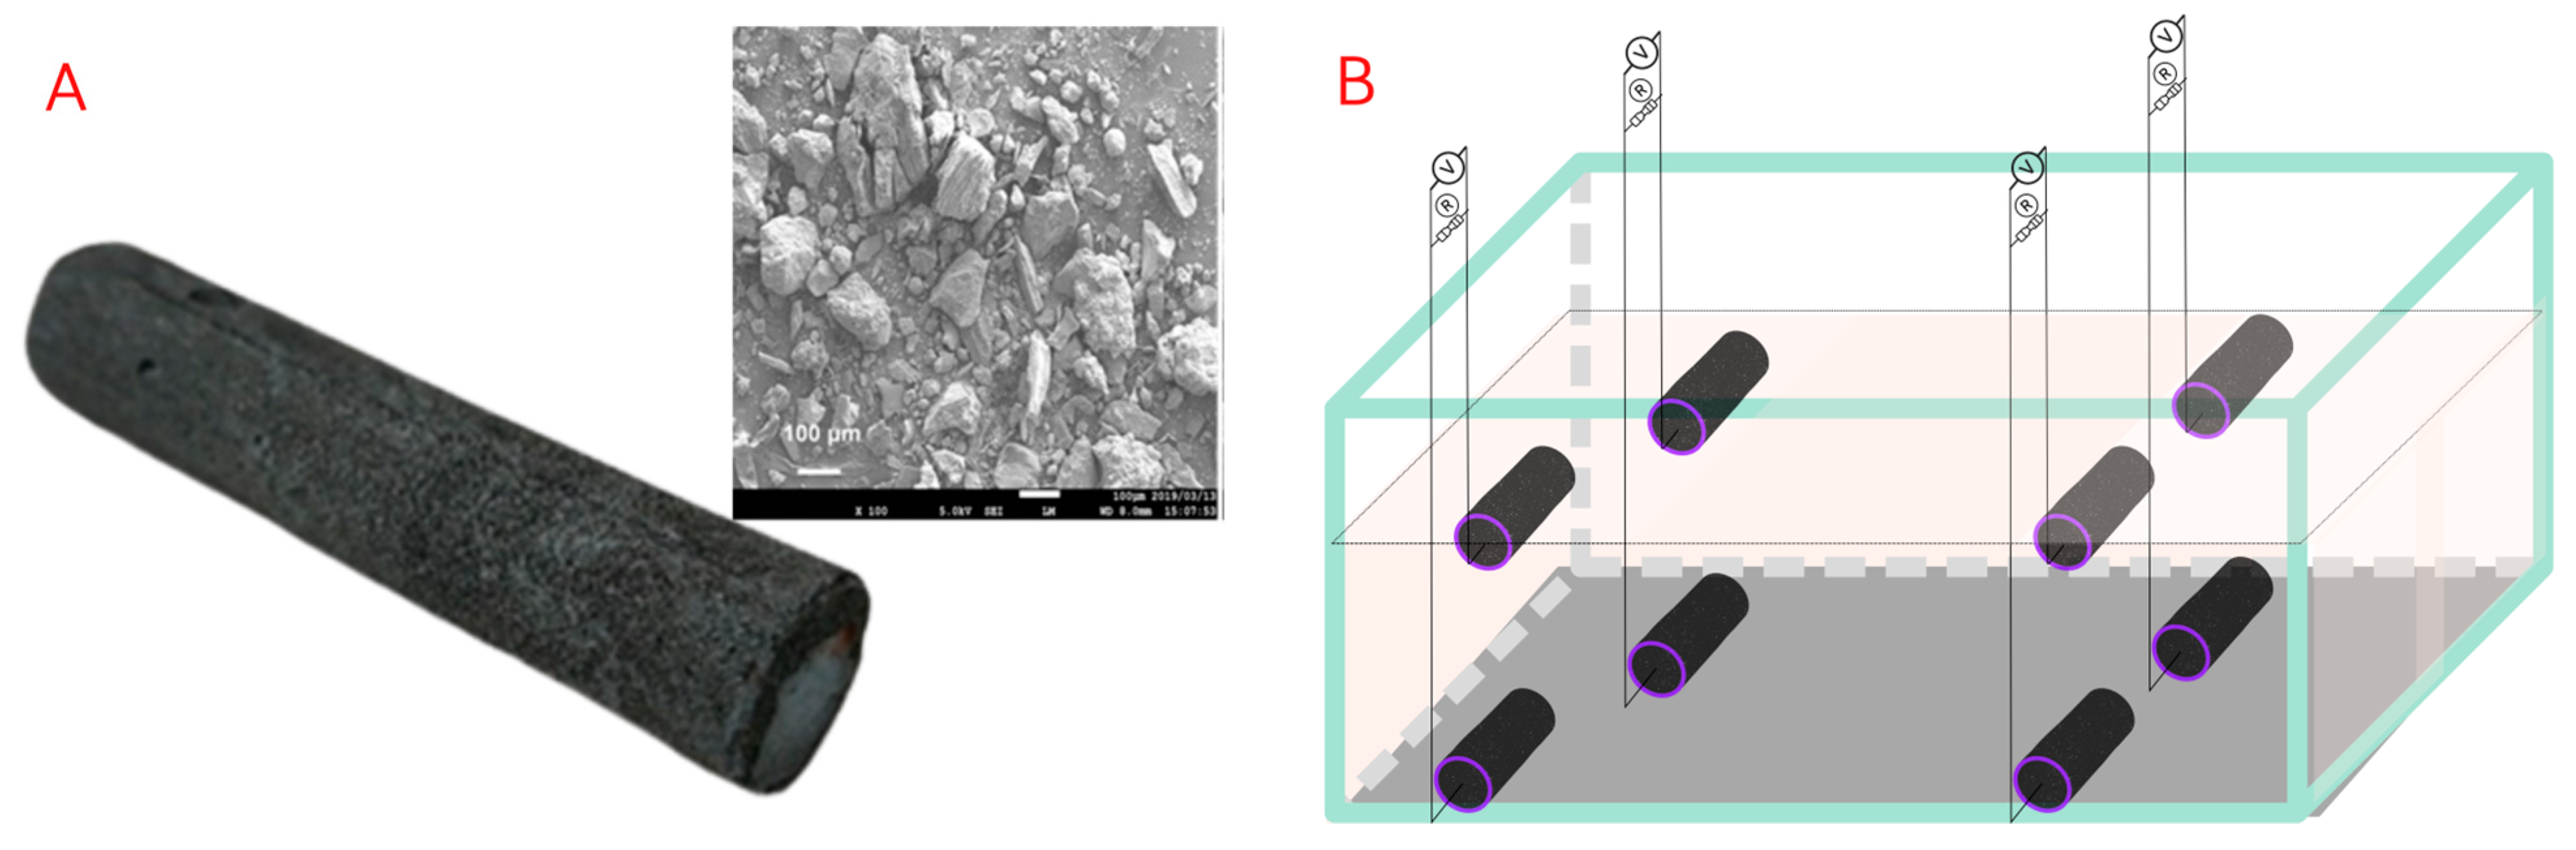
2.1. Preparation of Conductive Material and Electrodes

In this study, San-Earth M5C (referred to as San-Earth) was used as a type of conductive substance that has been shown in previous study to inhibit the generation of sulfides (including sulfide ion S2−, hydrogen sulfide ion HS, and hydrogen sulfide H2S) in water [14]. San-Earth contains amorphous carbon, a byproduct of oil refining processes, with a maximum particle size of 0.3 mm and a specific surface area of 1.9 m2/g (as shown in Figure 2A). The electrodes were made in a cylindrical shape, with a diameter of 16 mm and a length of 75 mm, and the water-to-powder ratio was set at 42% in accordance with a previous study [14]. After undergoing treatment with an alum-based scour remover, the electrodes retained their specific characteristics of not expanding, shrinking, or cracking during curing [14]. The electrode shown in Figure 2B is positioned within a simulated sewer pipe as Figure 1, allowing for electrochemical reaction simulation-like real field conditions (described in Section 2.2).

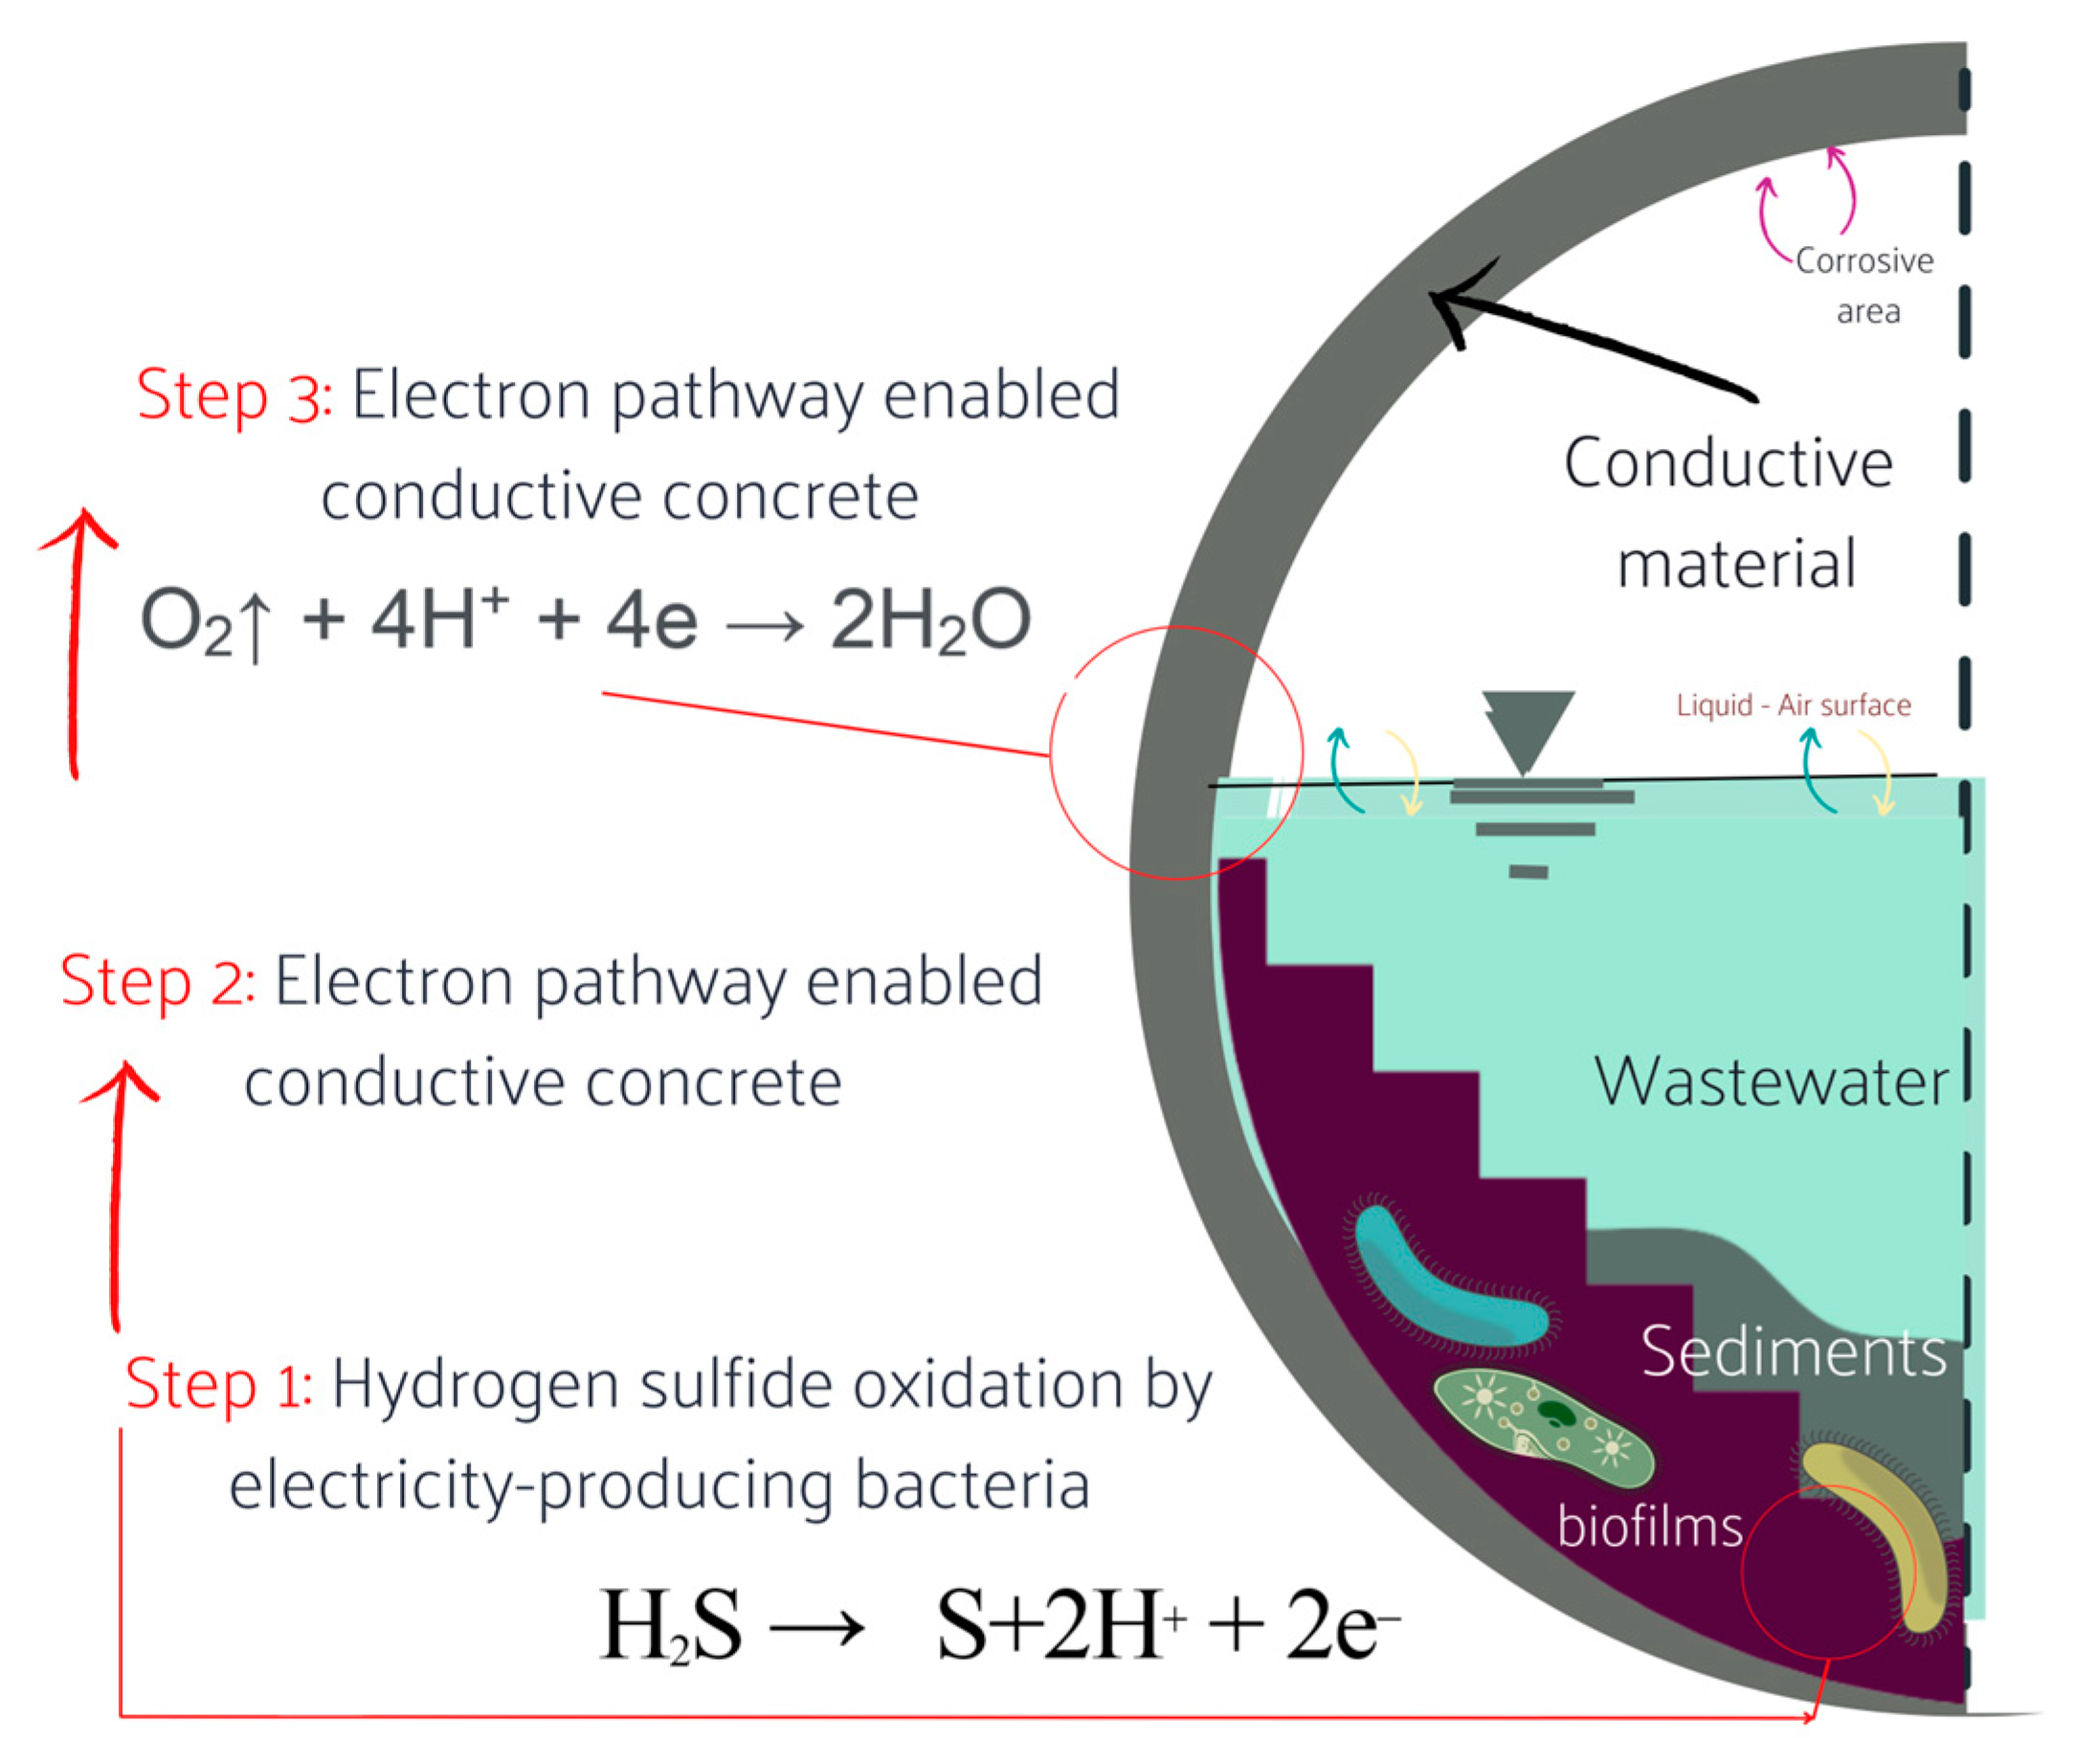
2.2. Hydrogen Sulfide Suppression Experiment with Conductive Concrete

The objective of this experiment was to gather molecular biological data that would serve as the basis for the biological oxidation of sulfide by providing electron transfer pathways. To accomplish this goal, two sets of systems were prepared (referred to Figure 2B). The first set included an anode electrode (a bar-shaped concrete electrode manufactured by San Earth) positioned 8.5 cm deep at the bottom of an aquarium (18.5 cm tall × 29.0 cm wide × 13.0 cm high, with a total volume of 6.98 L) and a cathode electrode (a bar-shaped concrete electrode, identical to the anode electrode) that was partially submerged in water with a 100 Ω external resistor. The connection between the two electrodes created electron transfer pathways. The second set of systems did not include this connection.
The copper wire was used to connect the bar-shaped concrete electrodes, with the connection embedded in concrete and equipped with anticorrosion measures. The system had an internal resistance of 680 Ω. To evaluate the targeted effect of biological oxidation and prevent the prolonged suppression of hydrogen sulfide adsorption, the surface area of the anode electrode was significantly reduced to less than one-tenth of the previous study [14]. This modification allowed for a more focused evaluation of biological oxidation while reducing the surface area available for adsorption of hydrogen sulfide.
Using the experimental systems described above, biological solids (referred to as sludge) near the surface of the anode electrode were collected from one group of four bar-shaped conductive concrete electrodes at regular intervals. Bacterial analysis was then performed on the collected samples. To facilitate the interpretation of the bacterial analysis results, a tank with a flat concrete specimen was also prepared for comparison.

2.3. Preparation and Analysis Instruction of Wastewater Samples

The experiment was initiated by mixing 0.48 L of excess sludge (with SS of 8540 mg/L and VSS of 7410 mg/L) and digested sludge (with SS of 8040 mg/L and VSS of 7240 mg/L) obtained from the Ube City Wastewater Treatment Plant (Ube WWTP) with 3.84 L of artificial wastewater. The composition of the synthetic wastewater was as follows: in 1 L of distilled water, NaHCO3 (2.0 g), K2HPO4 (2.0 g), yeast extract (0.02 g), glucose (2.0 g), (NH4)2HPO4 (0.70 g), KCl (0.75 g), NH4Cl (0.85 g), FeCl3·6H2O (0.42 g), MgCl2·6H2O (0.81 g), MgSO4·7H2O (0.25 g), CoCl2·6H2O (0.018 g), and CaCl2·6H2O (0.15 g) were added. This mixture was stirred until all the components were completely dissolved. The resulting synthetic wastewater was then used for the experimental trials. Following the mixing, the system was allowed to settle in a static state before starting the experiment.
The pH, sulfate ion, and sulfide concentrations in the aqueous phase were continuously monitored. Sulfate ions in the water were measured using the barium sulfate turbidimetric method in accordance with USEPA method 375.4, following filtration through a 0.45 µm membrane filter. Sulfides were quantified using the methylene blue method according to USEPA method 376.2. On days 20, 40, and 68 after the start of the experiment, glucose (at a concentration of 2000 mg/L) and magnesium sulfate heptahydrate (at a concentration of 34 mg S/L) were added, once SRB had significantly reduced the sulfate ion concentration to almost 0 mg S/L. The concentration of sulfate ion added was set according to the concentration of sulfate ion typically observed in actual sewage (approximately 100 mgSO42−/L).

2.4. Analysis of the Microbial Community Involved in Inhibition of Sulfide Generation

The microbial community involved in sulfide generation inhibition was investigated by analyzing sludge samples collected from the wastewater tank and anode electrode. The analysis utilized Polymerase Chain Reaction—Denaturing Gradient Gel Electrophoresis (PCR-DGGE) and next-generation sequencing techniques to identify microbial species and assess their abundance. The aim of the analysis was to determine differences in the microbial species that were present or absent in relation to the presence of electron transfer pathways and growth conditions. PCR-DGGE was utilized to identify dominant microbial species and monitor changes in their abundance over time, while next-generation sequencing provided a comprehensive profile of the microbial community and identified the full range of microbial species present in the samples.

2.4.1. Sample Collection Method of Sludge and Types of Experimental Systems

Sludge samples were collected using a spatula from the conductive concrete electrode surface and a sterile pipette from the bottom of the tank to assess temporal changes. The surface of the concrete was cut off to a thickness of 0.5–1 mm to investigate the possibility of electron-emitting bacteria growing inside. The collected samples were stored in sterile plastic tubes at −20 °C until further analysis. Table 1 summarizes the experimental systems and sludge sampling methods used in the analysis of the bacterial community involved in the suppression of sulfide generation by PCR-DGGE.

2.4.2. Analyzing the Bacterial Community by PCR-DGGE Method

PCR-DGGE was used to analyze the bacterial community present in the sludge based on the 16S rRNA gene V3 region sequence [16,17,18,19]. DNA extraction was carried out using the DNA Extraction Kit (Nippon Gene Co., Ltd., Tokyo, Japan). The PCR protocol utilized a two-step nested PCR to increase the specificity and yield of the desired amplicon. The first-step primer used for the 16S rRNA gene was 27f/1492r for bacteria and 21f/958r for archaea [16,18]. The second step amplified the V3 region using 341f-GC/518r for bacteria and 340f-GC/519r for archaea [18,19]. The reaction conditions for bacteria and archaea PCR followed by PCR amplification of the 16S V3-V4 region [18]. Each PCR reaction (25 μL) contained Emerald Amp Max PCR Master, 10 μM of each primer, and 1.5 μL or 3.0 μL of template DNA. The PCR products were confirmed by agarose gel electrophoresis.
DGGE analysis was conducted using the DCode Microbial Community Analysis System (Bio-Rad, Berkeley, CA, USA) on 8% polyacrylamide gels containing a denaturing gradient of 40–70%. Electrophoresis was performed at a holding temperature of 60 °C and 20 V for 10 min, followed by 16 h of running at 70 V and the same temperature. After electrophoresis, the gels were stained with SYBR Gold for 1 h and DNA bands were visualized using a Chemi Doc XRS UV imaging system (Bio-Rad). DNA bands were excised and a PCR targeting the V3 region was carried out using the primers 341f/518r for bacteria and 340f/519r for archaea. DNA base sequences were determined using an Ion S5 DNA sequencer (Thermo Fisher Scientific Inc., Waltham, MA, USA). MEGA X software was used for DNA base sequence analysis, and the BLAST program (NCBI) was used to search the 16S rRNA gene (194 bp) database.

2.4.3. Next-Generation Sequencing-Based 16S Metagenomic Analysis

The 16S metagenomic analysis was performed using next-generation sequencing to analyze DNA extracted from sludge collected in Section 2.4.1. The DNA extraction was carried out using the NucleoSpin® Soil Kit (Takara Bio Inc., Kusatsu, Japan). The extracted DNA was then amplified using PCR with two primer sets targeting the 16S V3-V4 region [20]. The forward and reverse primers used for the amplification were CGTCGGCAGCGTCAGATGTGTATAAGAGACAGCCTACGGGNGGCWGCAG and GTCTCGTGGGCTCGGAGATGTGTATAAGAGACAGGACTACHVGGGTATCTAATCC, respectively. The PCR amplification conditions were as follows: initial denaturation at 95 °C for 3 min, followed by 25 cycles of denaturation at 95 °C for 30 s, annealing at 55 °C for 30 s, extension at 72 °C for 30 s, and a final extension at 72 °C for 5 min.
The amplified sample was further amplified using the Nextera XT Index Kit (Illumina, San Diego, CA, USA), which added barcodes and adapter sequences to both ends of the amplicons. The amplification conditions were as follows: initial denaturation at 95 °C for 3 min, followed by 8 cycles of denaturation at 95 °C for 30 s, annealing at 55 °C for 30 s, extension at 72 °C for 30 s, and a final extension at 72 °C for 5 min.
The V3-V4 region was then sequenced using the MiSeq Reagent Kit v3. Finally, 16S metagenomic analysis was performed on the sequence data of each sample obtained by sequencing using the Base Space analysis software. The Green Genes database was used for the analysis.

3. Results

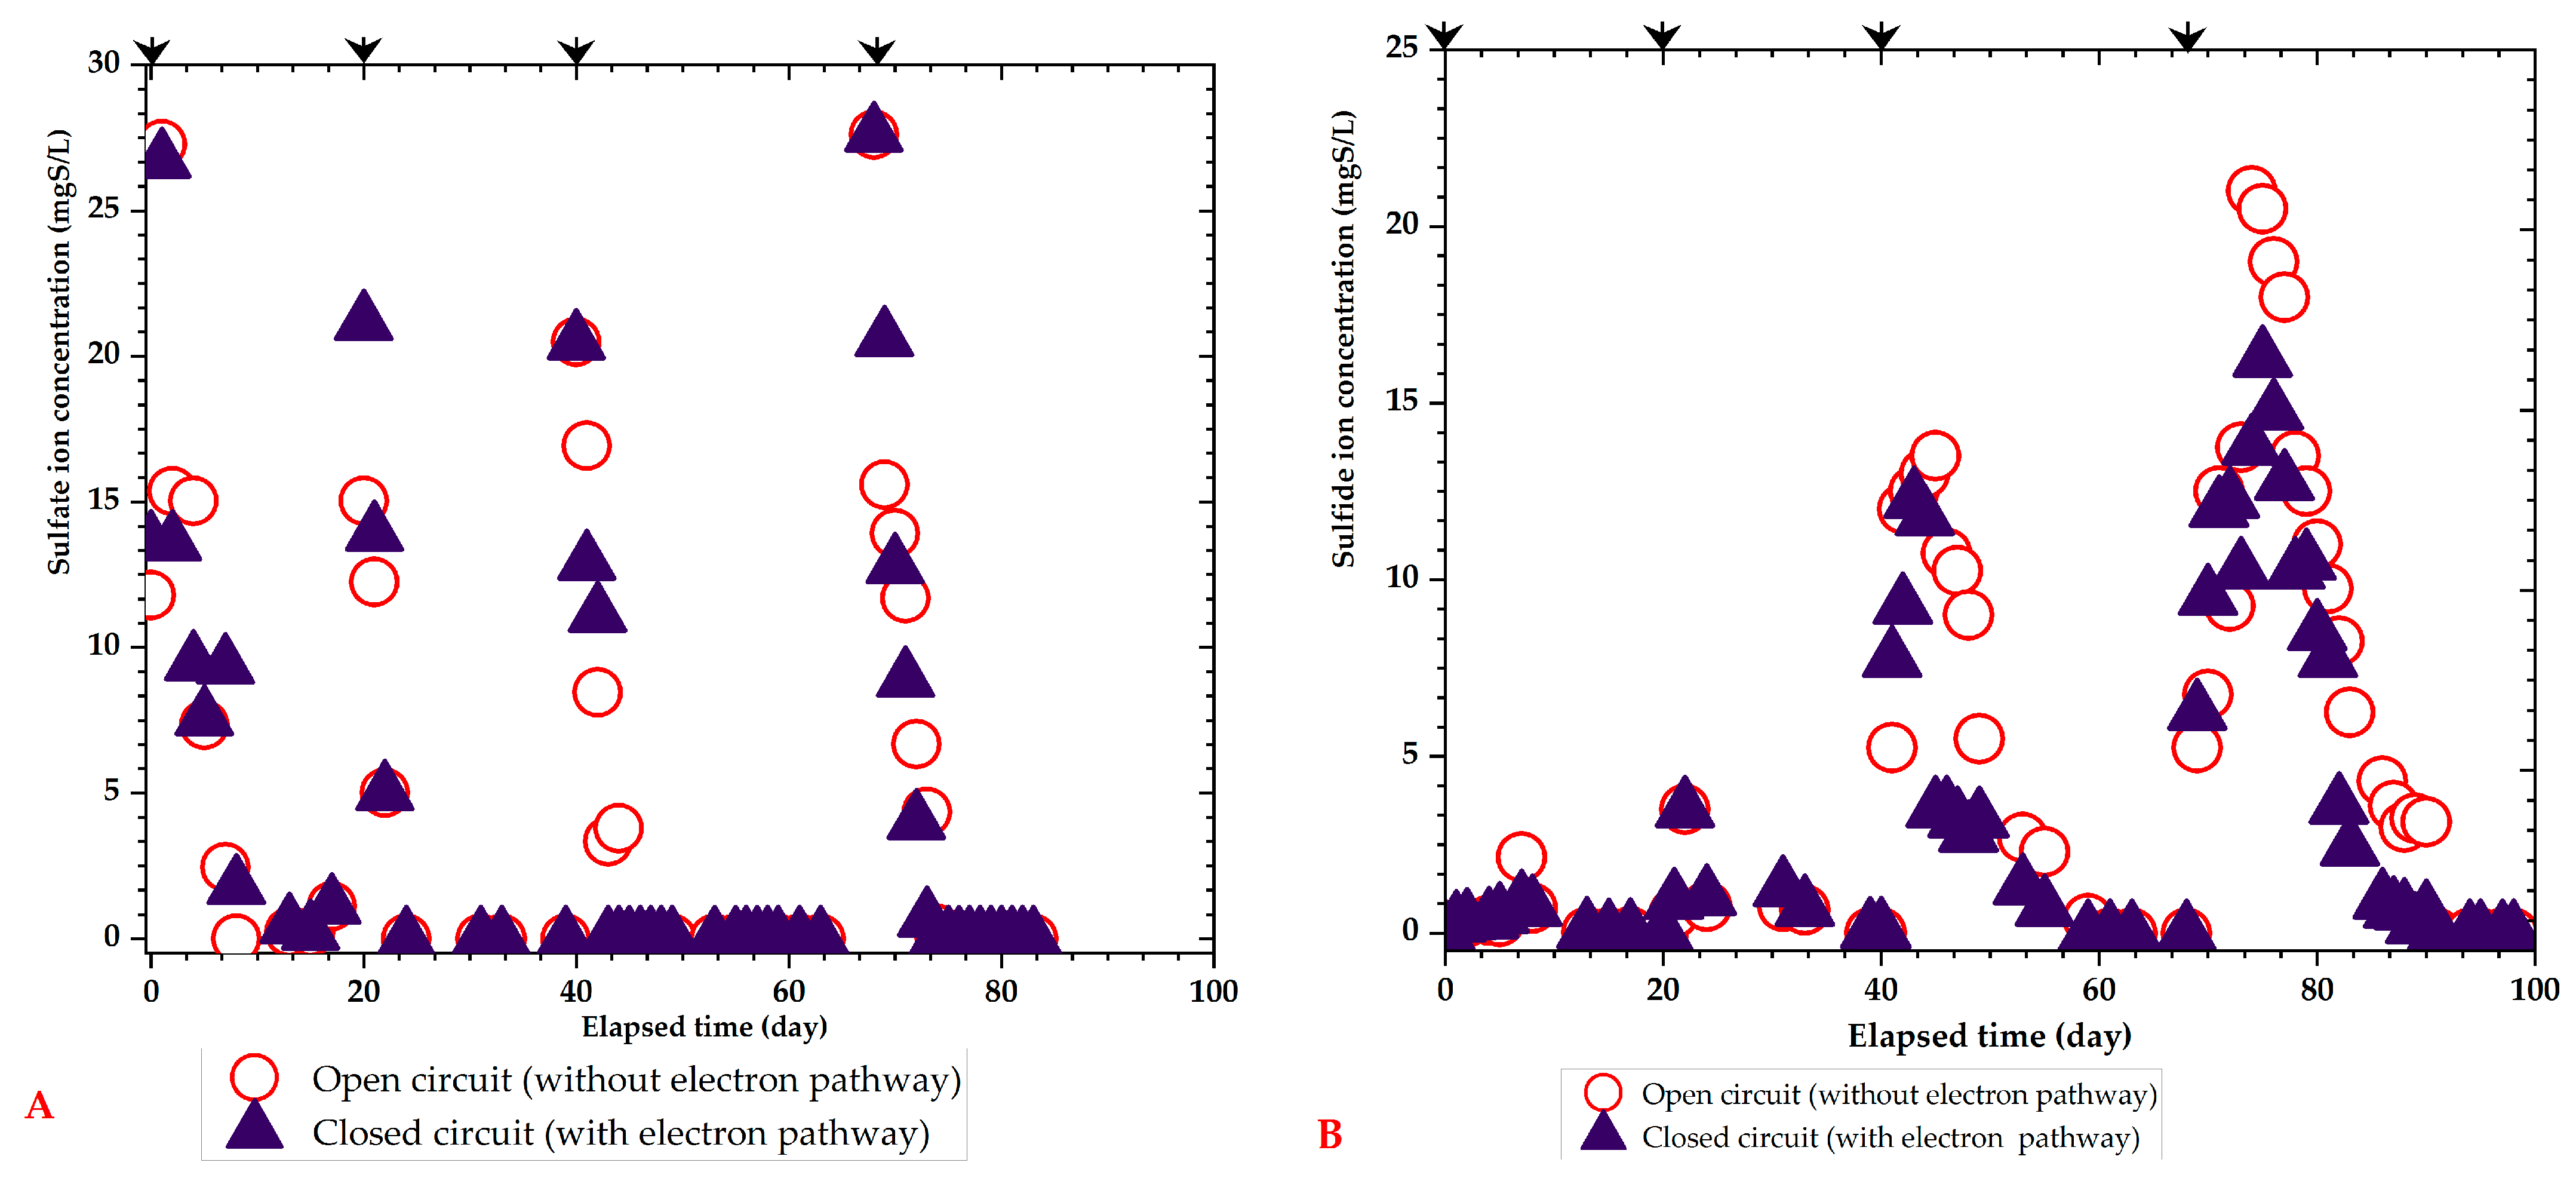
3.1. Inhibition of Hydrogen Sulfide Generation Using Conductive Concrete

Figure 3 displays the change in sulfate and sulfide ion concentrations throughout time. The initial addition of substrate, marked by the arrow in the diagram, occurred on the 20th day after the experiment began and was designated as the first cycle. The intervening days between each consecutive addition of substrate were classified as the second, third, and fourth cycles, respectively. Voltage recordings confirmed power generation during the experiment. However, the data logger malfunctioned during the second cycle, and no further data could be obtained. Sulfate ions were consumed within about five days after the start of the experiment in both cycles. For sulfide ions, no significant difference was observed in the first and second cycles, but in the third and fourth cycles, the maximum sulfide ion concentration was higher in the open circuit (without an electron pathway). This may be attributed to the insufficient growth of microorganisms responsible for the biological oxidation of sulfide during the early stages of the experiment. The main mechanism for sulfide removal was thought to be adsorption by the amorphous carbon contained in San-Earth, and sulfide was removed from the water without being affected by the presence of electron transfer pathways. However, as the cycles progressed, the adsorption sites became saturated, and biological oxidation was considered to be the primary mechanism for sulfide suppression. This led to a significant difference in the suppression effect due to the presence or absence of an electron transfer pathway. The average reduction rate of sulfide ion concentration in the closed circuit (with an electron pathway) compared to the open circuit (without an electron pathway) was calculated and is presented in Figure 3B. The reduction rates were 41.5% and 27.0% in the third and fourth cycles, respectively, and the difference was evident between the two circuits.

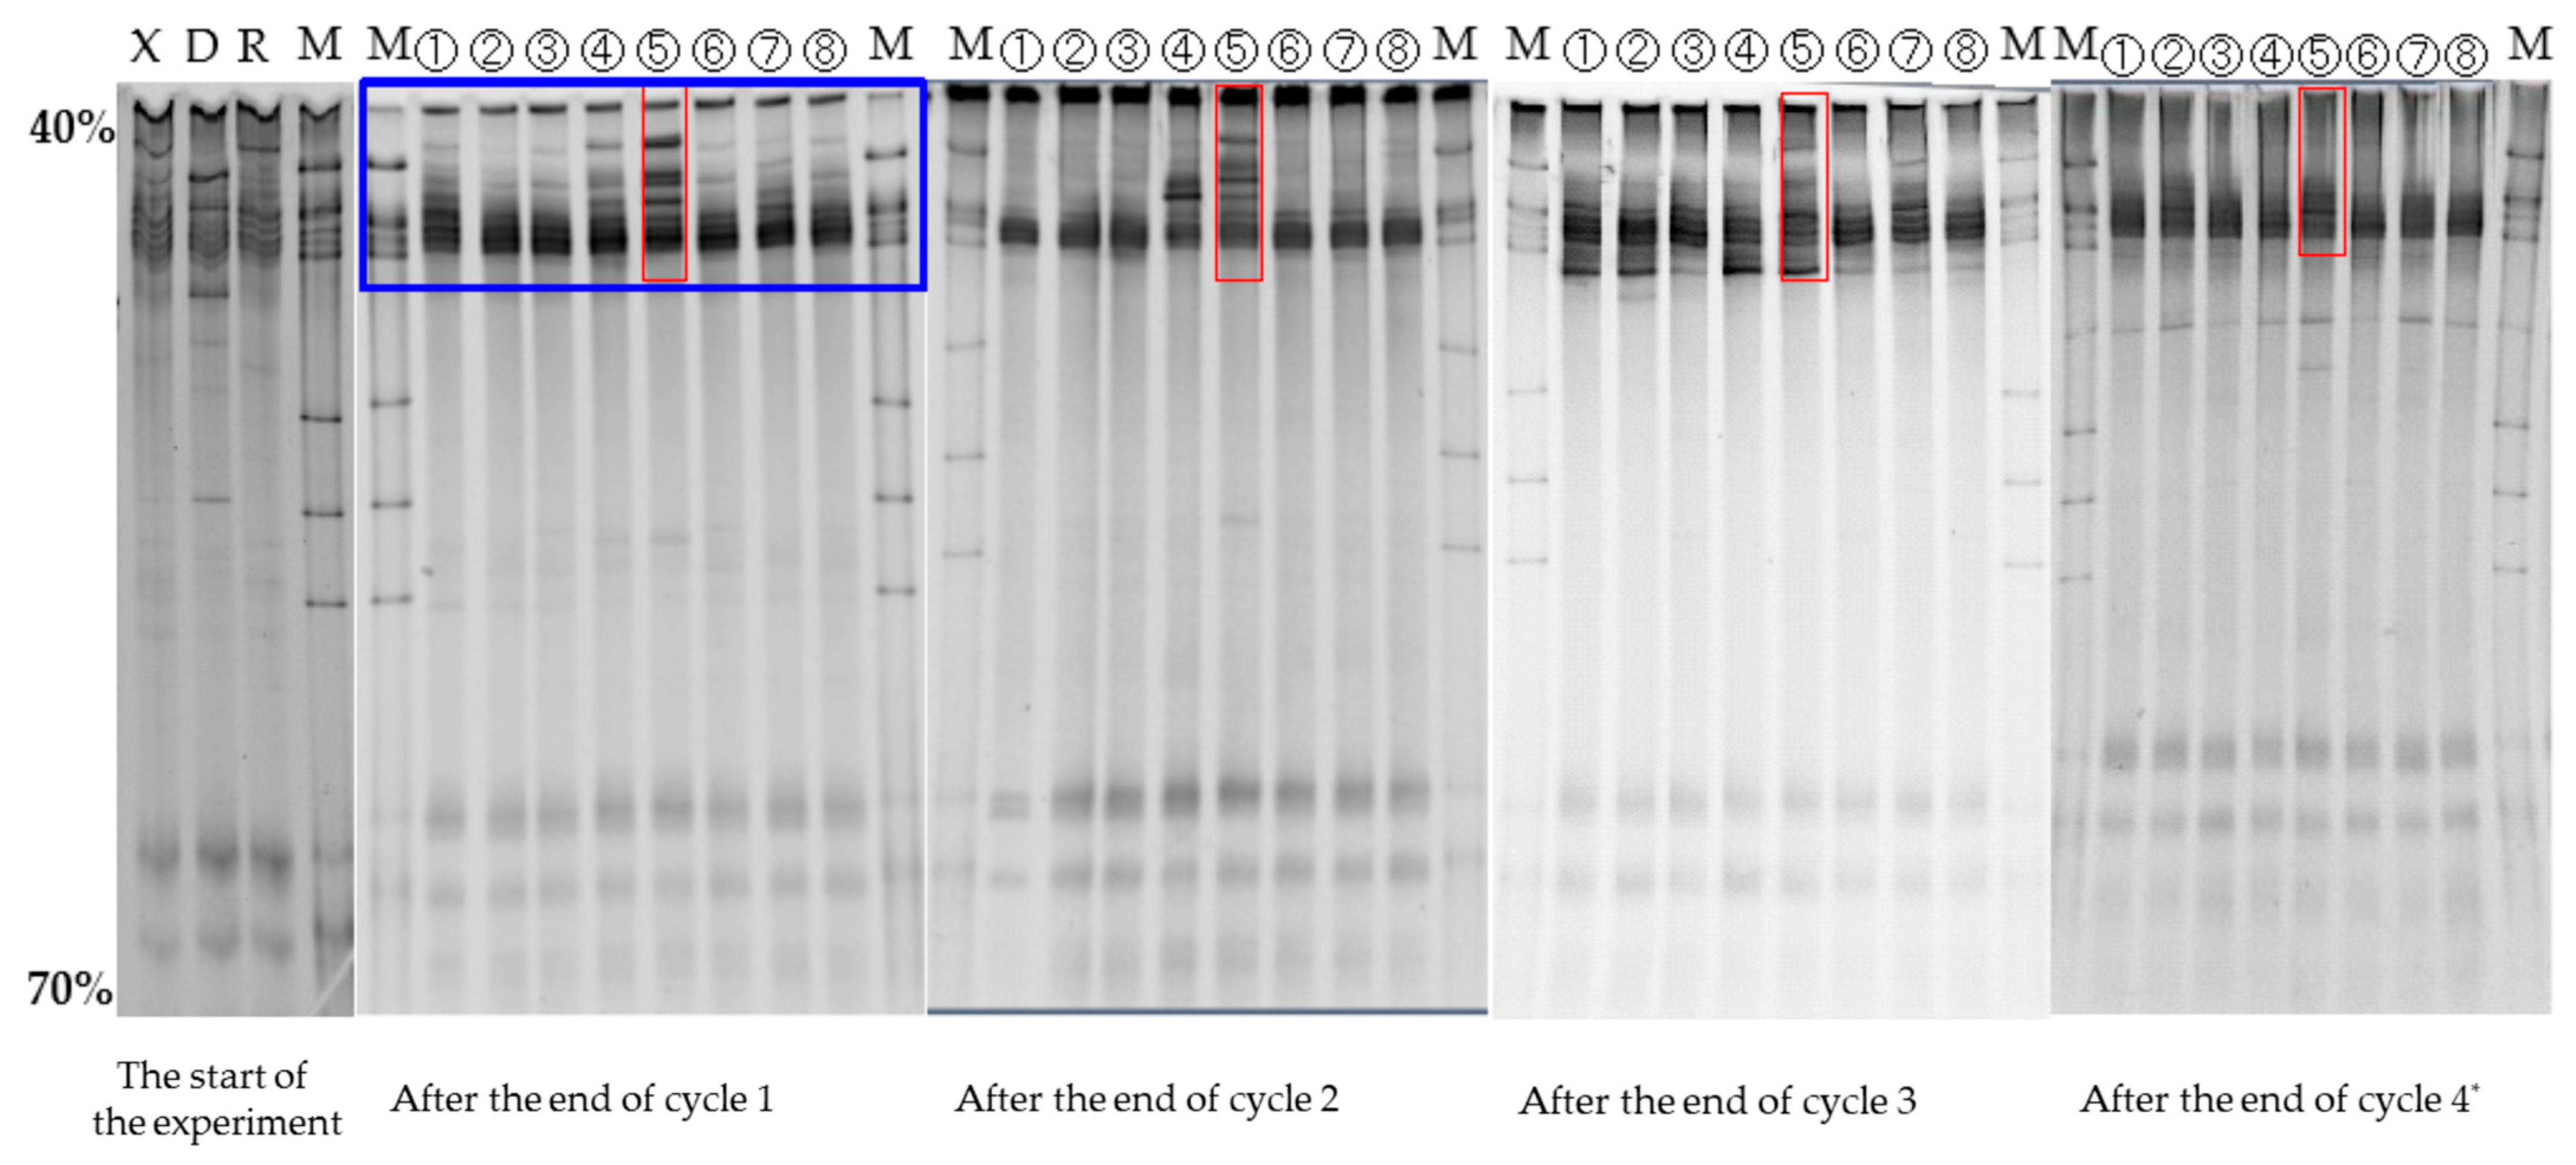
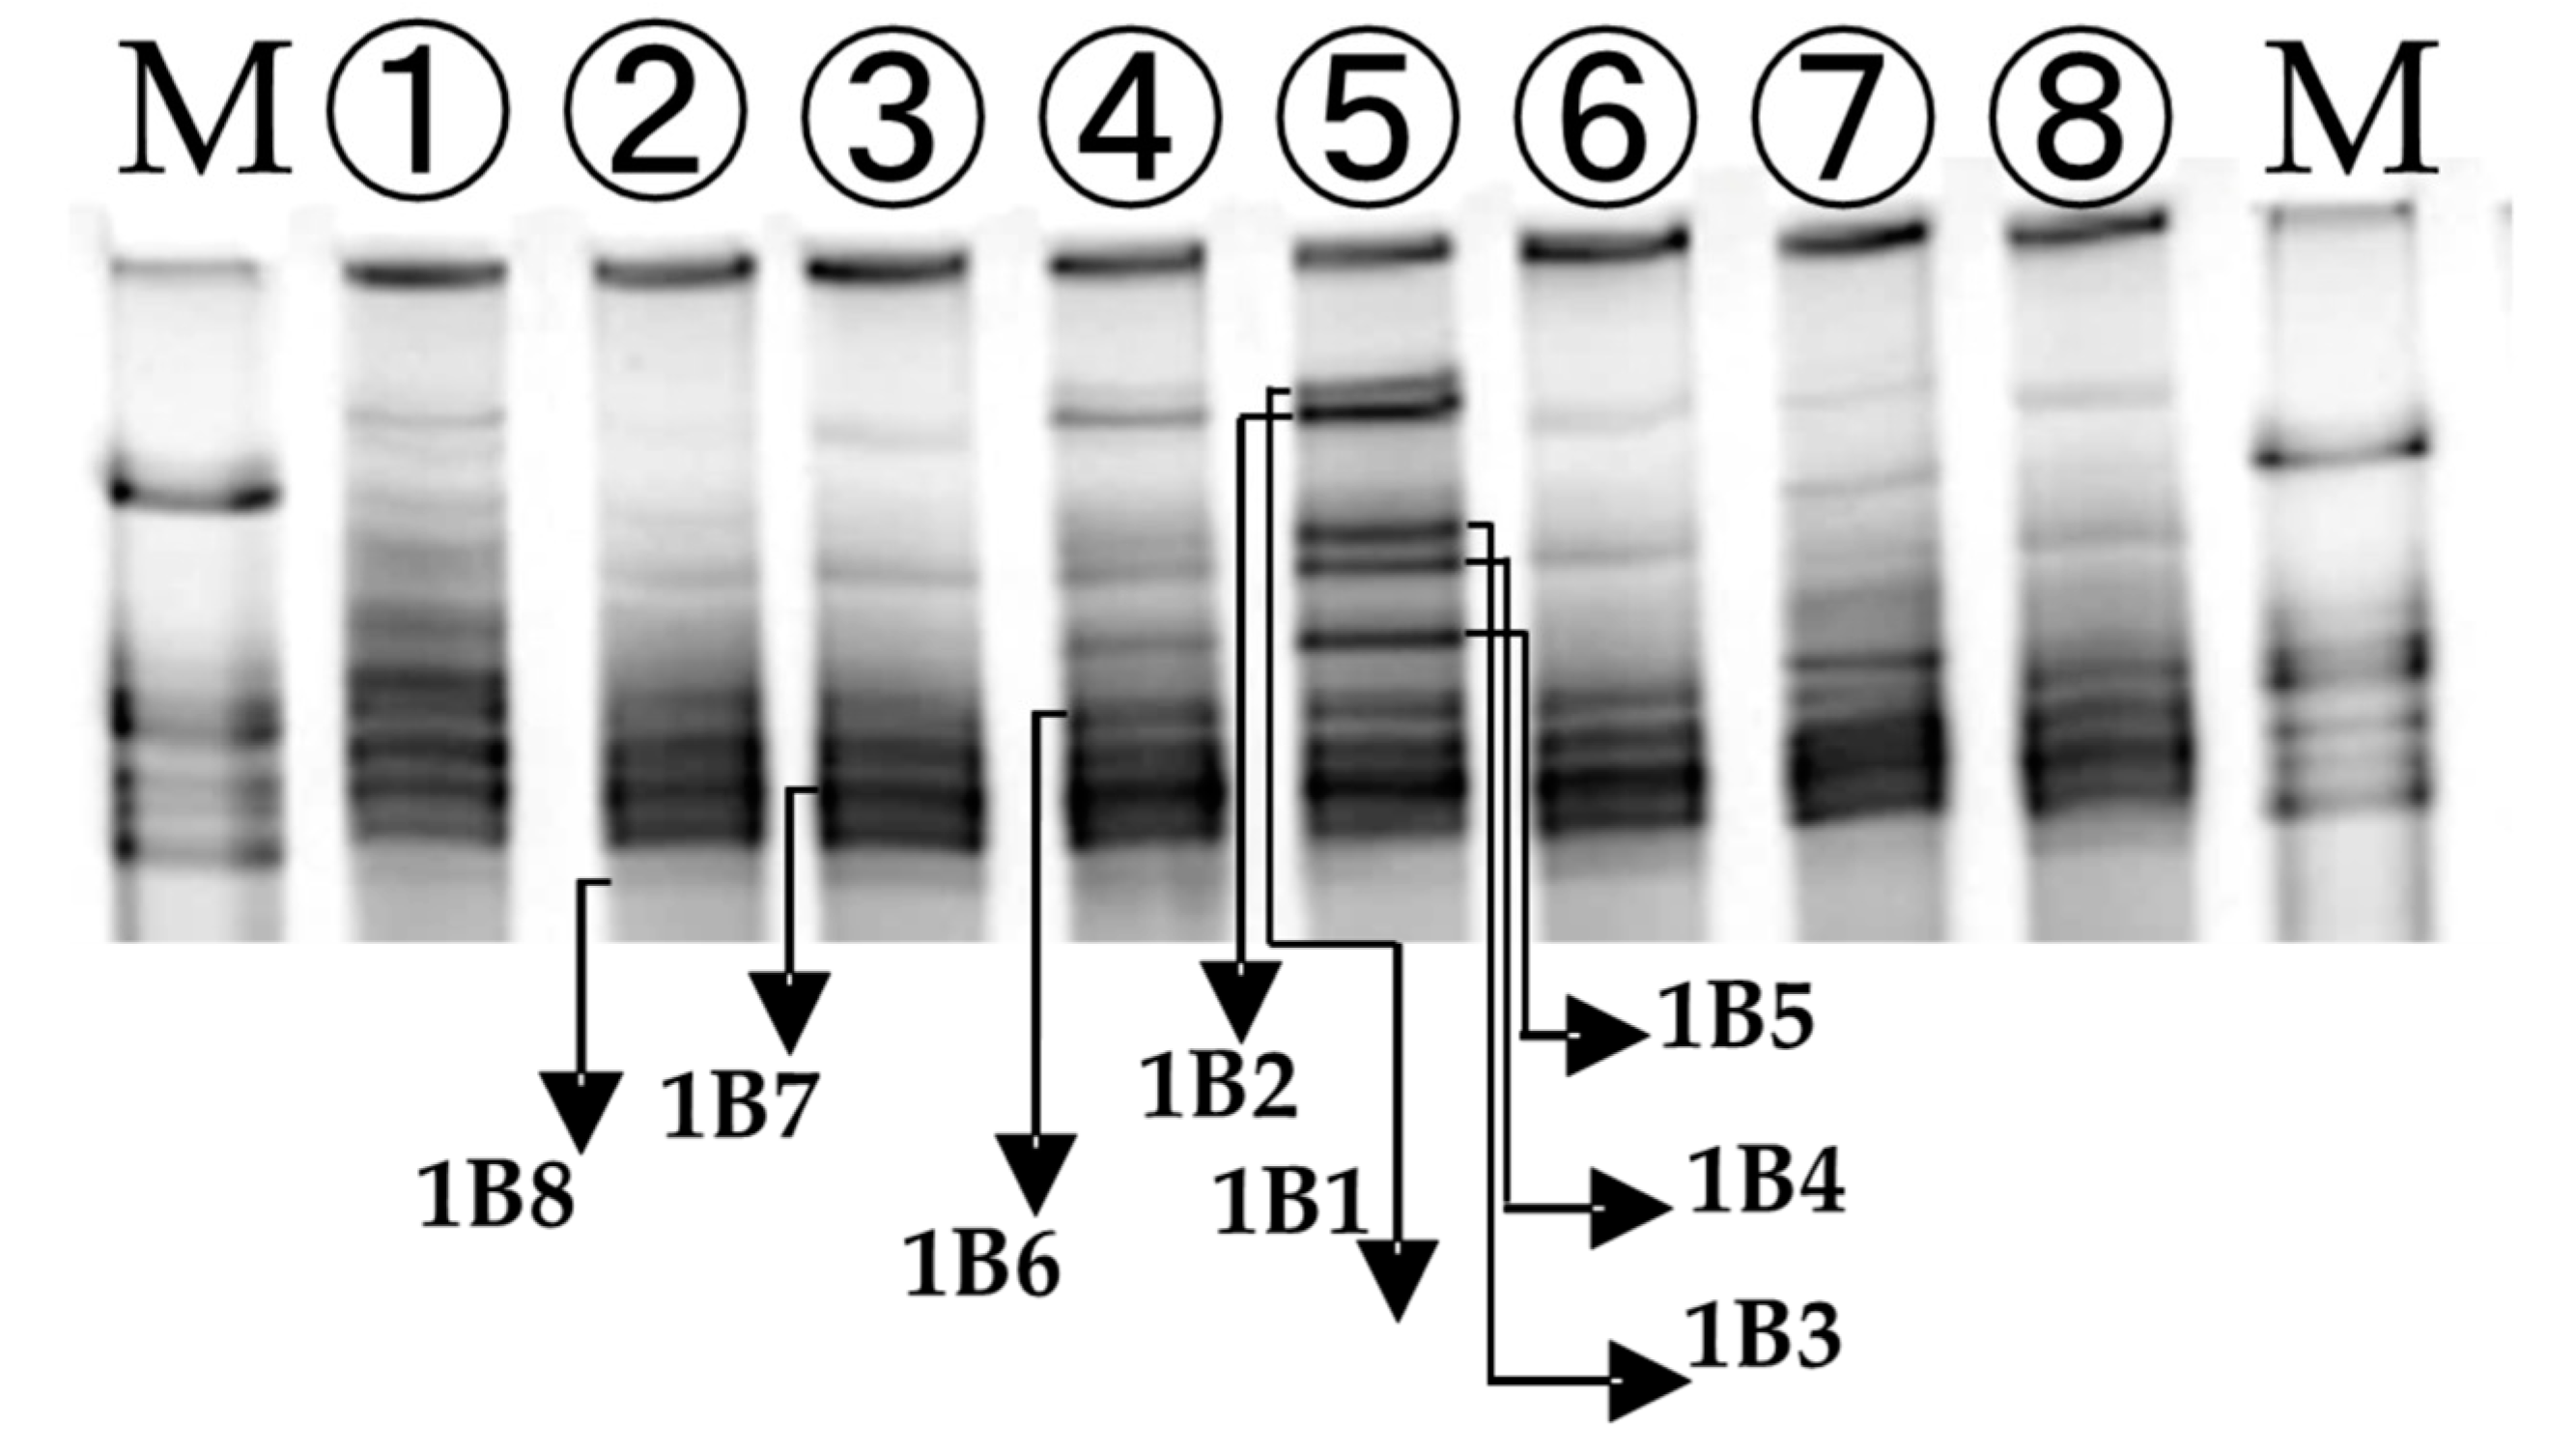
3.2. Analyzing the Bacterial Community Involved in the Suppression of Sulfide Generation by PCR-DGGE Method

Figure 4 displays the DGGE images of the bacteria at the end of each cycle, while Figure 5 shows an enlarged view of the blue-framed section after the first cycle in Figure 4. The samples in Table 1 correspond to the numbers in the DGGE results shown in Figure 4 and Figure 5. Table 2 presents information on the bacteria obtained from sequencing data after the first cycle. The symbols in Figure 5 correspond to those in Table 2, and the arrows in the image indicate the bacteria with the highest homology, identified by matching the DNA sequences with the gene database.
Bacteria of 1B1–1B4 in Table 2, which were thinly banded in the excess and digested sludge at the start of the experiment in Figure 4, were confirmed to be electricity-producing bacteria by analysis of sequencing data [21,22,23]. As clearly shown in Figure 5, these 1B1 to 1B4 bands were densest in the sludge inside the anode electrode (Figure 5, ➄). Next, the sludge on the electrode surface (Figure 5, ➃) was the second densest with 1B1 to 1B4 bands. These results suggest that electricity-producing bacteria grow predominantly inside the anode electrode rather than on its surface, and the presence or absence of an electron transfer pathway is significantly related to their growth.
The temporal changes in bands 1B1 to 1B4 were analyzed (Figure 4) to investigate the impact of the electron transfer pathways on the growth of electricity-producing bacteria in experimental systems. Dense bands were detected in the first, second, and third cycles of samples ➃ and ➄. Although the band in the third cycle appeared lighter, subsequent analysis of the 16S metagenome data using a next-generation sequencer revealed no changes in the electron-releasing bacteria. Furthermore, the overexposure of the image was evidenced by the photography conditions of the marker. Conversely, bands that were only slightly detected (faint) in cycles 1 (samples of ➀–➂, open circuit without electron transfer pathway) and ➆, ➇ (normal concrete) became even fainter and decreased in cycles 2 and 3, indicating that electricity-producing bacteria did not proliferate in the absence of an electron pathway.
Upon integration of the results presented in Section 3.1 with the current findings, it can be inferred that the biological oxidation of sulfide by electricity-producing bacteria is taking place. Following the completion of cycle 4, as denoted by an asterisk in Figure 4, the substrate was left for approximately one month to assess the decline in electron-producing bacteria. The boxed region demonstrates a noticeable reduction in the intensity of bands 1B1–1B4, signifying a substantial decrease in electron-producing bacteria during substrate consumption within a month. This observation is also supported by the 16S metagenomic sequencing results presented in the subsequent section.

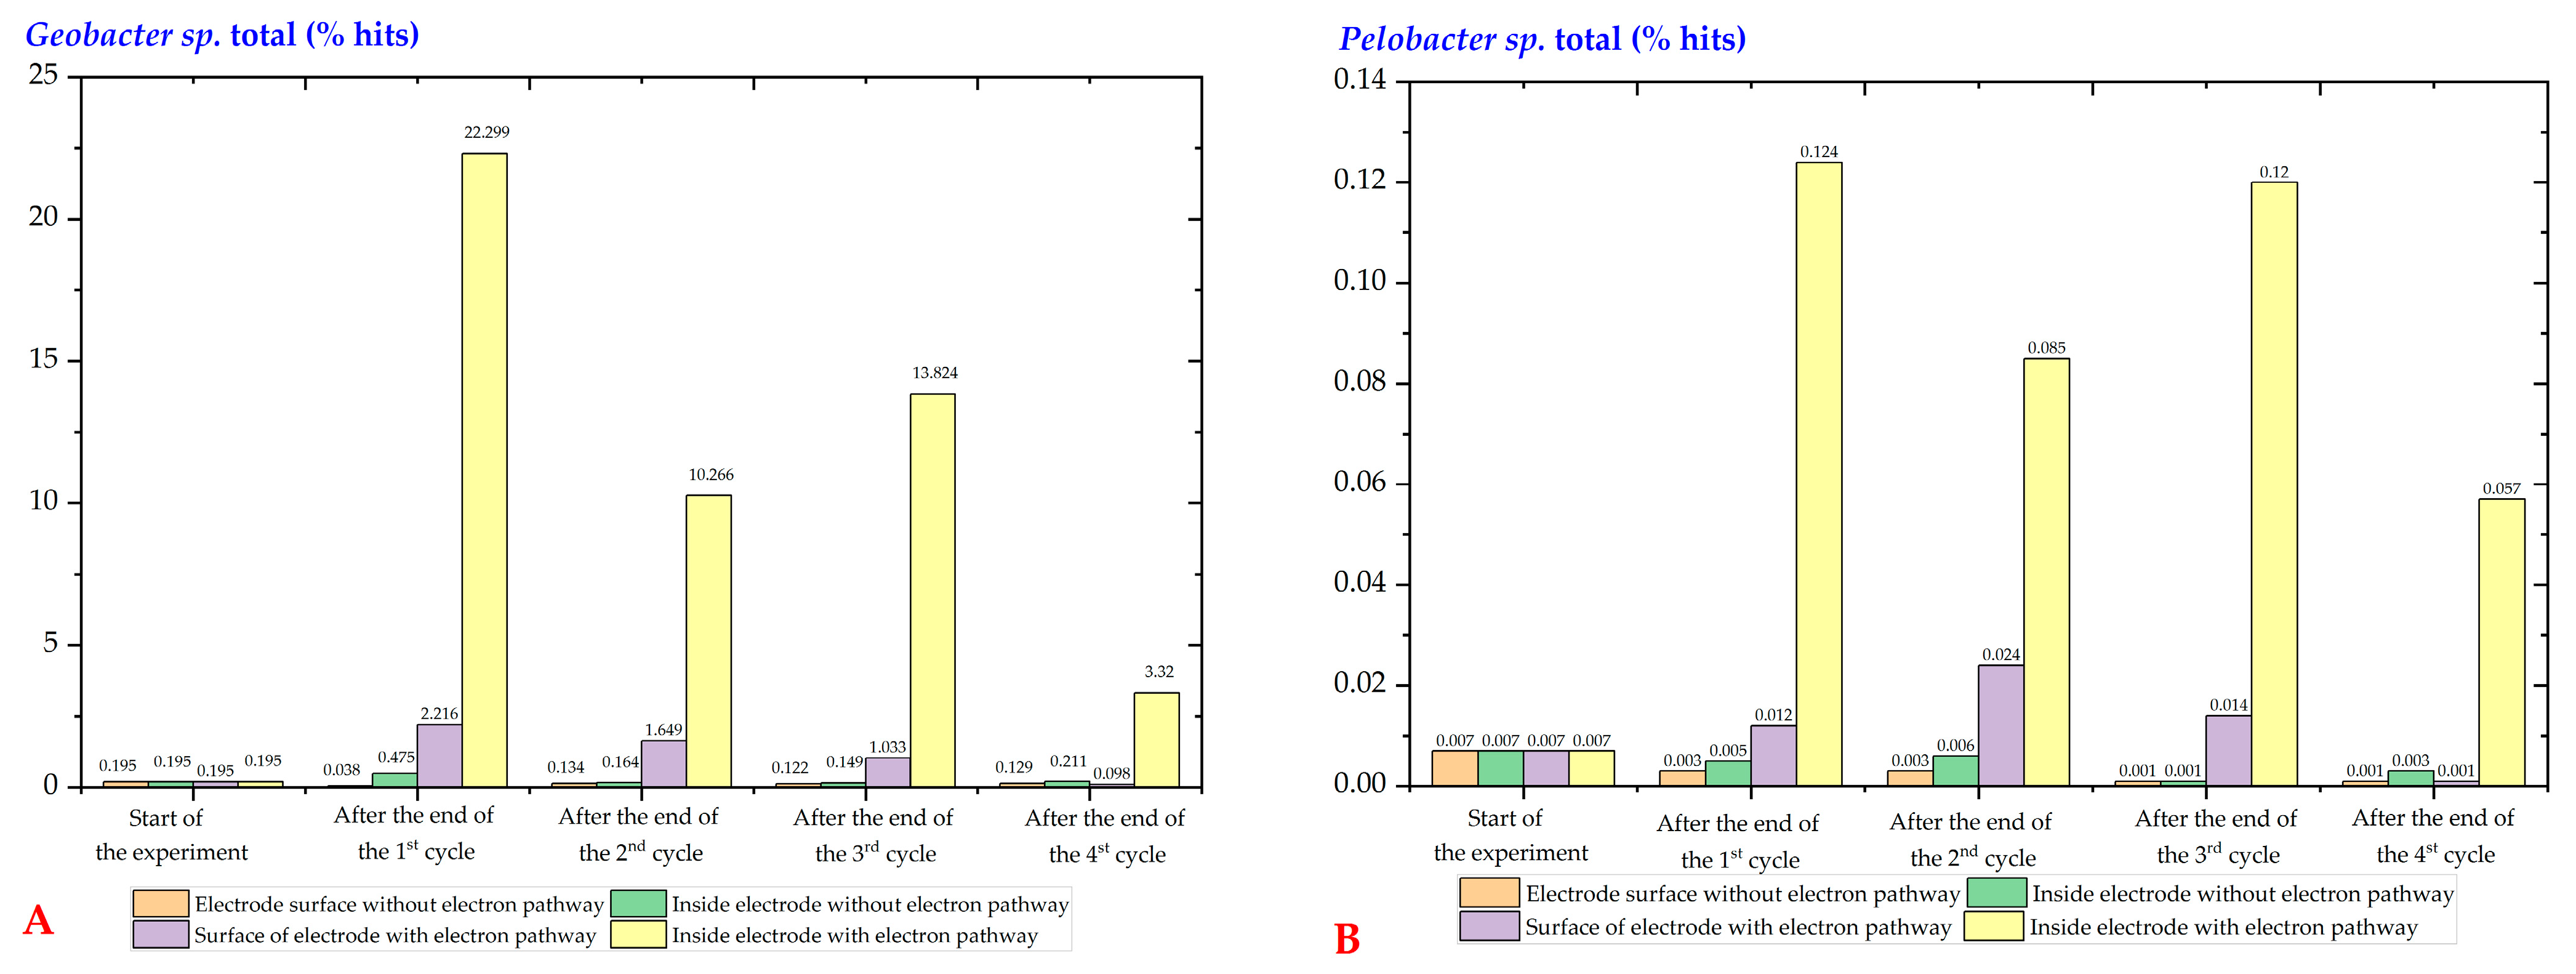
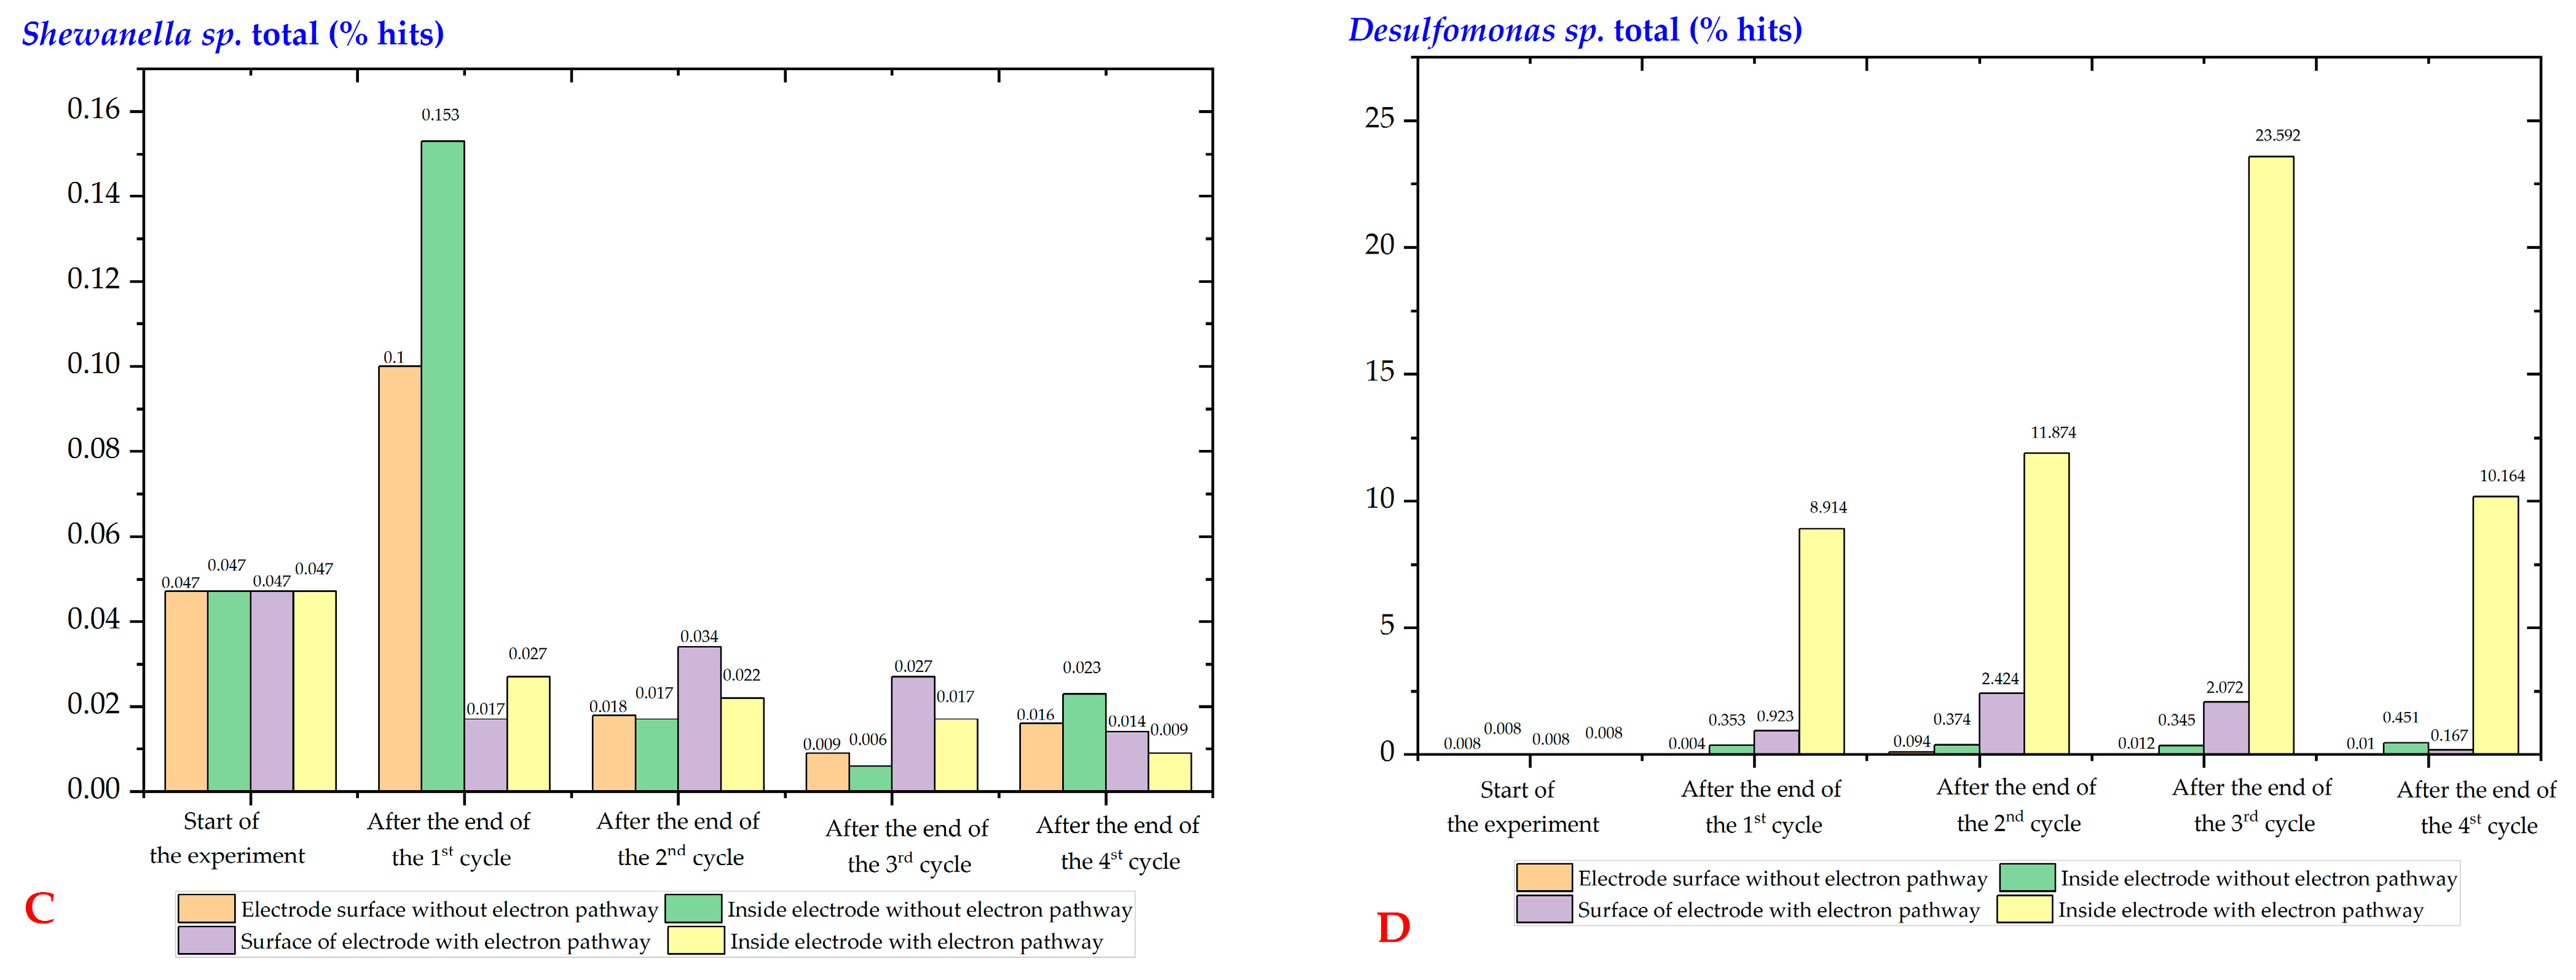
3.3. Next-Generation Sequencing-Based 16S Metagenomic Analysis: Quantitative Evaluation of Bacteria Involved in Sulfide Generation Inhibition

The abundance of electricity-producing and sulfate-reducing bacteria during each cycle is illustrated in Figure 6, which is based on 16S metagenomic analysis using next-generation sequencing. Table 3 provides the total number of reads obtained for each sample, and Table 4 illustrates the top 20 genera identified in the analysis. The “% hits” in Figure 6 represents the percentage of the total number of reads accounted for by a particular species, such as Geobacter sp. Geobacter sp. Was the most frequently detected representative electron-emitting bacteria identified by both the PCR-DGGE method and 16S metagenomic analysis using next-generation sequencing (see Table 4). In Figure 6A, all species belonging to the Geobacter genus, including those that were not identified, are collectively represented as the genus. This is also the case for Figure 6B–D. The figure displays the percentage of reads relative to the total number of reads, as can be seen from Table 3, and the number of reads per sample varies slightly, requiring accurate determination of microorganism evolution between cycles. The electron-emitting bacteria were detected in the following order of decreasing detection rate: inside electrode with electron transfer pathway > electrode surface with electron transfer pathway > inside electrode without electron transfer pathway > electrode surface without electron transfer pathway, as shown in the Figure 6A. This order was consistent for all cycles. These findings support the results obtained by the PCR-DGGE method (Section 3.2) and suggest that the presence or absence of the electron transfer pathways has a significant effect on the growth of Geobacter sp., a representative electricity-producing bacterium. Notably, Geobacter sp. Growth was most prominent in the electrode interior with the electron transfer pathways. Thus, environmental conditions that promote the electron transfer pathways can enhance the growth and accumulation of Geobacter sp., a representative EPB.
Figure 6B summarizes the results for Pelobacter sp., which was detected and identified by both the PCR-DGGE method and 16S metagenomic analysis using next-generation sequencing. Its detection frequency was lower than that of Geobacter sp., but the order of detection was consistent for all cycles: inside electrode with electron pathway >> electrode surface with electron pathway >> inside electrode without electron pathway >> electrode surface without electron pathway. These results suggest that the presence of the electron transfer pathways also influences the growth of Pelobacter sp. Figure 6C summarizes the results of Shewanella sp., a well-known electricity-producing bacteria in the field of microbial fuel cells. This bacterium was not detected or identified in the bacterial flora analysis by PCR-DGGE but was detected in the 16S metagenomic analysis using next-generation sequencing. Contrary to the results of Geobacter sp. And Pelobacter sp., Shewanella sp. Showed almost no growth with or without an electron transfer pathway. This indicates that although Shewanella sp. Is an electricity-producing bacteria, it was not involved in the biological oxidation of sulfide in this experimental system. Therefore, not all electron-emitting bacteria are necessarily involved in the biological oxidation of sulfide. Desulfomonas sp., a sulphate-reducing bacterium, was initially detected at low levels before the start of the experiment, but its detection rate increased as the cycle progressed, particularly inside the surface layer of the electrode, as shown in Figure 6D.

4. Discussion

The study found that conductive concrete can suppress H2S through biological oxidation, with electricity-producing bacteria playing a significant role. The presence of the electron transfer pathways was found to be essential for the growth of these bacteria, with Geobacter sp. being the most frequently detected. Pelobacter sp. was also detected but had a lower detection frequency. Shewanella sp., another electricity-producing bacterium, was not involved in the biological oxidation of sulfide. Desulfomonas sp., a sulfate-reducing bacterium, showed significant growth near the electrode poles with EPB, suggesting symbiosis between them. The findings of this study indicate that the presence of an electron transfer pathway is critical for the growth and accumulation of electricity-producing bacteria such as Geobacter sp. and Pelobacter sp. The reduction rates observed in this study were lower than those reported in previous studies [14], possibly due to the smaller surface area of the anodes in this experimental system. This finding suggests that the biological oxidation effect of hydrogen sulfide was observed, and further bacterial flora analysis was conducted to gain a deeper understanding of the process. The importance of an electron transfer pathway was confirmed by the growth of Geobater sp. and Pelobacter sp. The results indicate that presence of an electron transfer pathway has a significant impact on the growth of these bacteria and agree with the previous studies [24,25]. The sulfate-reducing bacterium was found to be most concentrated in the sediment within the anode electrode of the closed circuit, similar to the electricity-producing bacteria. This suggests that sulfate-reducing bacteria and electron-excreting bacteria can coexist and thrive in anaerobic conditions. However, without an electron transfer pathway, the growth of sulfate-reducing bacteria was limited, as indicated by a considerably fainter band (Figure 6). Next-generation sequencing analysis revealed that Geobacter sp. proliferated rapidly inside the electrode when an electron transfer pathway was provided. In contrast, Shewanella sp. showed little to no growth regardless of the presence or absence of an electron transfer pathway. These findings suggest that not all electricity-producing bacteria are involved in the biological oxidation of sulfide. This could be explained that Geobacter sp. use a unique electron transfer pathway called the direct interspecies electron transfer (DIET) pathway, which allow their electrically conductive pili (e-pili) to plug into conductive carbon substances, such as San-Earth [26]. The molecular analysis of the microbial community in anaerobic environment is consistent with previous findings [27,28,29] that Geobacter species are the most numerous bacteria (Table 4) and exhibit a remarkable level of metabolic activity, especially in the presence of conductive materials. This property makes conductive concrete a supportive structure for EPB bacteria’s e-pili to anchor, leading to their strong mobilization.
The presence of electricity-producing bacteria, particularly Geobacter sp. and Pelobacter sp., has been shown to significantly increase in response to biological oxidation of sulfide in experimental systems. These findings highlight the potential of utilizing electricity-producing bacteria for the removal of sulfide in industrial wastewater and other environmental systems [30,31,32]. Further research is needed to identify the specific bacteria responsible for sulfide oxidation and to optimize conditions that promote their growth and activity to enhance their performance in sulfide removal applications. Interestingly, Desulfomonas sp., a sulfate-reducing bacterium that does not produce electrons, was observed to exhibit significant growth near the electrode poles alongside the electricity-producing bacteria, suggesting symbiosis. Despite the accumulation of Desulfomonas sp. in the electrode of the conductive concrete, its presence had little effect on the rate of sulfate concentration decrease (Figure 3), indicating that it does not accelerate sulfide formation. However, the abundance of Desulfomonas sp. was significantly higher with an electron transfer pathway than without, as supported by the results of PCR-DGGE in Section 3.2. These results suggest that creating favorable environmental conditions for the growth of electricity-producing bacteria using conductive concrete, which provides an electron transfer pathway, can promote the growth and accumulation of Geobacter sp. and Pelobacter sp. near the surface of the concrete. The growth and accumulation of these electron-emitting bacteria, along with the inhibition of sulfide formation, provide evidence for the contribution of biological oxidation to the inhibition of hydrogen sulfide generation.

5. Conclusions

In this study, we aimed to investigate the potential of biological oxidation for controlling the formation of hydrogen through experiments involving the use of conductive concrete to provide an electron transfer pathway, and the analysis of bacterial flora through molecular biological methods such as PCR-DGGE and next-generation sequencing. The results revealed that Geobacter sp. and Pelobacter sp., which are known as typical electricity-producing bacteria, were found to grow and accumulate in the immediate vicinity of the conductive concrete surface. Further, the growth and accumulation of these electricity-producing bacteria were found to be associated with the suppression of sulfide formation. These findings provided compelling evidence that biological oxidation plays a critical role in inhibiting the generation of hydrogen sulfide. In the future, long-term demonstration tests are planned to be conducted using a new conductive concrete that has been separately developed, along with actual sewage water. Such a study will investigate whether the growth and accumulation of electricity-producing bacteria occurs in a similar manner to the present study. The findings from such experiments will provide insights into the effectiveness of the use of conductive concrete as a potential solution for controlling the generation of hydrogen sulfide in wastewater treatment plants.

Author Contributions

Conceptualization and writing—original draft preparation, H.T.V.; methodology, validation, supervision T.I.; methodology, visualization, software, H.T.V., M.F.; formal analysis, M.F., T.S.; investigation, project administration, T.I., H.S. and T.H.; writing—review and editing, T.I., Y.-T.H. All authors have read and agreed to the published version of the manuscript.

Funding

This research was funded in part by JSPS KAKENHI (20K04749); GAIA Project, Ministry of Land, Infrastructure, Transport and Tourism (No. 4).

Data Availability Statement

Data may be made available on request from the corresponding author.

Acknowledgments

We are gratefully acknowledged for the support from Yamaguchi University for providing the infrastructural facilities, grateful to Shuji Tanaka, a consultant for TNK Waterworks Co., Ltd., for his useful comments and advice.

Conflicts of Interest

The authors declare no conflict of interest.

References

  1. Foorginezhad, S.; Mohseni-Dargah, M.; Firoozirad, K.; Aryai, V.; Razmjou, A.; Abbassi, R.; Garaniya, V.; Beheshti, A.; Asadnia, M. Recent Advances in Sensing and Assessment of Corrosion in Sewage Pipelines. Process Saf. Environ. Prot. 2021, 147, 192–213. [Google Scholar] [CrossRef]
  2. Wang, Y.; Li, P.; Liu, H.; Wang, W.; Guo, Y.; Wang, L. The Effect of Microbiologically Induced Concrete Corrosion in Sewer on the Bearing Capacity of Reinforced Concrete Pipes: Full-Scale Experimental Investigation. Buildings 2022, 12, 1996. [Google Scholar] [CrossRef]
  3. Chaudhari, B.; Panda, B.; Šavija, B.; Chandra Paul, S. Microbiologically Induced Concrete Corrosion: A Concise Review of Assessment Methods, Effects, and Corrosion-Resistant Coating Materials. Materials 2022, 15, 4279. [Google Scholar] [CrossRef] [PubMed]
  4. Little, B.J.; Blackwood, D.J.; Hinks, J.; Lauro, F.M.; Marsili, E.; Okamoto, A.; Rice, S.A.; Wade, S.A.; Flemming, H.C. Microbially influenced corrosion—Any progress? Corros. Sci. 2020, 170, 108641. [Google Scholar] [CrossRef]
  5. Zhang, L.; De Schryver, P.; De Gusseme, B.; De Muynck, W.; Boon, N.; Verstraete, W. Chemical and biological technologies for hydrogen sulfide emission control in sewer systems: A review. Water Res. 2008, 42, 1–12. [Google Scholar] [CrossRef] [PubMed]
  6. Pikaar, I.; Sharma, K.R.; Hu, S.; Gernjak, W.; Keller, J.; Yuan, Z. Reducing sewer corrosion through integrated urban water management. Science 2014, 345, 812–814. [Google Scholar] [CrossRef]
  7. Nielsen, A.H.; Vollertsen, J. Model Parameters for Aerobic Biological Sulfide Oxidation in Sewer Wastewater. Water 2021, 13, 981. [Google Scholar] [CrossRef]
  8. Anwar, A.; Liu, X.; Zhang, L. Biogenic corrosion of cementitious composite in wastewater sewerage system—A review. Process Saf. Environ. Prot. 2022, 165, 545–585. [Google Scholar] [CrossRef]
  9. Mohanakrishnan, J.; Gutierrez, O.; Meyer, R.L.; Yuan, Z. Nitrite effectively inhibits sulfide and methane production in a laboratory scale sewer reactor. Water Res. 2008, 42, 3961–3971. [Google Scholar] [CrossRef]
  10. Chaturvedi, V.; Verma, P. Microbial fuel cell: A green approach for the utilization of waste for the generation of bioelectricity. Bioresour. Bioprocess. 2016, 3, 38. [Google Scholar] [CrossRef]
  11. Venkatramanan, V.; Shah, S.; Prasad, R. A Critical Review on Microbial Fuel Cells Technology: Perspectives on Wastewater Treatment. Open Biotechnol. J. 2021, 15, 131–141. [Google Scholar] [CrossRef]
  12. Van Dinh, C. Anticorrosion Behavior of the SiO2/Epoxy Nanocomposite-Concrete Lining System under H2SO4 Acid Aqueous Environment. ACS Omega 2020, 5, 10533–10542. [Google Scholar] [CrossRef]
  13. Stanaszek-Tomal, E.; Fiertak, M. Biological and chemical corrosion of cement materials modified with polymer. Bull. Polish Acad. Sci. Tech. Sci. 2015, 63, 591–596. [Google Scholar] [CrossRef]
  14. Imai, T.; Vo, H.T.; Fukushima, M.; Suzuki, T.; Sakuma, H.; Hitomi, T. Application of Conductive Concrete as a Microbial Fuel Cell to Control H2S Emission for Mitigating Sewer Corrosion. Water 2022, 14, 3454. [Google Scholar] [CrossRef]
  15. Sassani, A.; Ceylan, H.; Kim, S.; Arabzadeh, A.; Taylor, P.C.; Gopalakrishnan, K. Development of Carbon Fiber-modified Electrically Conductive Concrete for Implementation in Des Moines International Airport. Case Stud. Constr. Mater. 2018, 8, 277–291. [Google Scholar] [CrossRef]
  16. Takahashi, S.; Tomita, J.; Nishioka, K.; Hisada, T.; Nishijima, M. Development of a prokaryotic universal primer for simultaneous analysis of Bacteria and Archaea using next-generation sequencing. PLoS ONE 2014, 9, e105592. [Google Scholar] [CrossRef]
  17. Muyzer, G.; De Waal, E.C.; Uitterlinden, A.G. Profiling of complex microbial populations by denaturing gradient gel electrophoresis analysis of polymerase chain reaction-amplified genes coding for 16S rRNA. Appl. Environ. Microbiol. 1993, 59, 695–700. [Google Scholar] [CrossRef]
  18. Kongjan, P.; O-Thong, S.; Kotay, M.; Min, B.; Angelidaki, I. Biohydrogen production from wheat straw hydrolysate by dark fermentation using extreme thermophilic mixed culture. Biotechnol. Bioeng. 2010, 105, 899–908. [Google Scholar] [CrossRef]
  19. Schäfer, H.; Muyzer, M.G. Denaturing gradient gel electrophoresis in marine microbial ecology. Methods Microbiol. 2001, 30, 452–468. [Google Scholar]
  20. Illumina, 16S Metagenomic Sequencing Library Preparation, Part # 150. Illumina.com. 2013. Available online: https://jp.support.illumina.com/content/dam/illumina-support/documents/documentation/chemistry_documentation/16s/16s-metagenomic-library-prep-guide-15044223-b.pdf (accessed on 24 May 2022).
  21. Ewing, T.; Ha, P.T.; Beyenal, H. Evaluation of long-term performance of sediment microbial fuel cells and the role of natural resources. Appl. Energy 2017, 192, 490–497. [Google Scholar] [CrossRef]
  22. Liu, L.; Tsyganova, O.; Lee, D.-J.; Su, A.; Chang, J.-S.; Wang, A.; Ren, N. Anodic biofilm in single-chamber microbial fuel cells cultivated under different temperatures. Int. J. Hydrogen Energy 2012, 37, 15792–15800. [Google Scholar] [CrossRef]
  23. Rubaba, O.; Araki, Y.; Yamamoto, S.; Suzuki, K.; Sakamoto, H.; Matsuda, A.; Futamata, H. No TitleElectricity Producing Property and Bacterial Community Structure in Microbial Fuel Cells Equipped with Membrane Electrode Assembly. J. Biosci. Bioeng. 2013, 116, 106–113. [Google Scholar] [CrossRef] [PubMed]
  24. Kondaveeti, S.; Lee, S.H.; Park, H.D.; Min, B. Specific enrichment of different Geobacter sp. in anode biofilm by varying interspatial distance of electrodes in air-cathode microbial fuel cell (MFC). Electrochim. Acta 2020, 331, 135388. [Google Scholar] [CrossRef]
  25. Blanchet, E.; Desmond, E.; Erable, B.; Bridier, A.; Bouchez, T.; Bergel, A. Comparison of synthetic medium and wastewater used as dilution medium to design scalable microbial anodes: Application to food waste treatment. Bioresour. Technol. 2015, 185, 106–115. [Google Scholar] [CrossRef] [PubMed]
  26. Lovley, D.R. Syntrophy Goes Electric: Direct Interspecies Electron Transfer. Annu. Rev. Microbiol. 2017, 71, 643–664. [Google Scholar] [CrossRef]
  27. Baek, G.; Kim, J.; Cho, K.; Bae, H.; Lee, C. The biostimulation of anaerobic digestion with (semi)conductive ferric oxides: Their potential for enhanced biomethanation. Appl. Microbiol. Biotechnol. 2015, 99, 10355–10366. [Google Scholar] [CrossRef]
  28. González, J.; Sánchez, M.; Gómez, X. Enhancing Anaerobic Digestion: The Effect of Carbon Conductive Materials. C J. Carbon Res. 2018, 4, 59. [Google Scholar] [CrossRef]
  29. Zhao, Z.; Zhang, Y.; Woodard, T.L.; Nevin, K.P.; Lovley, D.R. Enhancing syntrophic metabolism in up-flow anaerobic sludge blanket reactors with conductive carbon materials. Bioresour. Technol. 2015, 191, 140–145. [Google Scholar] [CrossRef]
  30. Nielsen, L.P.; Risgaard-Petersen, N.; Fossing, H.; Christensen, P.B.; Sayama, M. Electric currents couple spatially separated biogeochemical processes in marine sediment. Nature 2010, 463, 1071–1074. [Google Scholar] [CrossRef]
  31. Clauwaert, P.; Rabaey, K.; Aelterman, P.; de Schamphelaire, L.; Pham, T.H.; Boeckx, P.; Boon, N.; Verstraete, W. Biological denitrification in microbial fuel cells. Environ. Sci. Technol. 2007, 41, 3354–3360. [Google Scholar] [CrossRef]
  32. Yanuka-Golub, K.; Reshef, L.; Rishpon, J.; Gophna, U. Specific Desulfuromonas Strains Can Determine Startup Times of Microbial Fuel Cells. Appl. Sci. 2020, 10, 8570. [Google Scholar] [CrossRef]
Figure 1. Mechanism of hydrogen sulfide generation inhibition by EPB.
Water 15 01749 g001
Figure 2. Illustration of the conductive concrete and electrodes used in the experiment. (A) a scanning electron microscopy image of the conductive substance (amorphous carbon) of the electrode made from conductive concrete; (B) the experimental setup with a rod-shaped electrode (V: Voltmeter, R: Resistor, Anode electrode is placed at the bottom of the water tank, cathode electrode is placed near the water surface with half of it submerged). The diagram depicts a closed circuit with an electron pathway.
Water 15 01749 g002
Figure 3. Illustration of the results of a 91-day experiment on inhibiting hydrogen sulfide generation using conductive concrete. (A) changes in sulfate ion concentration, (B) changes in sulfide ion concentration. Glucose at 2000 mg/L and magnesium sulfate at 34 mg S/L (equivalent to 100 mg SO42−/L) were added on day 20, 40, and 68.
Water 15 01749 g003
Figure 4. Results of DGGE analysis of bacteria at the end of each cycle. (*: left for about one month after the substrate was completely consumed, M: marker, X: mixed sludge, D: digested sludge, R: excess sludge).
Water 15 01749 g004
Figure 5. DGGE analysis results of bacteria at the end of cycle 1.
Water 15 01749 g005
Figure 6. Changes in representative electricity-producing bacteria (Geobacter sp., Pelobacter sp., Shewanella sp., and Desulfomonas sp.) in each cycle extracted and organized from the analysis results of 16S metagenomes using next-generation sequencer. (A) Geobacter sp., (B) Pelobacter sp., (C) Shewanella sp., (D) Desulfomonas sp. Units in each graph represent the proportion of detected bacteria.
Water 15 01749 g006aWater 15 01749 g006b
Table 1. Types of experimental systems and methods for sludge collection.
SampleExperimental SystemMethods for Sludge Collection
Open circuit
(Without electron pathway) conductive concrete
Collect sludge on electrode surfaces with a medicine spoon
Sludge is scraped from the electrode surface using a cutter knife, enabling the accumulation and growth of microbial communities for subsequent analysis
Sludge obtained from the bottom of the tank
Closed circuit
(With electron pathway) conductive concrete
Collect sludge on electrode surfaces with a medicine spoon
Sludge is scraped from the electrode surface using a cutter knife, enabling the accumulation and growth of microbial communities for subsequent analysis
Sludge obtained from the bottom of the tank
Normal concreteThe biofilm on the surface of the concrete was removed using a cutter knife
Sludge sample obtained from the bottom of the tank
Table 2. Information on bacteria obtained from community analysis.
SymbolCycleBacteria Similarity (%)
1B1After the end
of the cycle 1
Geobacter uraniireducens Rf498.28
1B2Geobacter psychrophilus strain P35100.00
1B3Pelobacter carbinolicus DSM 238096.88
1B4Pelobacter carbinolicus DSM 238095.77
1B5Desulfuromonas acetexigens strain 287397.56
1B6Macrococcus epidermidis strain CCN 7099100.00
1B7Fusibacter fontis strain KhaIAKB198.59
1B8Fusibacter fontis strain KhaIAKB198.63
Table 3. Total number of reads for each sample.
Number of Reads
Electrode Surfaces without Electron PathwaysInside the Electrode without Electron PathwaysElectrode Surfaces with Electron PathwaysInside the Electrode with Electron Pathways
At the start of the experiment217.894 217.894 217.894 217.894
1st cycle173.389 209.664 193.306 172.297
2nd cycle163.275 171.655 192.780 216.892
3rd cycle200.233 223.374 202.819 193.217
4th cycle203.301 197.302 207.014 217.431
Table 4. Illustration of top 20 Genera from 16S Metagenome Analysis. (Other: percentage of total reads attributed to all genera ranked 21st and below, including unidentified species).
Before the Experiment StartedAfter the 1st CycleAfter the 2nd Cycle
Electrode Surface without Electron PathwayInside Electrode without Electron PathwayElectrode Surface without Electron PathwayInside Electrode without Electron PathwayElectrode Surface without Electron PathwayInside Electrode without Electron PathwayElectrode Surface without Electron PathwayInside Electrode without Electron Pathway
Genus%_hitsGenus%_hitsGenus%_hitsGenus%_hitsGenus%_hitsGenus%_hitsGenus%_hitsGenus%_hitsGenus%_hits
Dechloromonas5.71Pseudomonas14.49Clostridium6.28Trichococcus10.41Geobacter22.3Trichococcus9.17Trichococcus11.82Thauera12.21Desulfuromonas11.88
Fervidobacterium2.82Comamonas9.02Parabacteroides5.77Clostridium7.57Desulfuromonas8.91Clostridium7.6Clostridium9.49Clostridium6.4Clostridium10.5
Nitrospira2.39Stenotrophomonas3.92Trichococcus5.05Alkaliphilus5.47Parabacteroides4.82Parabacteroides4.55Parabacteroides3.87Trichococcus5.46Geobacter10.27
Anaerobaculum1.99Ochrobactrum3.34Comamonas4.79Parabacteroides3.9Clostridium3.6Cystobacter4.15Alkaliphilus3.54Chthoniobacter3.32Trichococcus6.4
Clostridium1.75Thauera3.12Fusibacter3.91Fusibacter2.68Trichococcus3.55Alkaliphilus2.71Cystobacter2.91Parabacteroides2.84Thauera5.07
Saccharopolyspora1.69Azospirillum2.99Pseudomonas3.55Geobacter2.22Alkaliphilus2.6Fusibacter2.25Pedobacter2.73Pedobacter2.83Alkaliphilus2.46
Lewinella1.45Campylobacter2.37Alkaliphilus3.13Sedimentibacter2.02Pedobacter2.13Pedobacter2.07Sedimentibacter2.12Desulfuromonas2.42Pedobacter2.37
Caldilinea1.31Diaphorobacter2.1Brevundimonas2.47Enterococcus1.84Fusibacter2.09Sedimentibacter2.02Fusibacter1.92Cystobacter1.81Parabacteroides2.32
Tepidanaerobacter1.27Shinella1.82Arcobacter1.71Nitrospira1.42Desulfobulbus1.6Chryseobacterium1.86Sphingobacterium1.9Arcobacter1.77Sedimentibacter1.58
Candidatus Scalindua1.25Delftia1.79Thauera1.55Lactococcus1.4Sedimentibacter1.27Sphingobacterium1.61Candidatus Tammella1.32Geobacter1.65Fusibacter1.46
Thauera1.16Clostridium1.74Sedimentibacter1.53Heliorestis1.37Dechloromonas1.14Chthoniobacter1.48Chryseobacterium1.25Sphaerochaeta1.53Desulfovibrio0.95
Bifidobacterium1.13Trichococcus1.63Desulfobulbus1.31Saccharopolyspora1.3Lactococcus1.11Candidatus Tammella1.11Heliorestis1.2Fusibacter1.5Candidatus Tammella0.93
Vogesella1.05Flavobacterium1.57Pedobacter1.22Desulfovibrio1.28Thauera0.99Desulfovibrio0.87Desulfovibrio0.78Sphingobacterium1.49Cystobacter0.86
Rhodobacter1Acidovorax1.54Saccharopolyspora1.09Candidatus Tammella0.95Enterococcus0.77Heliorestis0.76Myroides0.76Azoarcus1.36Lactococcus0.81
Thermodesulfovibrio0.97Uliginosibacterium1.53Desulfomicrobium1.07Desulfuromonas0.92Tolumonas0.65Aminiphilus0.64Desulfobulbus0.71Alkaliphilus1.31Sphingobacterium0.77
Dokdonella0.89Devosia1.52Stenotrophomonas1.02Dechloromonas0.85Bacteroides0.64Treponema0.56Thauera0.68Desulfovibrio1.3Arcobacter0.7
Hyphomicrobium0.86Snowella1.36Heliorestis0.94Azospirillum0.79Desulfovibrio0.63Synergistes0.54Flavobacterium0.64Pseudomonas1.23Pseudomonas0.7
Aminiphilus0.83Brevundimonas1.26Enterococcus0.91Pedobacter0.74Cystobacter0.6Fervidobacterium0.54Treponema0.61Sedimentibacter1.14Myroides0.69
Megasphaera0.82Xenophilus1.21Lactococcus0.9Candidatus Scalindua0.71Desulfosarcina0.56Acholeplasma0.53Chthoniobacter0.59Synergistes1.03Comamonas0.67
Azospirillum0.82Bdellovibrio1.16Bacteroides0.87Holdemania0.7Saccharopolyspora0.54Tepidanaerobacter0.52Synergistes0.56Aequorivita0.95Acholeplasma0.58
other68.86other40.51other50.94other51.48other39.49other54.46other50.6other46.47other38.05
After the 3rd CycleAfter the 4th Cycle
Electrode Surface without Electron PathwayInside Electrode without Electron PathwayElectrode Surface without Electron PathwayInside Electrode without Electron PathwayElectrode Surface without Electron PathwayInside Electrode without Electron PathwayElectrode Surface without Electron PathwayInside Electrode without Electron Pathway
Genus%_hitsGenus%_hitsGenus%_hitsGenus%_hitsGenus%_hitsGenus%_hitsGenus%_hitsGenus%_hits
Clostridium35.95Clostridium49.59Clostridium29.51Clostridium24.78Clostridium25.68Clostridium36.07Clostridium18.96Trichococcus28.13
Trichococcus17.1Trichococcus12.02Trichococcus6.24Desulfuromonas23.59Trichococcus11.16Trichococcus19.03Trichococcus12.17Clostridium20.06
Parabacteroides1.91Parabacteroides2.38Pedobacter4.57Geobacter13.82Anaerostipes4.14Pedobacter4Anaerostipes9.99Desulfuromonas10.16
Sedimentibacter1.58Pedobacter1.8Parabacteroides3.08Trichococcus4.74Blautia3.81Bacteroides1.73Blautia8.69Anaerostipes4.89
Alkaliphilus1.56Heliorestis1.56Desulfuromonas2.07Pedobacter2.72Pedobacter3.11Desulfomicrobium1.69Pseudomonas2.8Blautia4.04
Pedobacter1.38Sedimentibacter1.29Tolumonas1.75Parabacteroides1.92Pseudomonas3.08Anaerostipes1.6Alkaliphilus1.87Geobacter3.32
Heliorestis1.37Alkaliphilus1.23Bacteroides1.53Treponema0.76Desulfomicrobium2.43Blautia1.43Thauera1.64Pedobacter1.84
Desulfomicrobium0.89Desulfomicrobium0.73Sedimentibacter1.4Sedimentibacter0.73Bacteroides2.19Acidaminococcus1.22Hydrogenophaga1.59Parabacteroides1.8
Zoogloea0.66Candidatus Tammella0.66Hydrogenophaga1.15Sphingobacterium0.65Acidaminococcus1.62Treponema1.19Pedobacter1.54Desulfovibrio1
Blautia0.65Desulfovibrio0.65Chthoniobacter1.13Alkaliphilus0.6Parabacteroides1.31Parabacteroides1.16Shinella1.42Acidaminococcus1
Desulfovibrio0.64Zoogloea0.6Alkaliphilus1.05Tolumonas0.56Alkaliphilus1.06Desulfobulbus0.85Parabacteroides1.16Desulfomicrobium0.84
Hydrogenophaga0.59Pseudomonas0.57Geobacter1.03Desulfobulbus0.52Treponema1.03Sphingobacterium0.82Agrobacterium0.97Sedimentibacter0.65
Candidatus Tammella0.59Enterococcus0.55Zoogloea0.91Desulfuromusa0.48Sedimentibacter0.99Heliorestis0.8Acidaminococcus0.89Treponema0.63
Anaerostipes0.57Acetobacterium0.45Treponema0.9Bacteroides0.4Desulfobulbus0.75Acholeplasma0.78Bacteroides0.78Bacteroides0.63
Fusibacter0.52Myroides0.44Sphingobacterium0.87Lactococcus0.39Heliorestis0.68Sedimentibacter0.65Candidatus Tammella0.75Sphingobacterium0.62
Dechloromonas0.48Desulfonauticus0.41Desulfomicrobium0.81Desulfomicrobium0.37Bellilinea0.67Desulfovibrio0.59Arcobacter0.74Alkaliphilus0.62
Pseudomonas0.47Flavobacterium0.4Candidatus Tammella0.72Myroides0.35Sphingobacterium0.66Methyloversatilis0.54Comamonas0.74Candidatus Tammella0.54
Bacteroides0.46Fusibacter0.39Thiobacillus0.68Desulfovibrio0.34Candidatus Tammella0.57Alkaliphilus0.51Sphingobacterium0.66Desulfobulbus0.52
Enterococcus0.45Desulfobulbus0.35Flavobacterium0.67Cystobacter0.33Desulfotalea0.53Rhodobacter0.5Rhizobium0.66Anaeromusa0.48
Desulfonauticus0.44Desulfuromonas0.35Desulfovibrio0.65Desulfosarcina0.31Methyloversatilis0.52Desulfotignum0.49Desulfomicrobium0.62Heliorestis0.35
other31.74other23.61other39.28other21.66other34.03other24.36other31.38other17.89
Disclaimer/Publisher’s Note: The statements, opinions and data contained in all publications are solely those of the individual author(s) and contributor(s) and not of MDPI and/or the editor(s). MDPI and/or the editor(s) disclaim responsibility for any injury to people or property resulting from any ideas, methods, instructions or products referred to in the content.

