
Interactions Evaluation between the Jouamaa Hakama Groundwater and Ouljat Echatt River in the North of Morocco, Using Hydrochemical Modeling, Multivariate Statistics and GIS

 , ,
, ,  , and
, and
Abstract
:1. Introduction
2. Materials and Methods
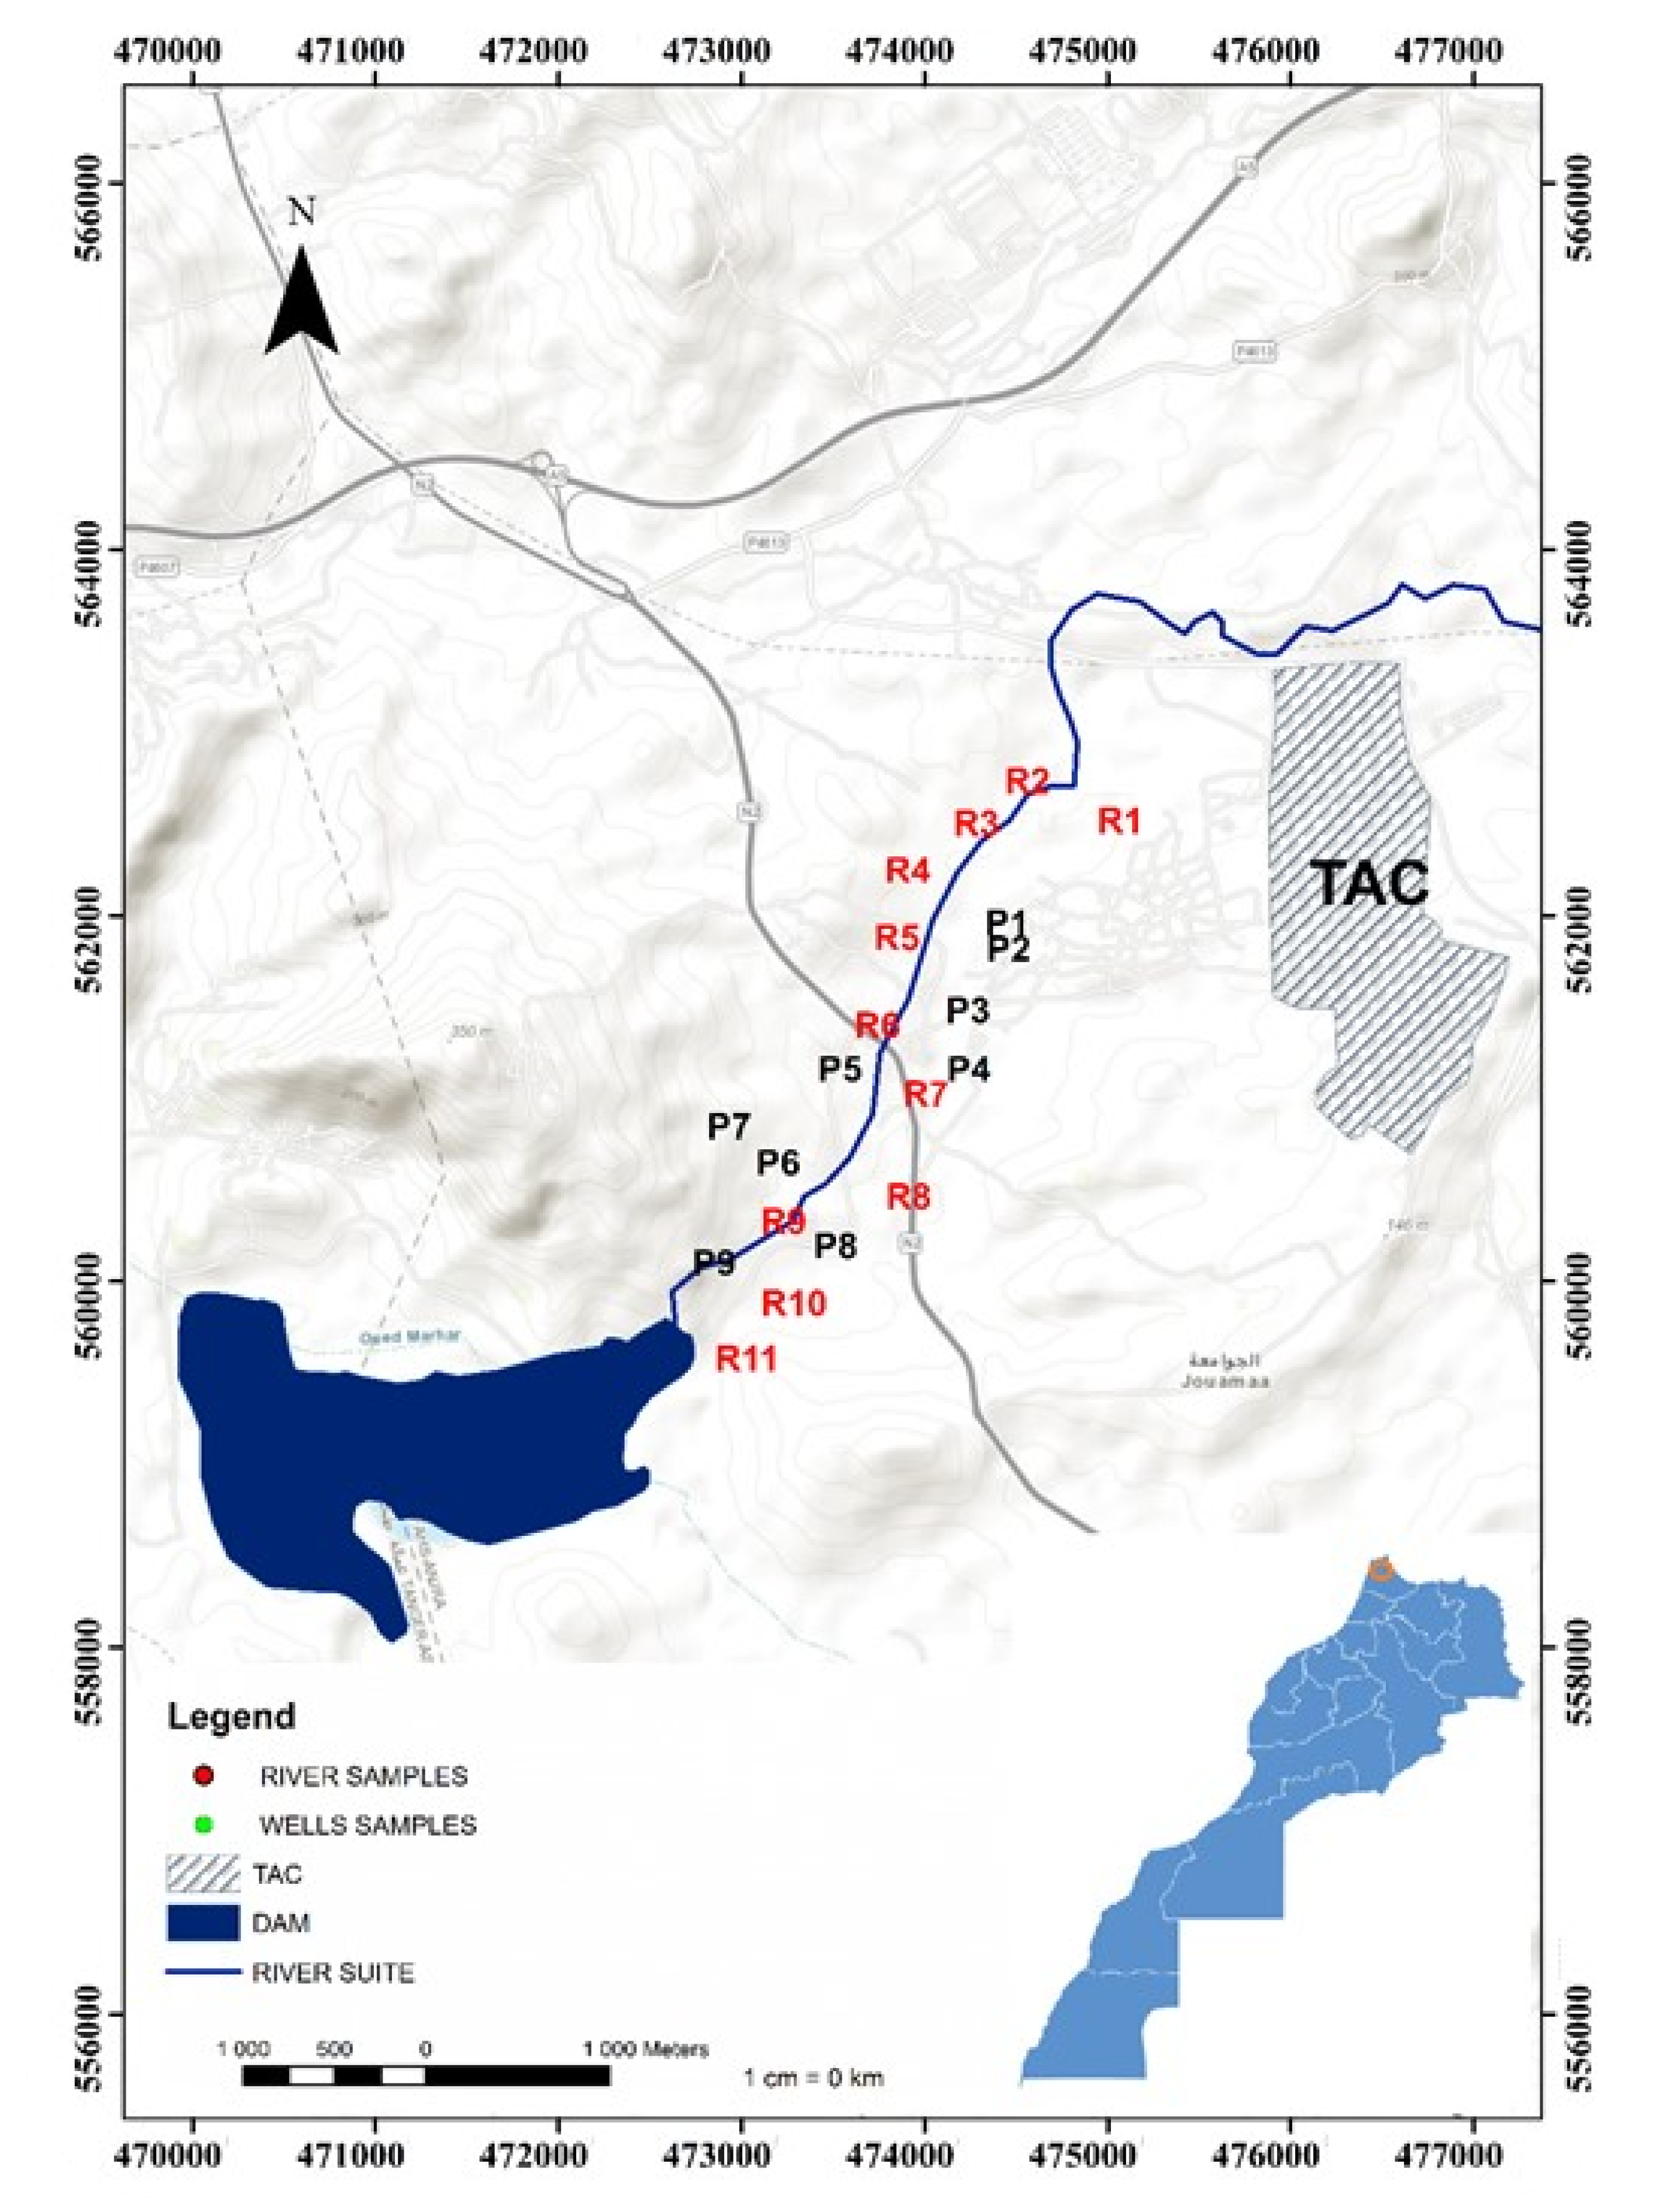
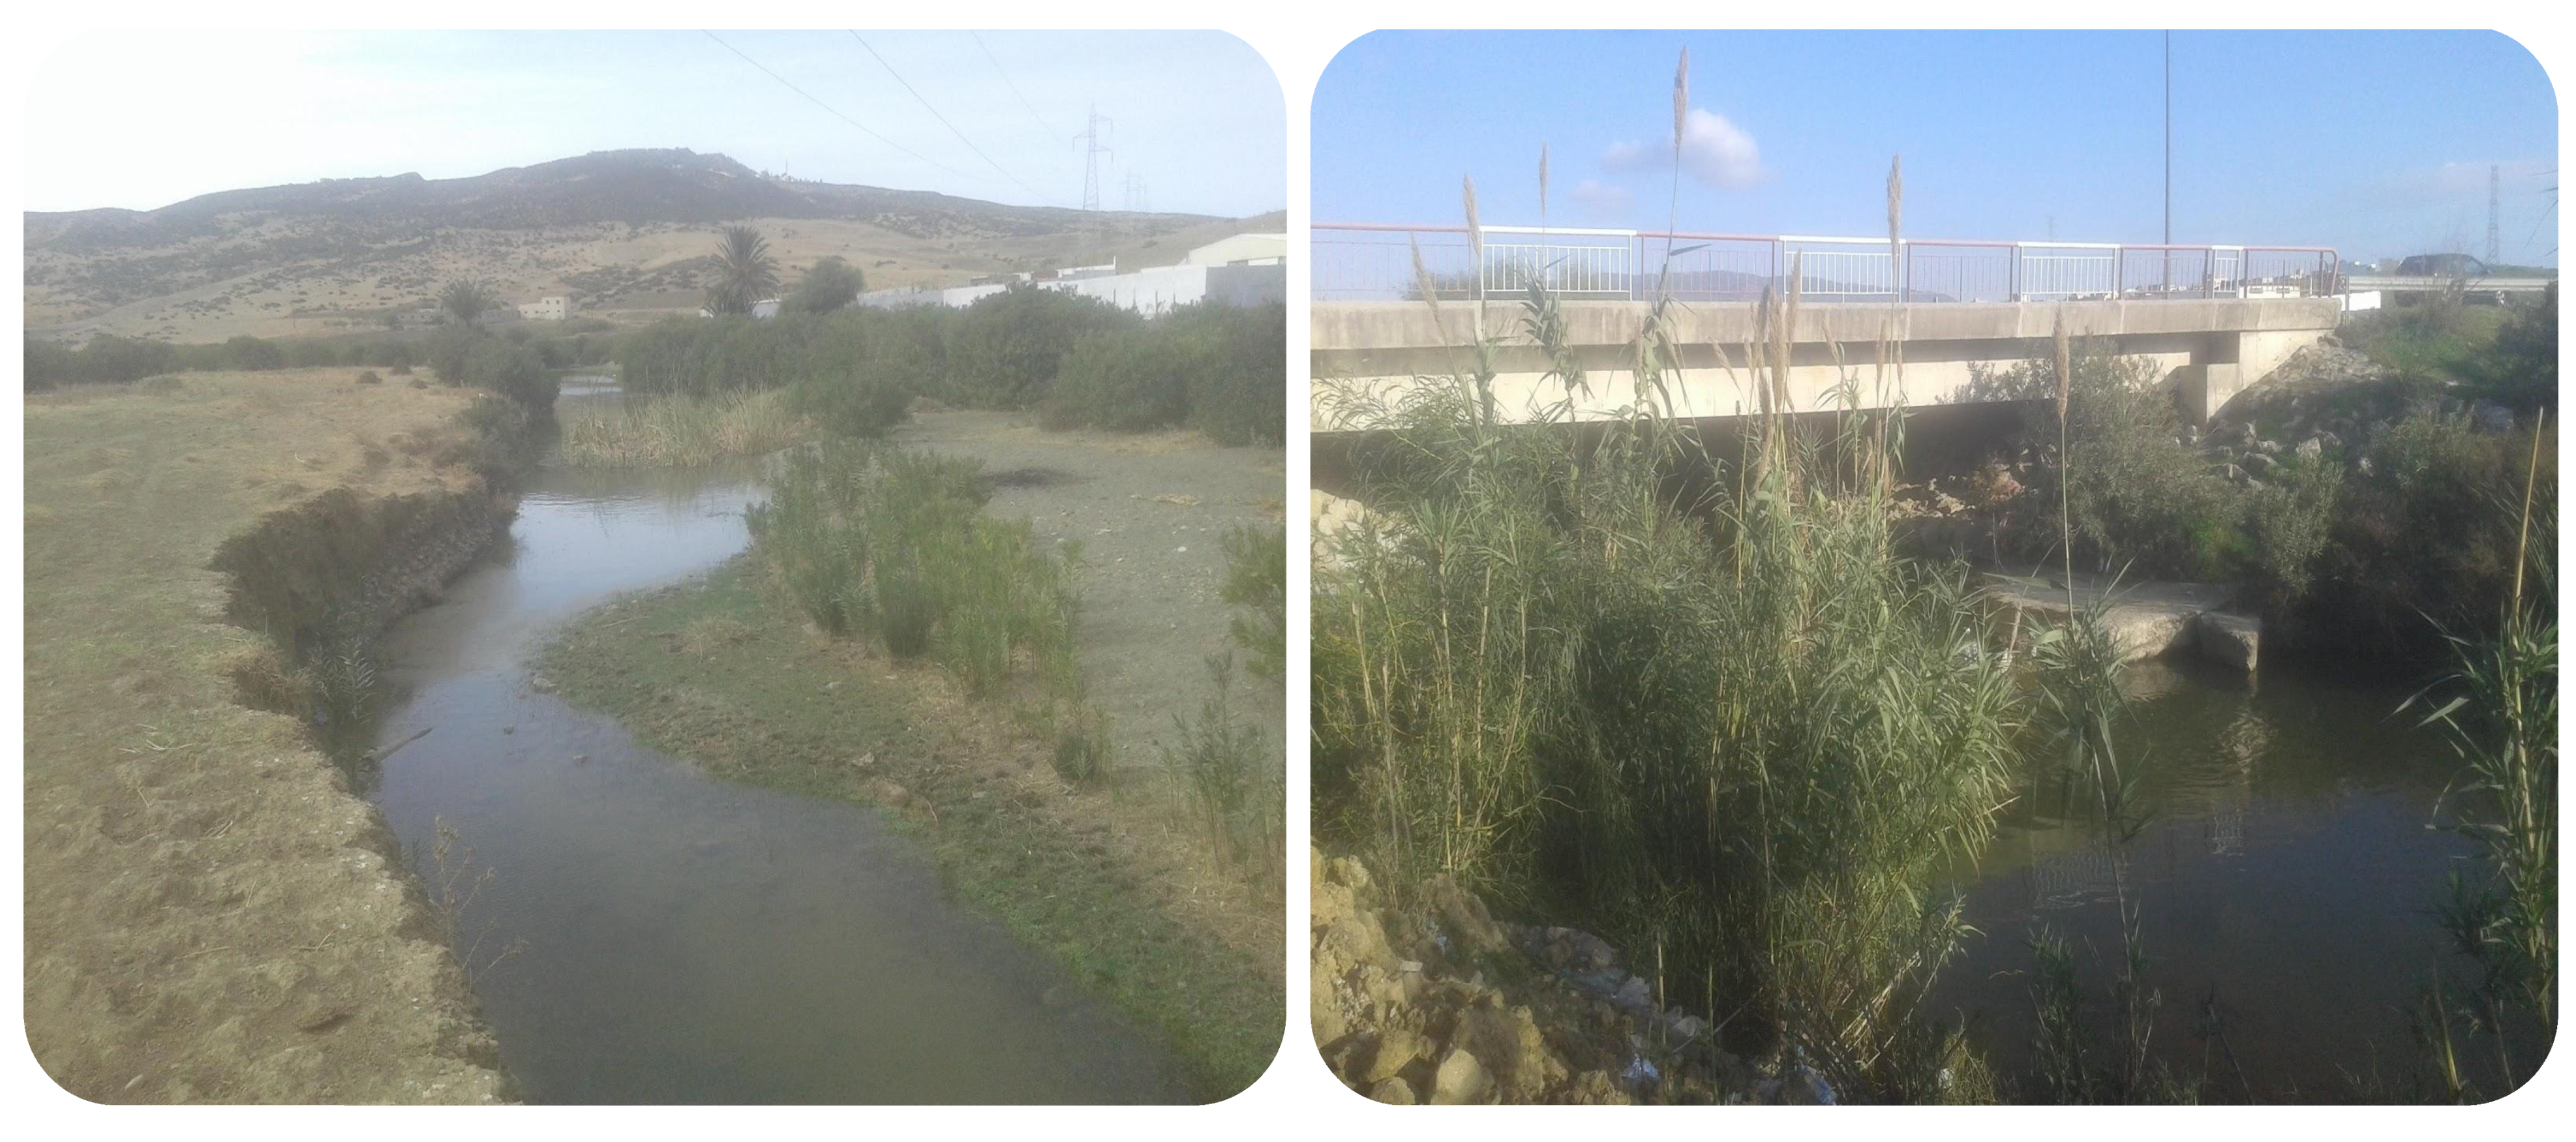
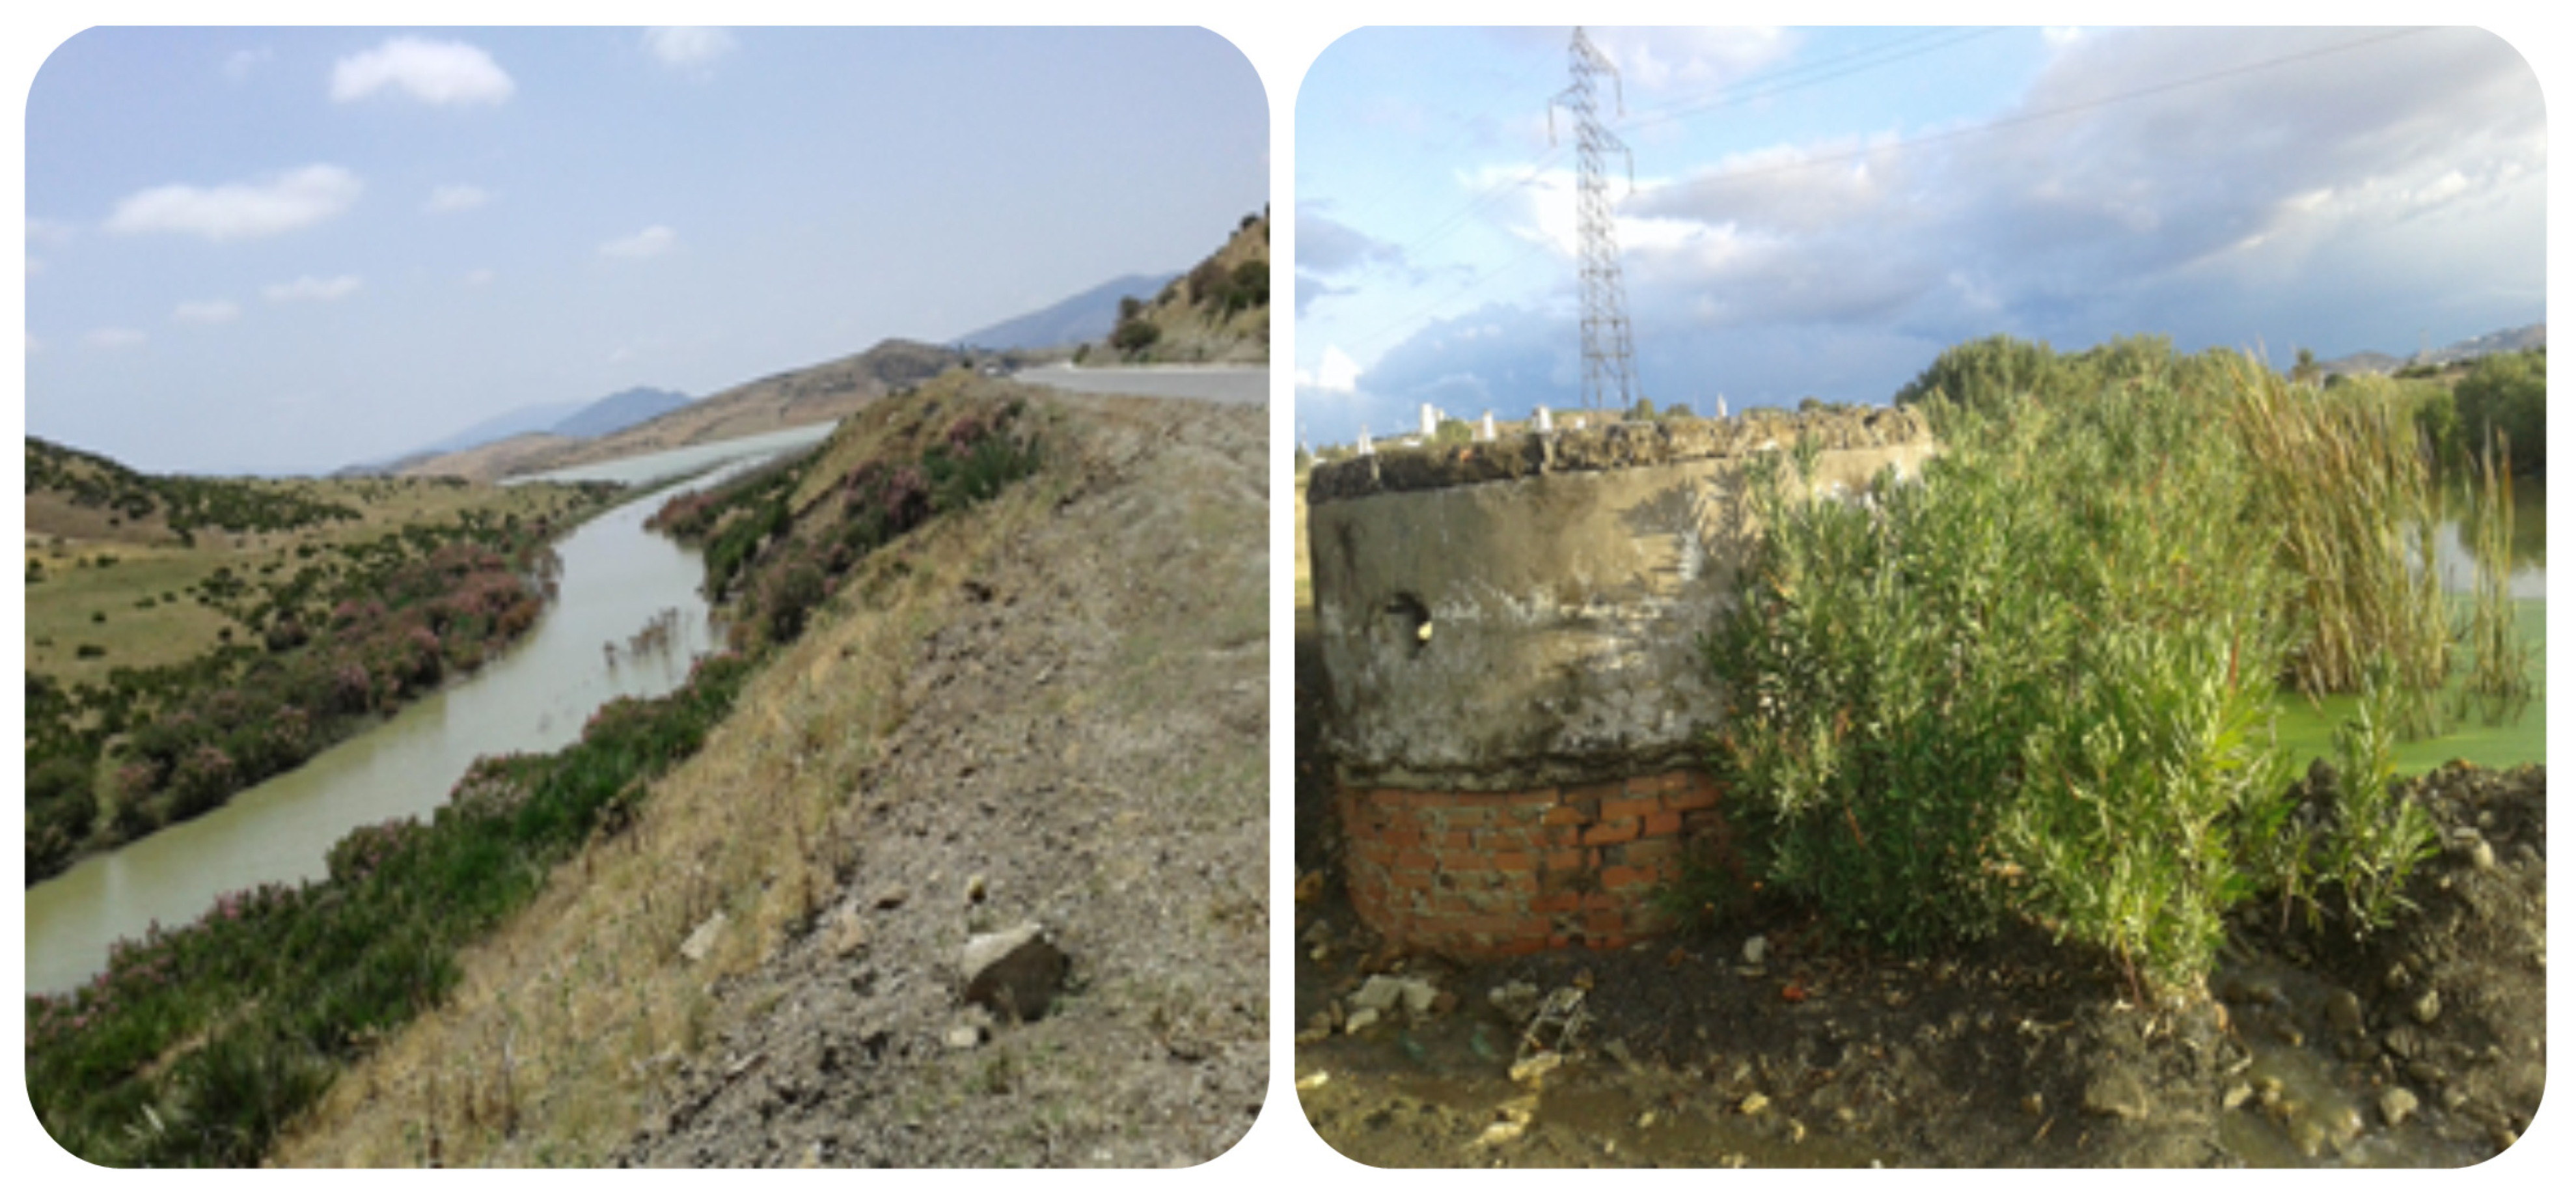
2.1. Study Area
2.2. Climate
2.3. Geology and Hydrogeology
2.4. Sampling, Laboratory Analysis and Analytical Method
2.5. Water Quality Index (WQI)
2.6. Water for Irrigation Use (IWQI)
2.7. Multivariate Statistical Analysis (MSA) and the Geological Information System (GIS)
3. Results and Discussion
3.1. Hydrochemical Data Correlation
3.2. Hydrochemical Modeling
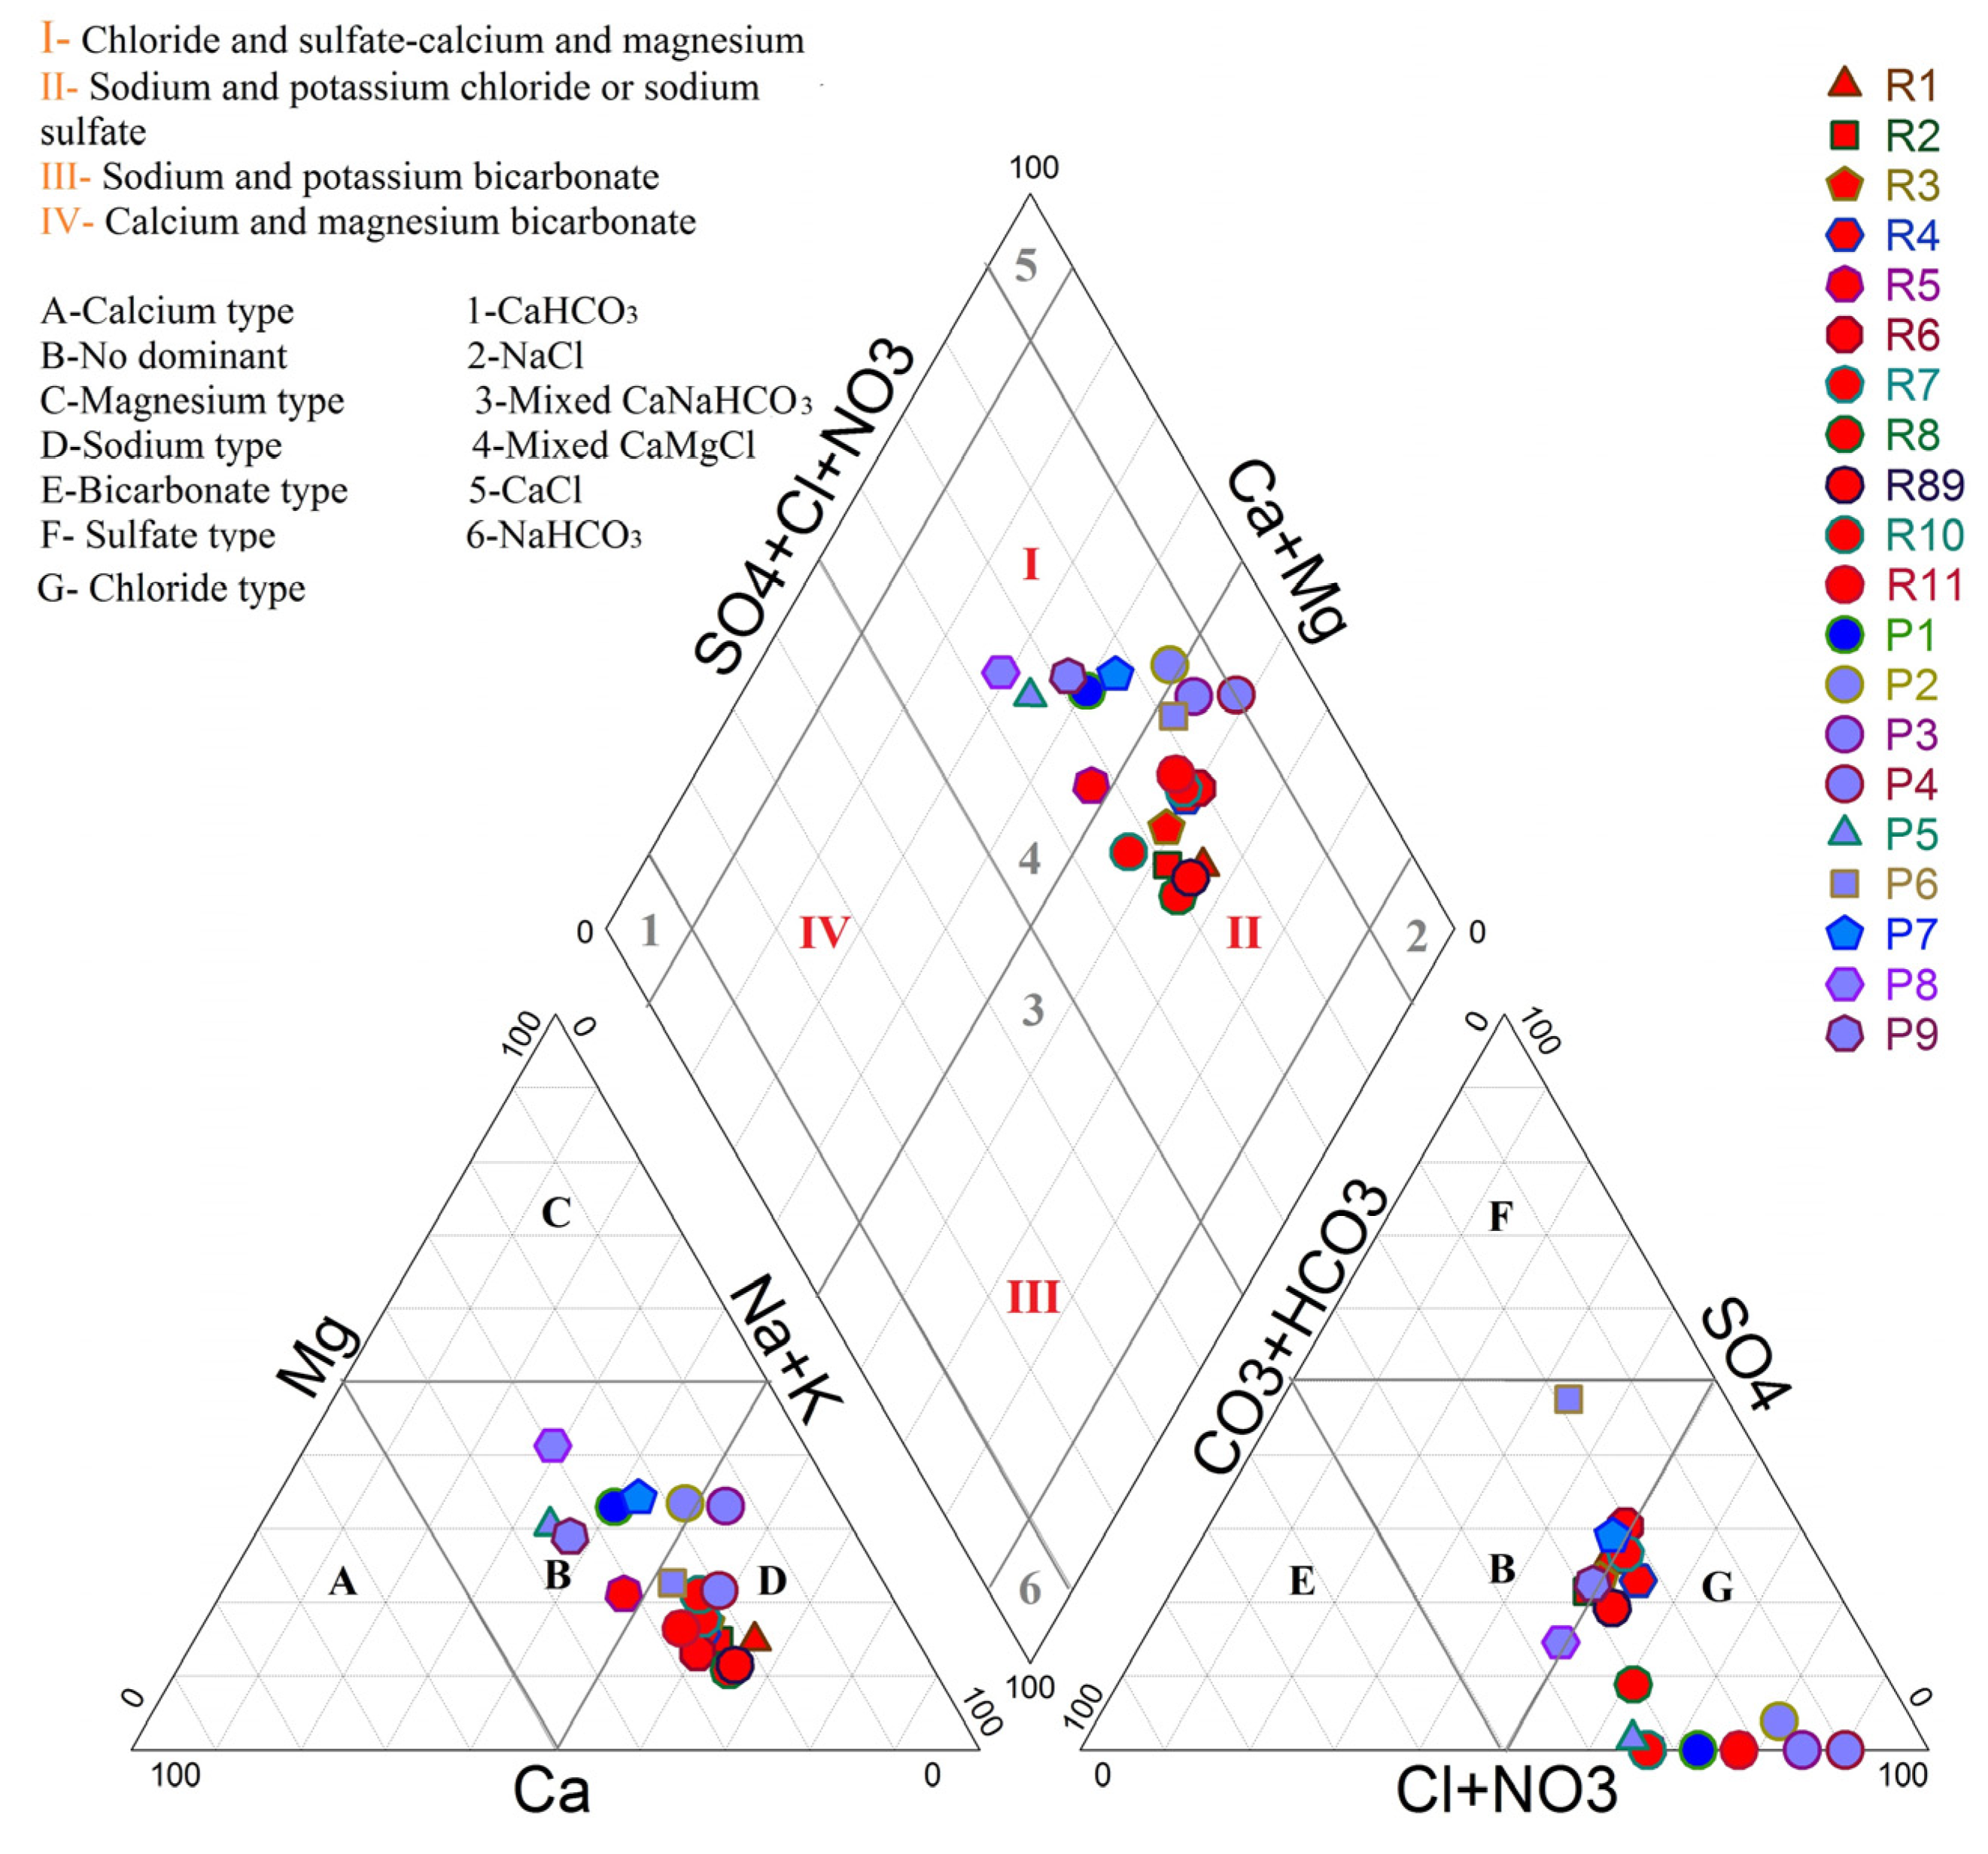
3.2.1. Hydrochemical Facies Using Piper Diagram
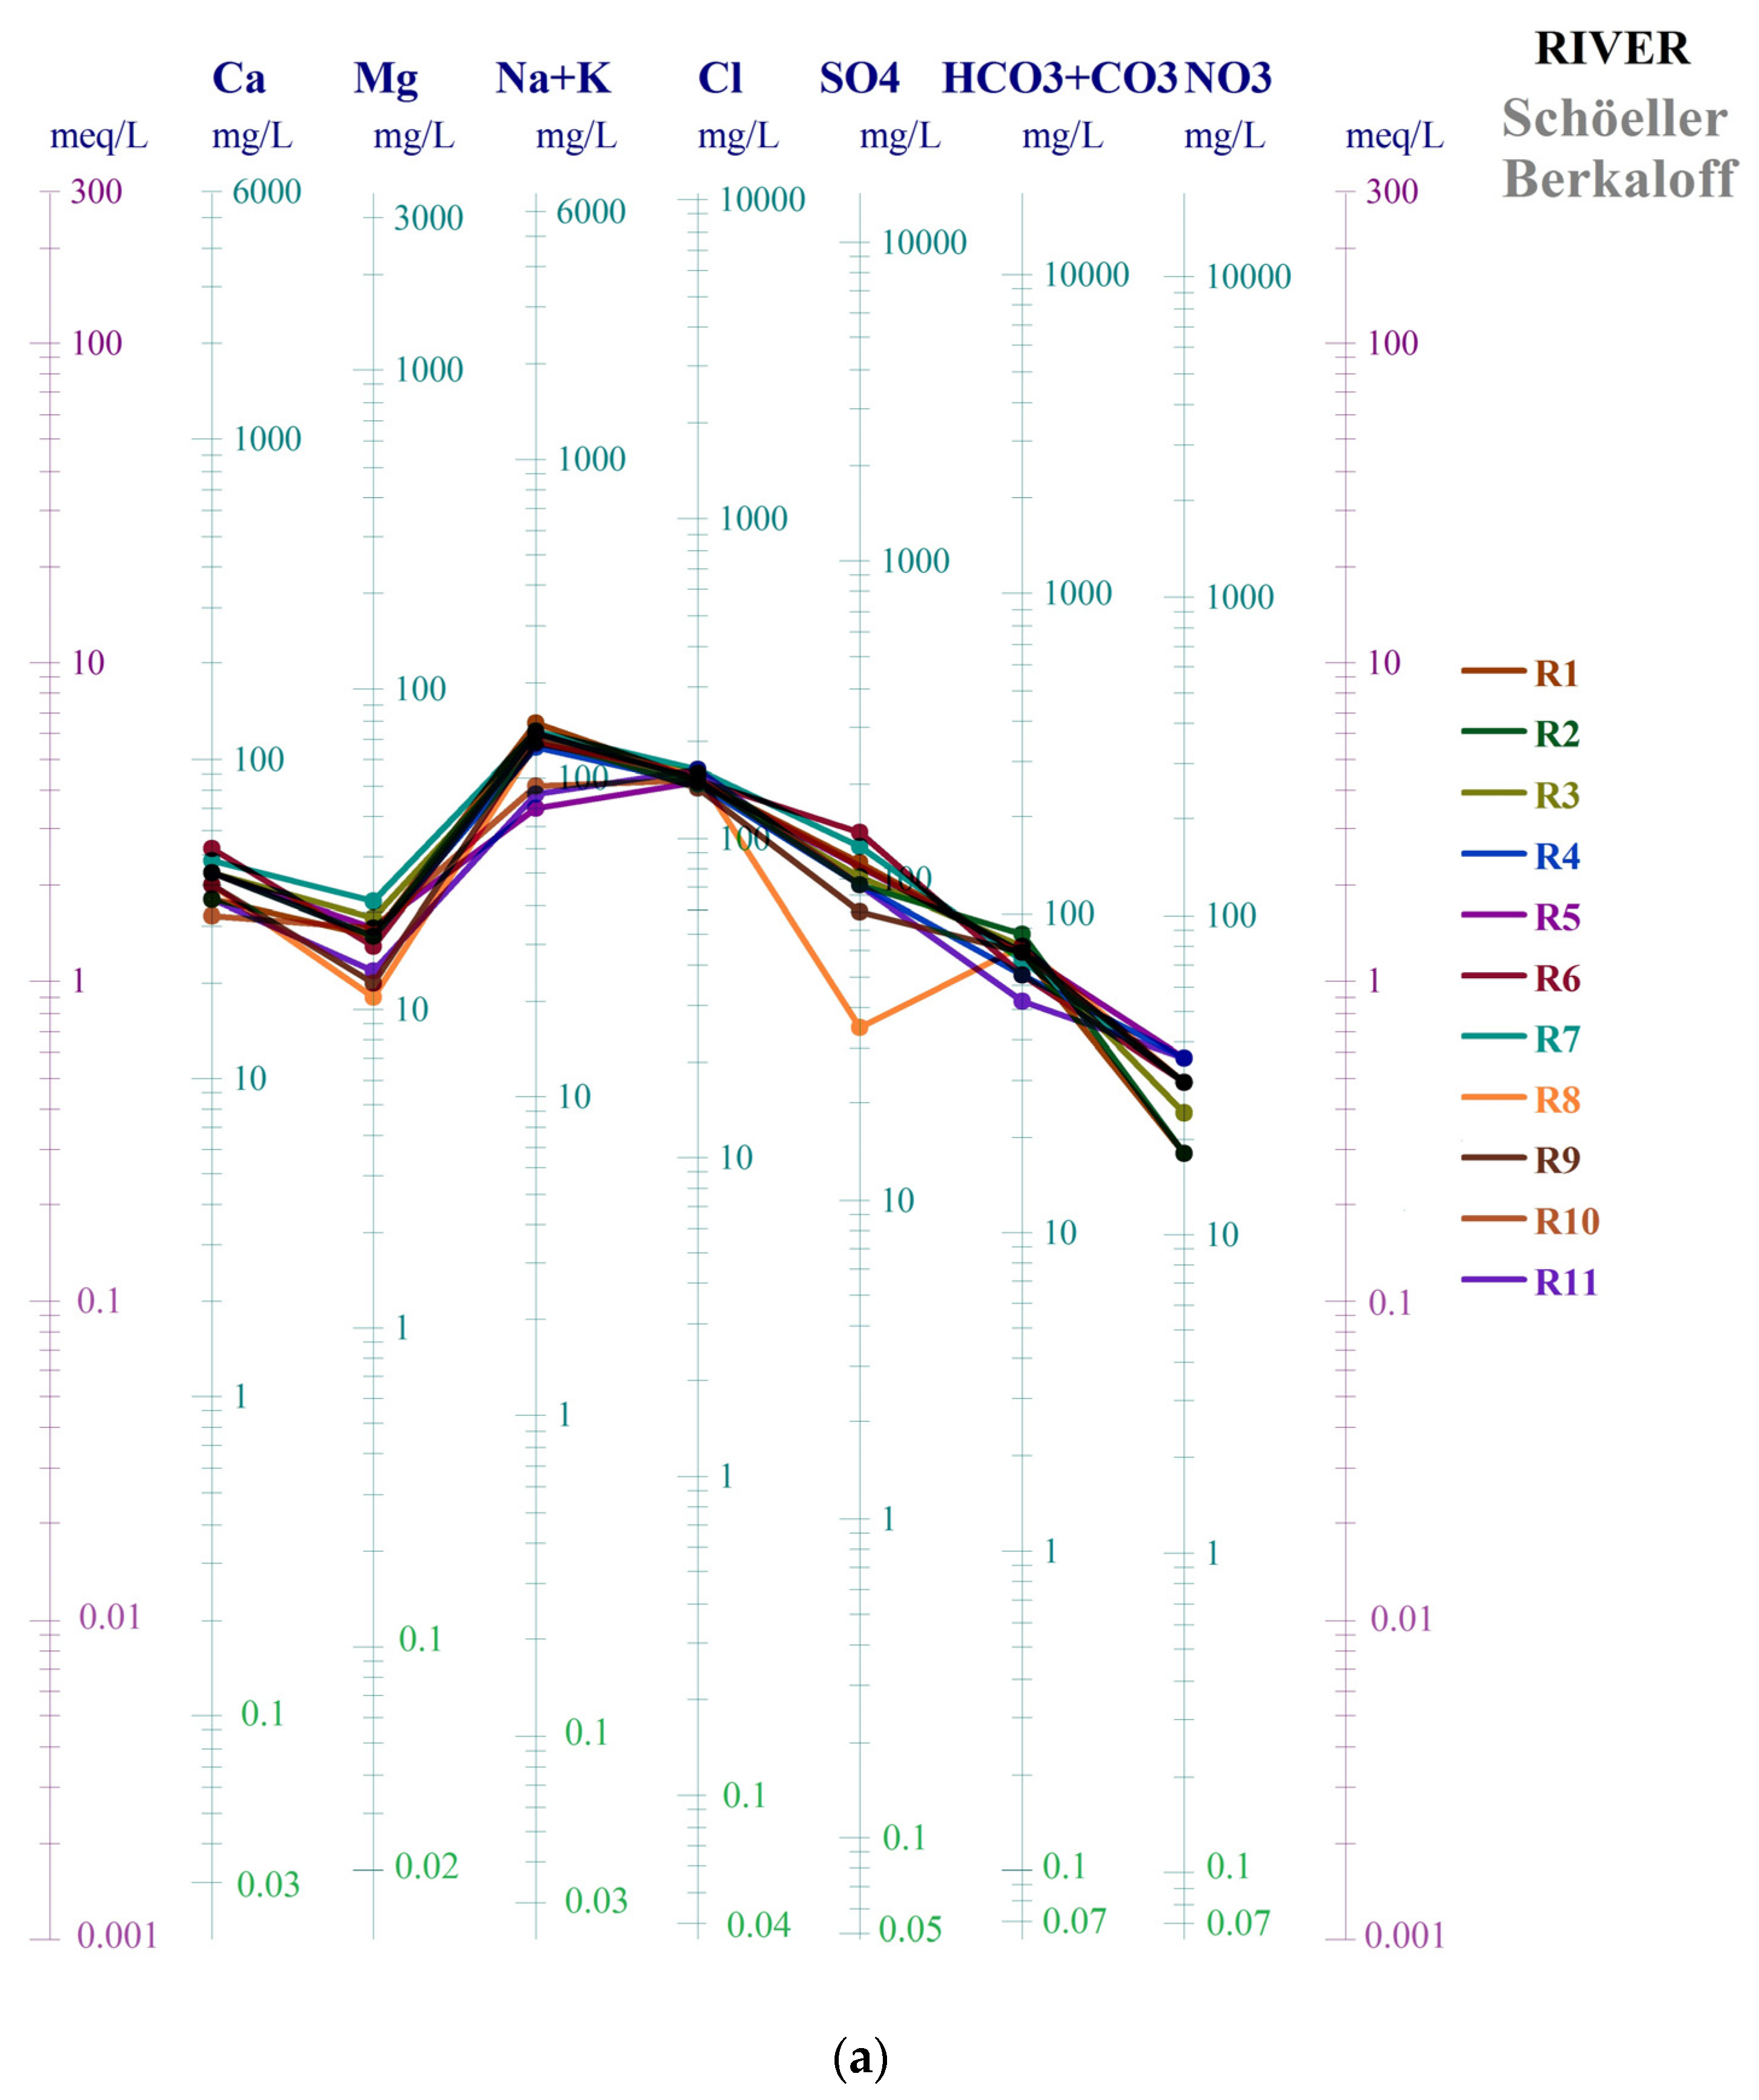
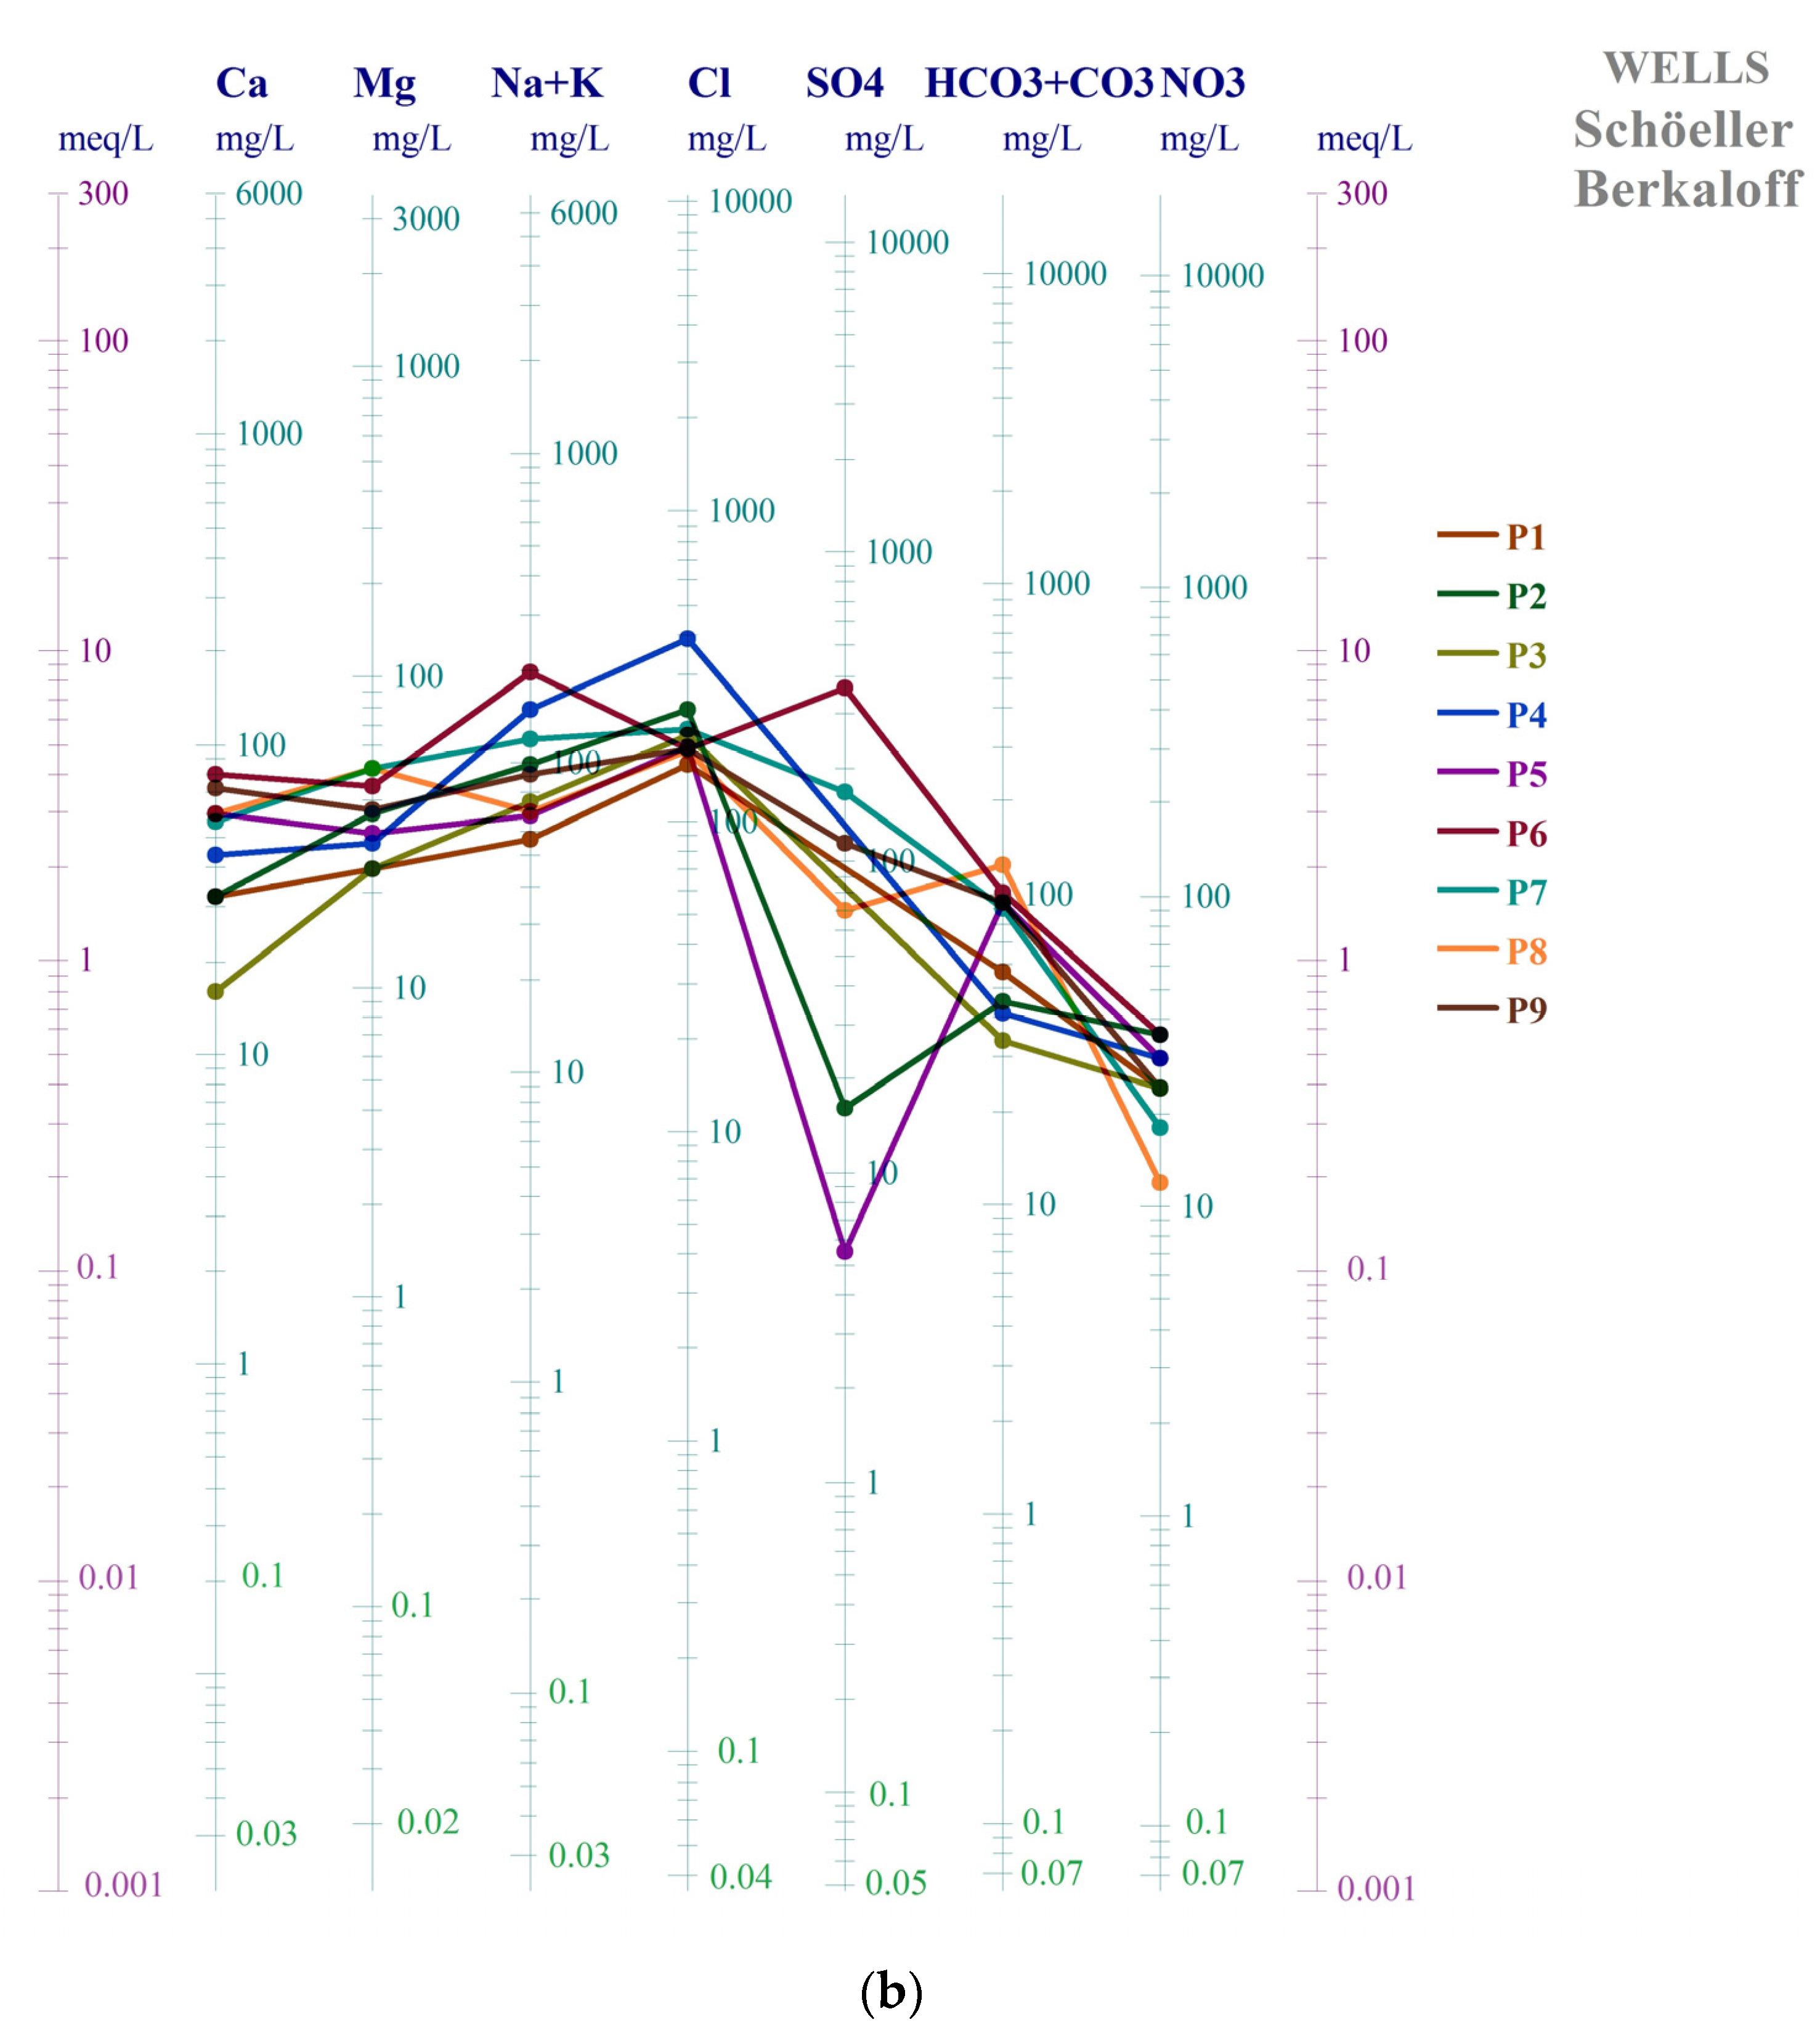
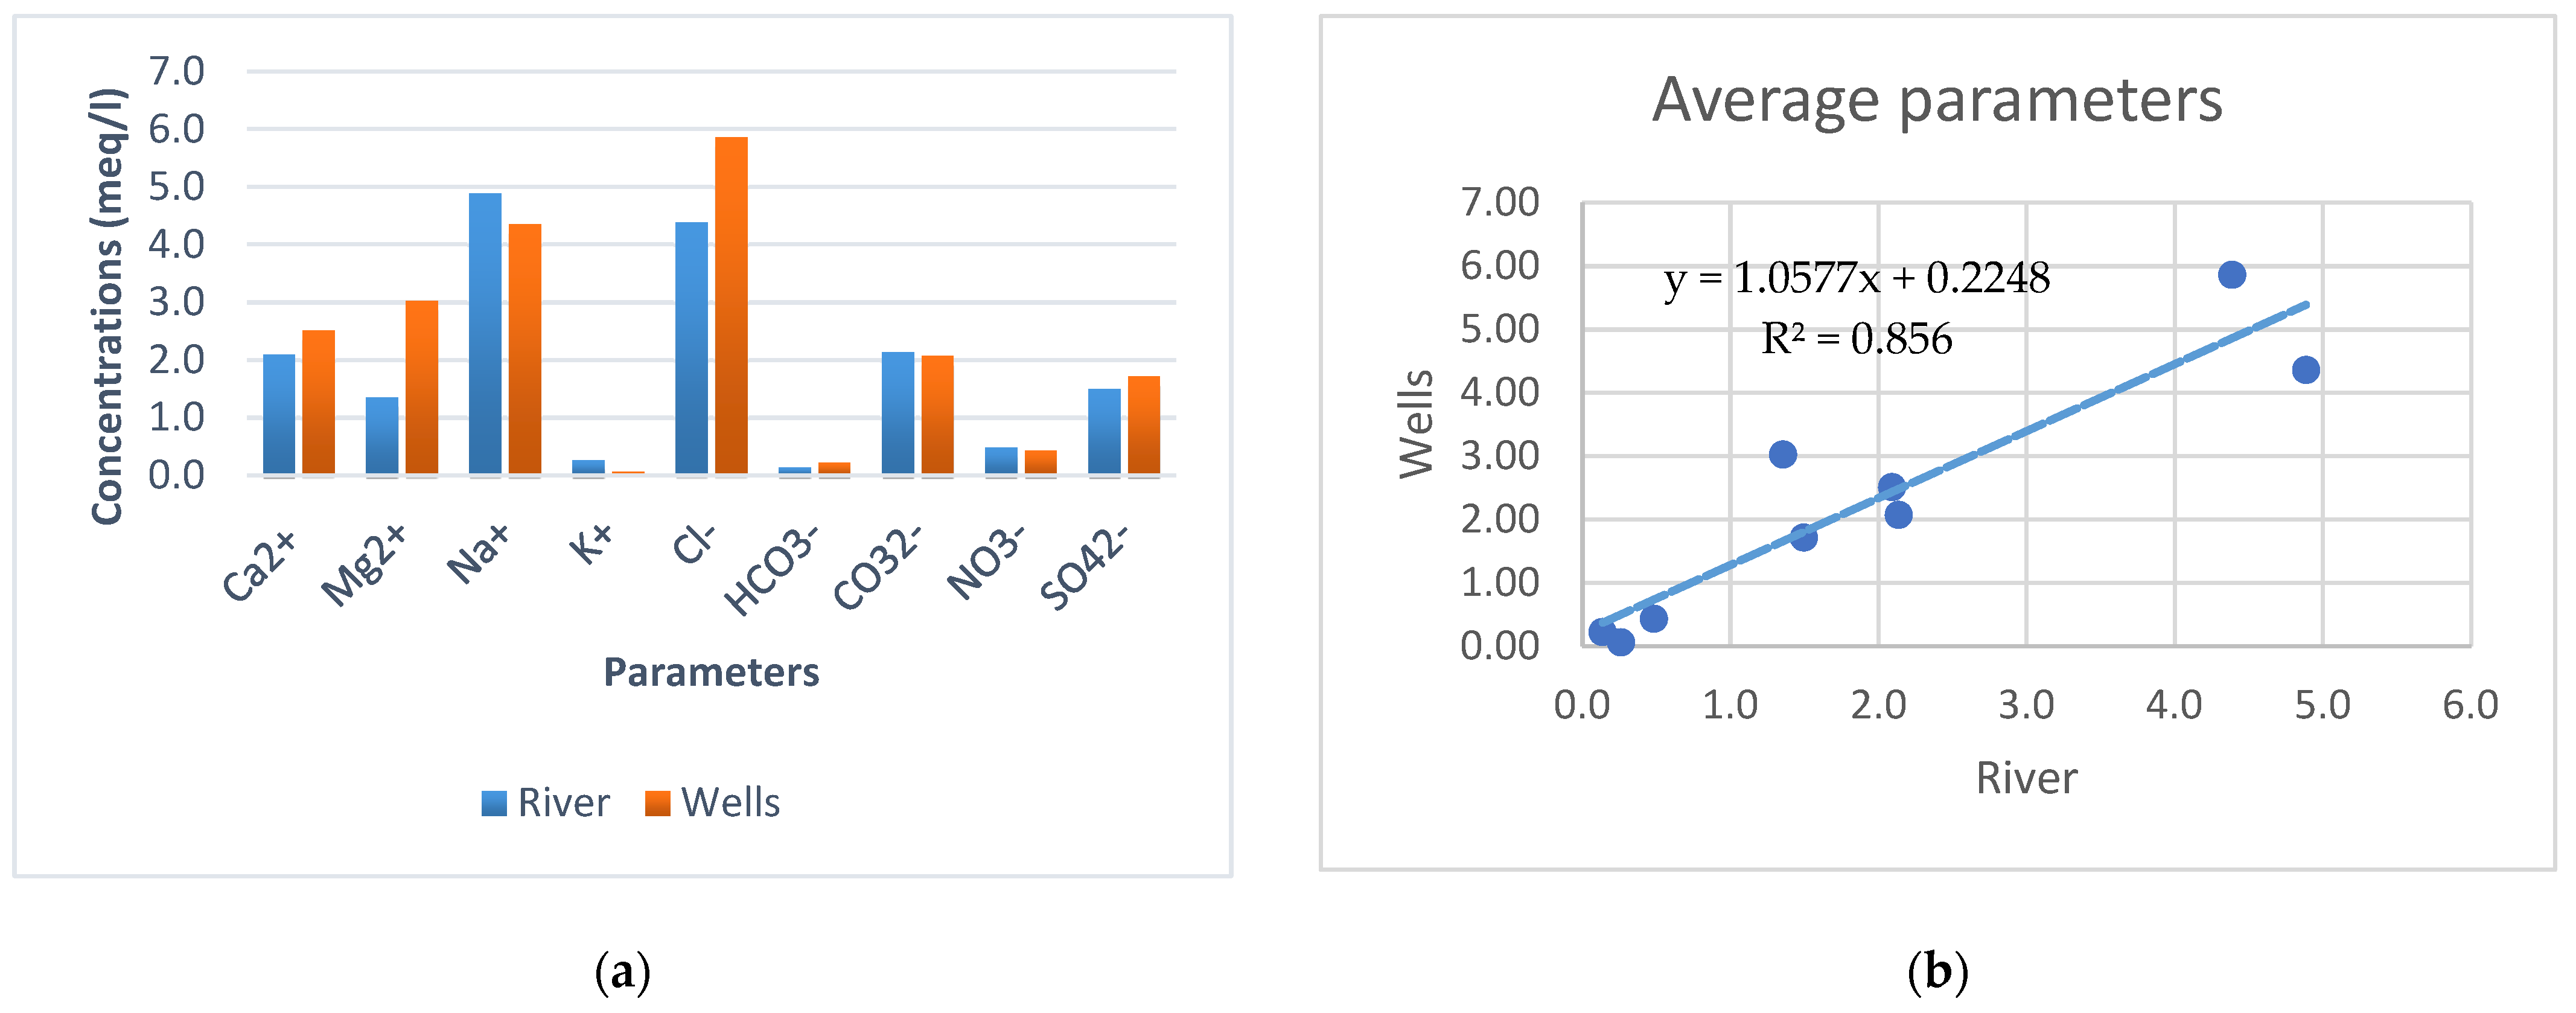
3.2.2. Water Samples Schöeller Berkaloff Diagram and Schöeller Berkaloff Diagram for Average Parameters
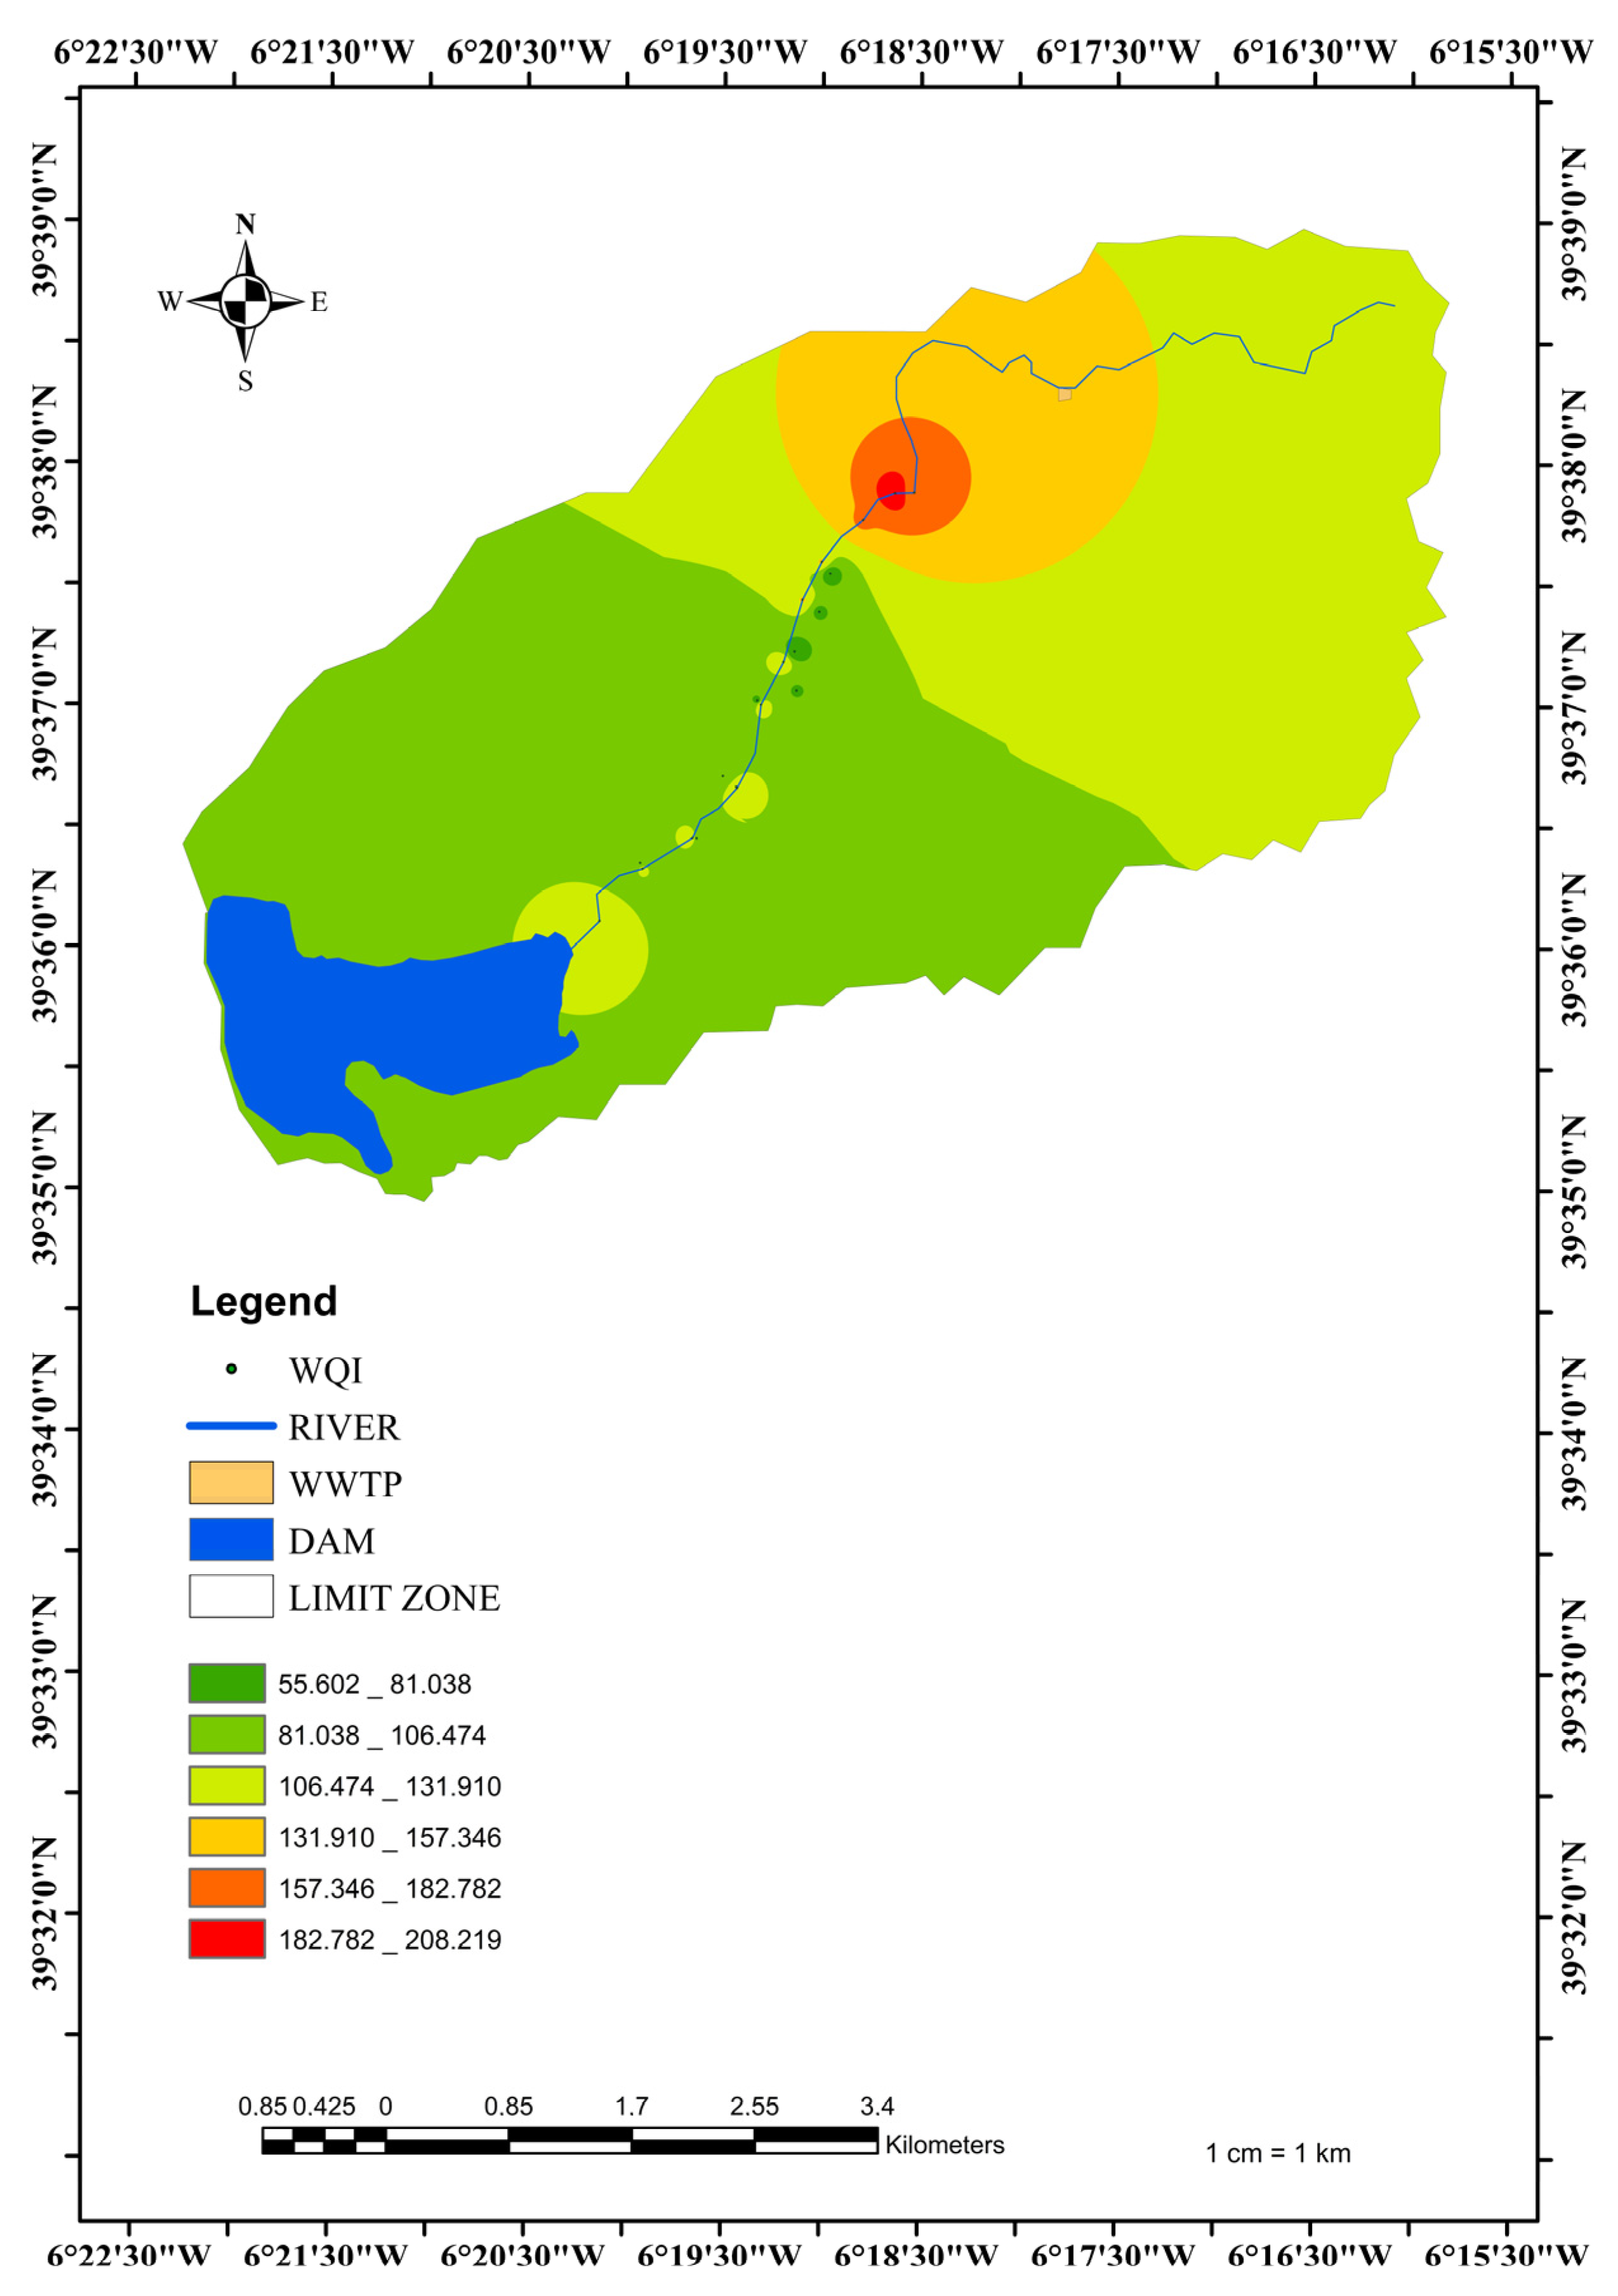
3.3. Groundwater Quality Index (GWQI) and Surface Water Quality Index (SWQI)
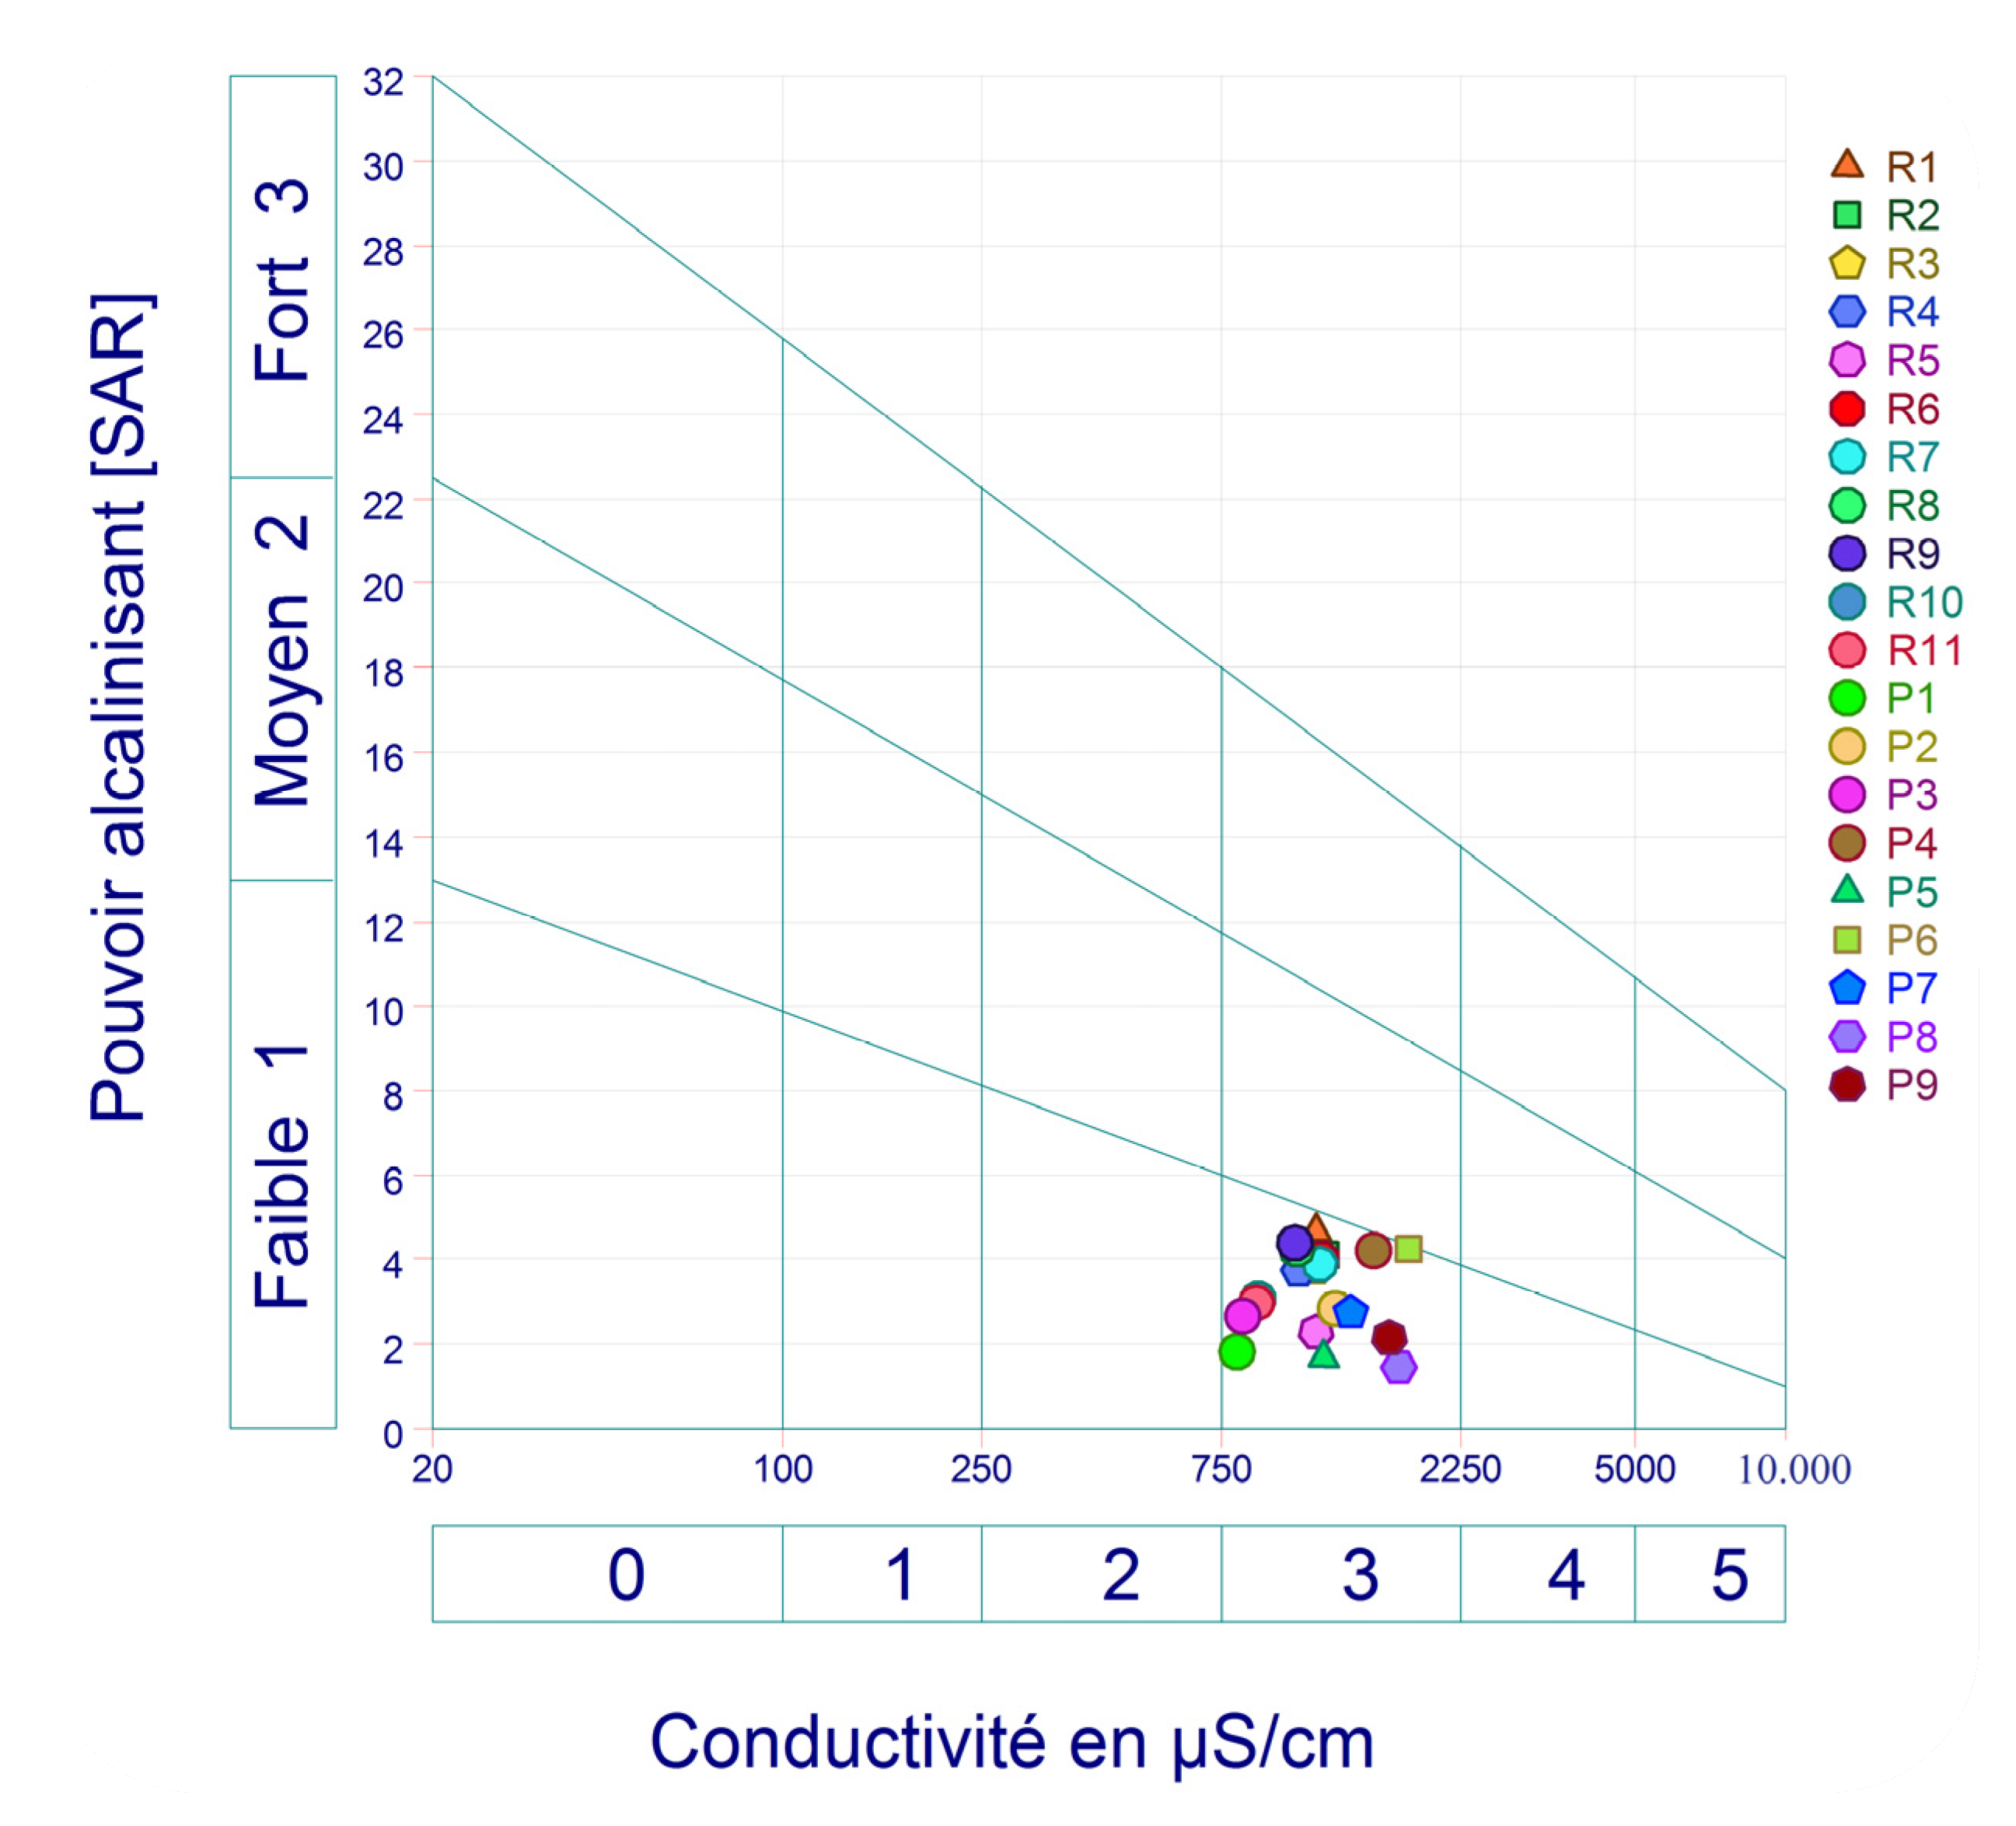
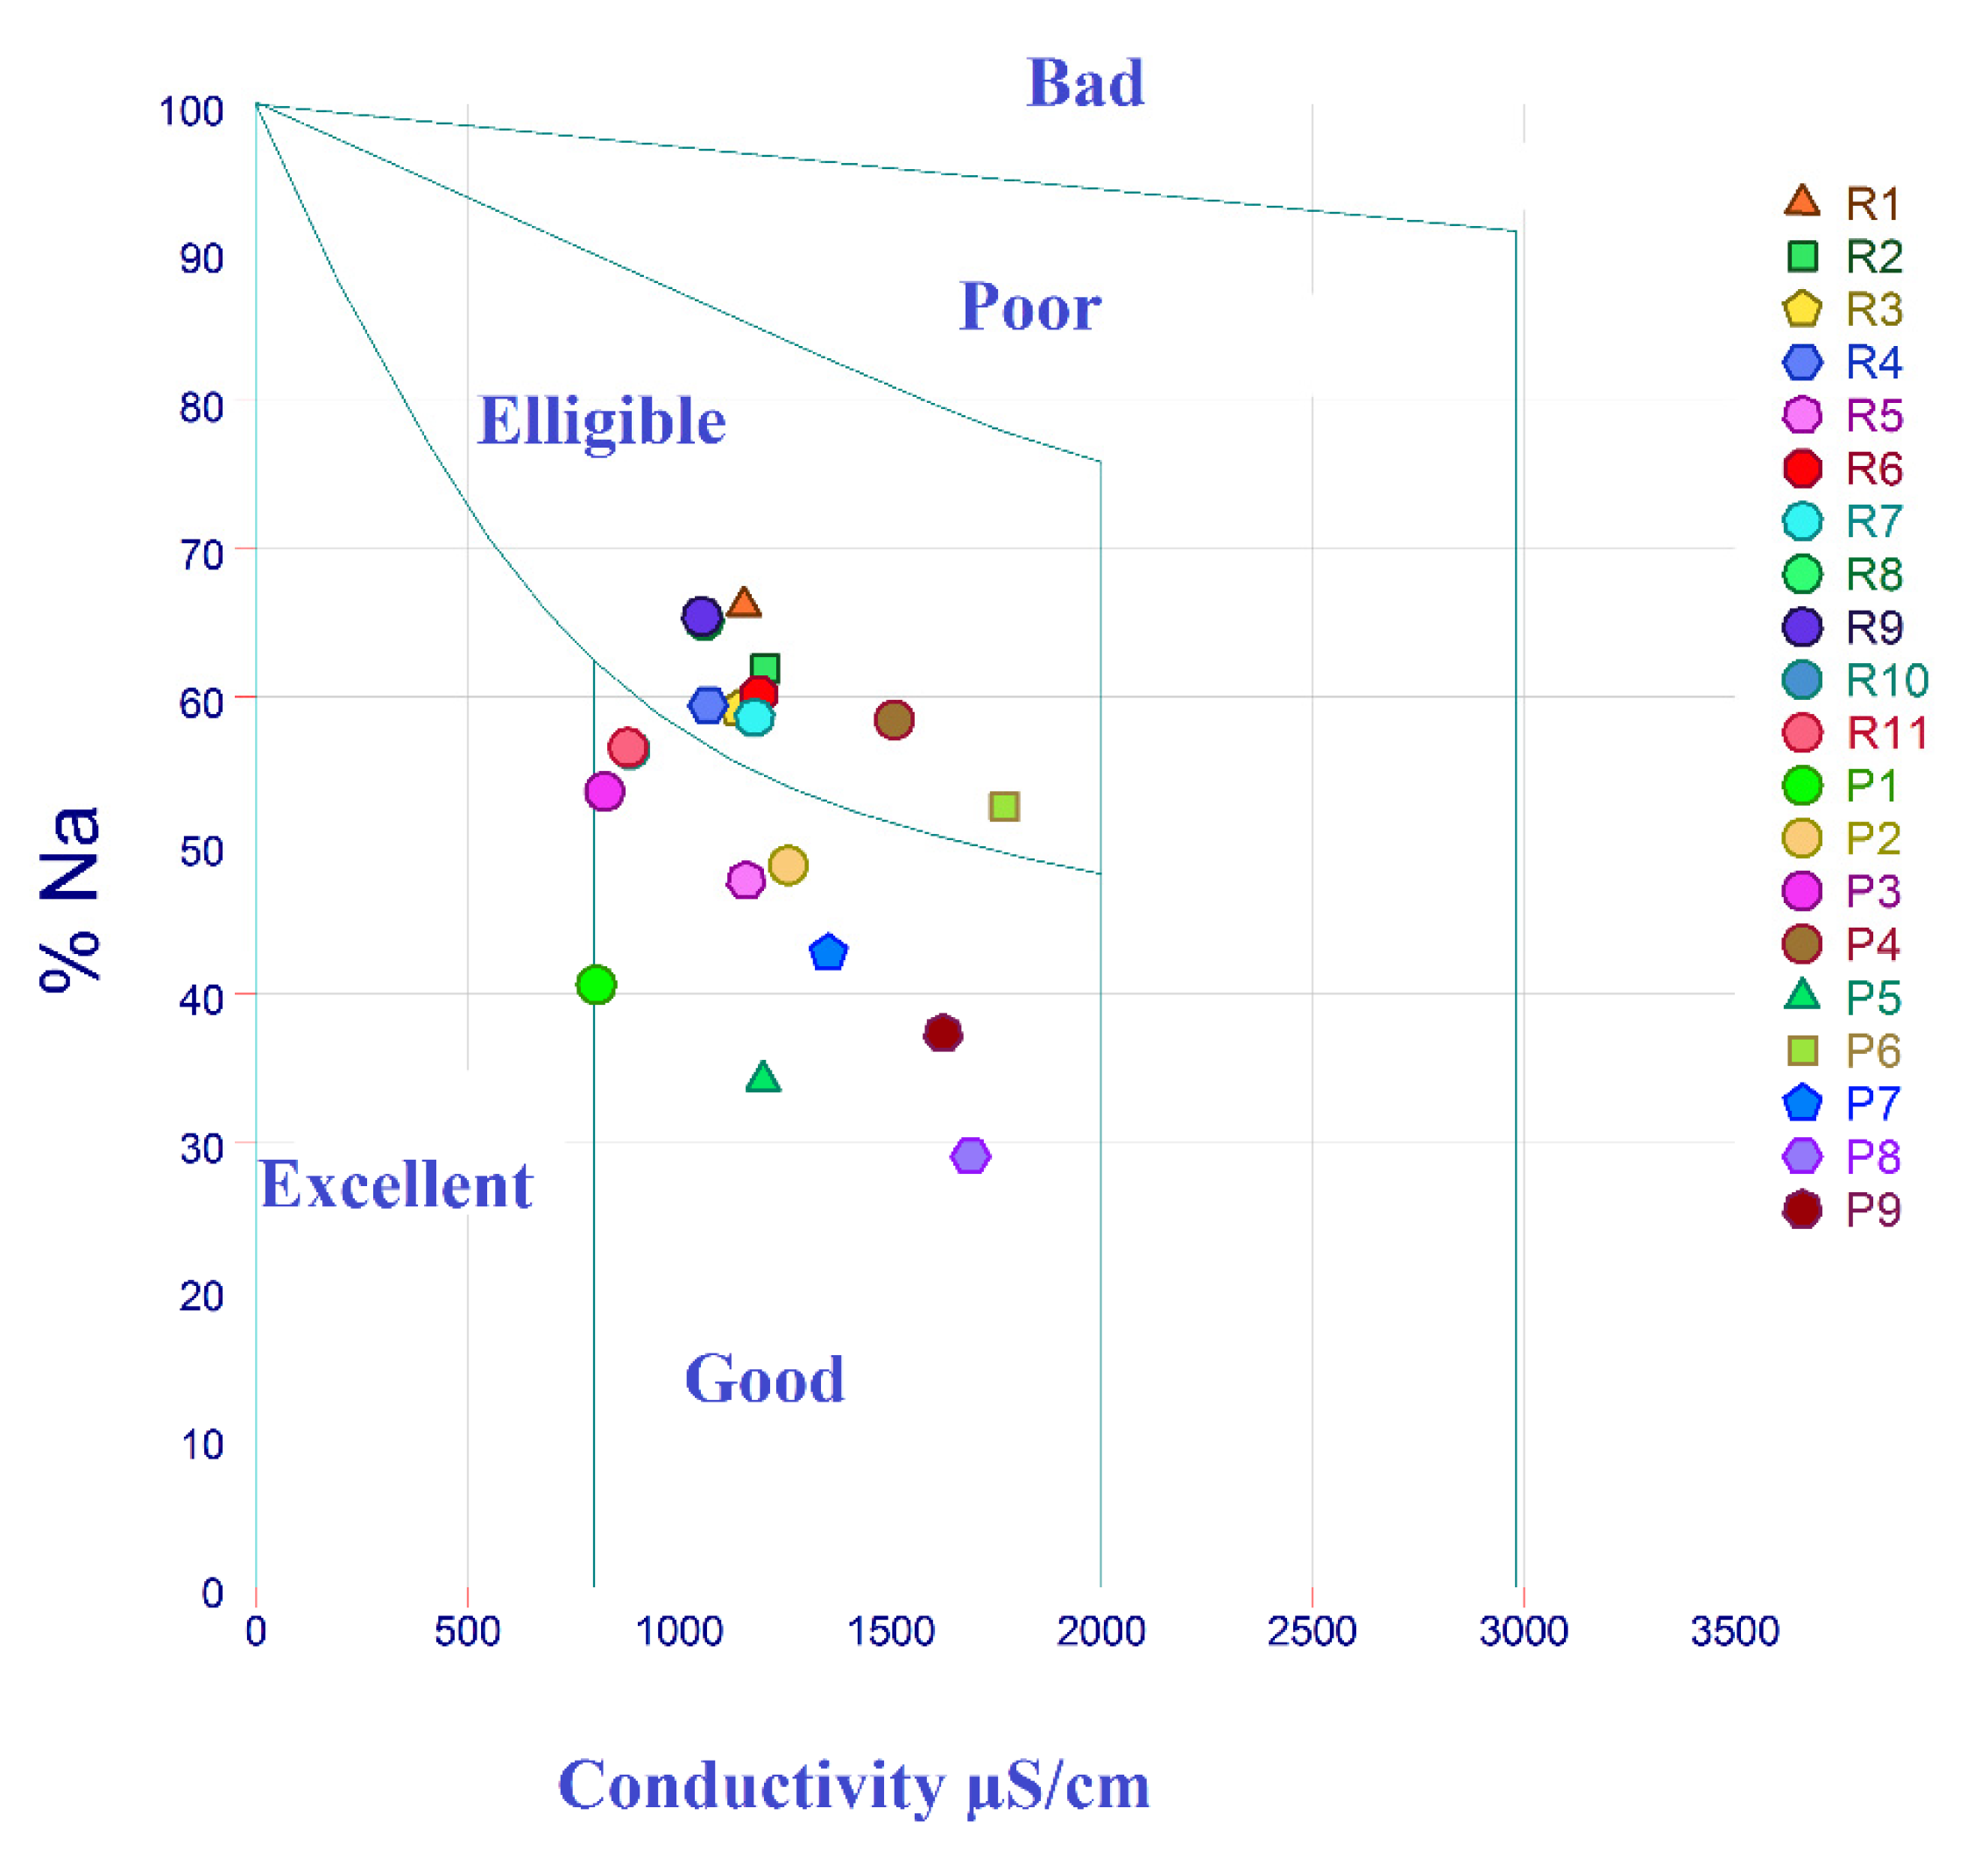
3.4. Irrigation Groundwater Water Quality (IGWQI) and Irrigation Water Quality of Surface Water (ISWQI)
3.5. Multivariate Statistical Analysis
3.5.1. Statistical Analysis (PCA)
3.5.2. Pearson’s Coefficient of Correlation (r)
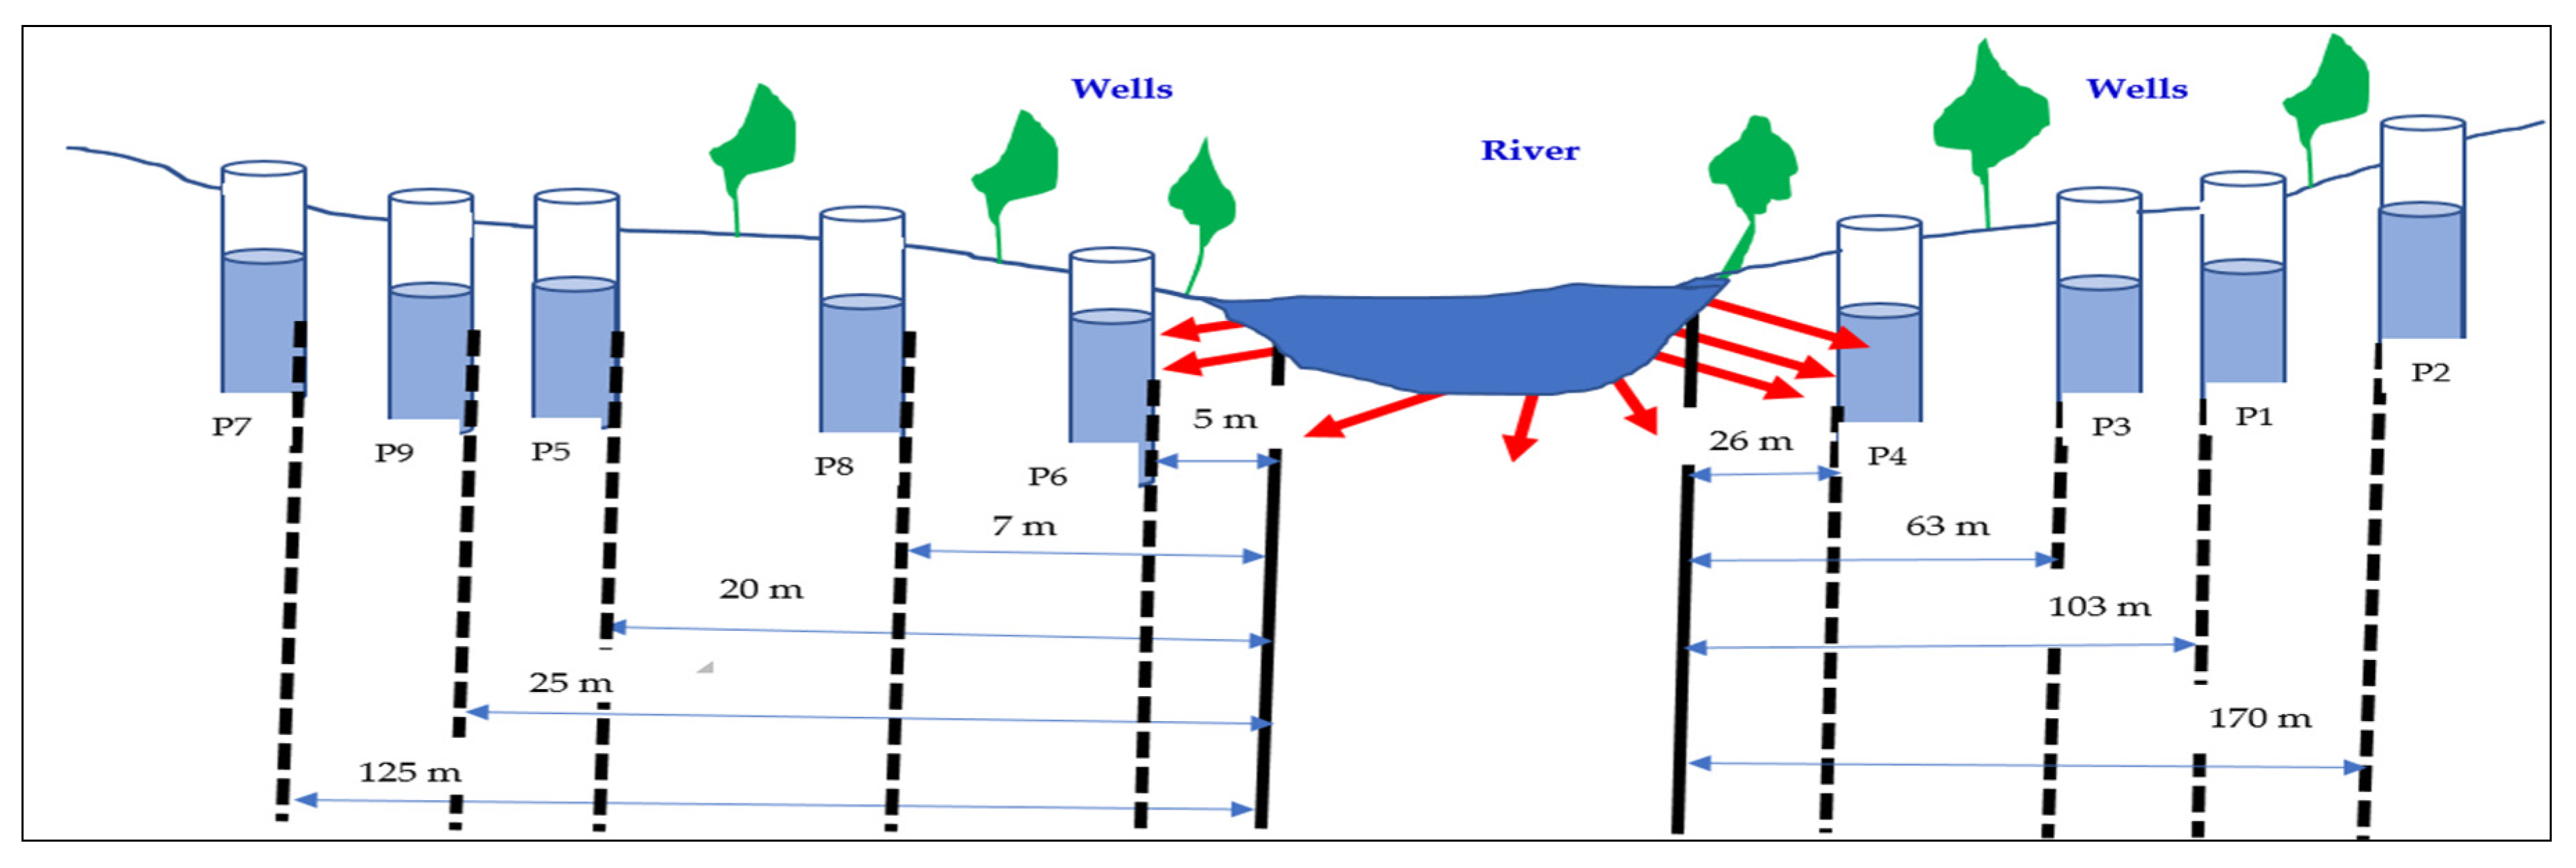
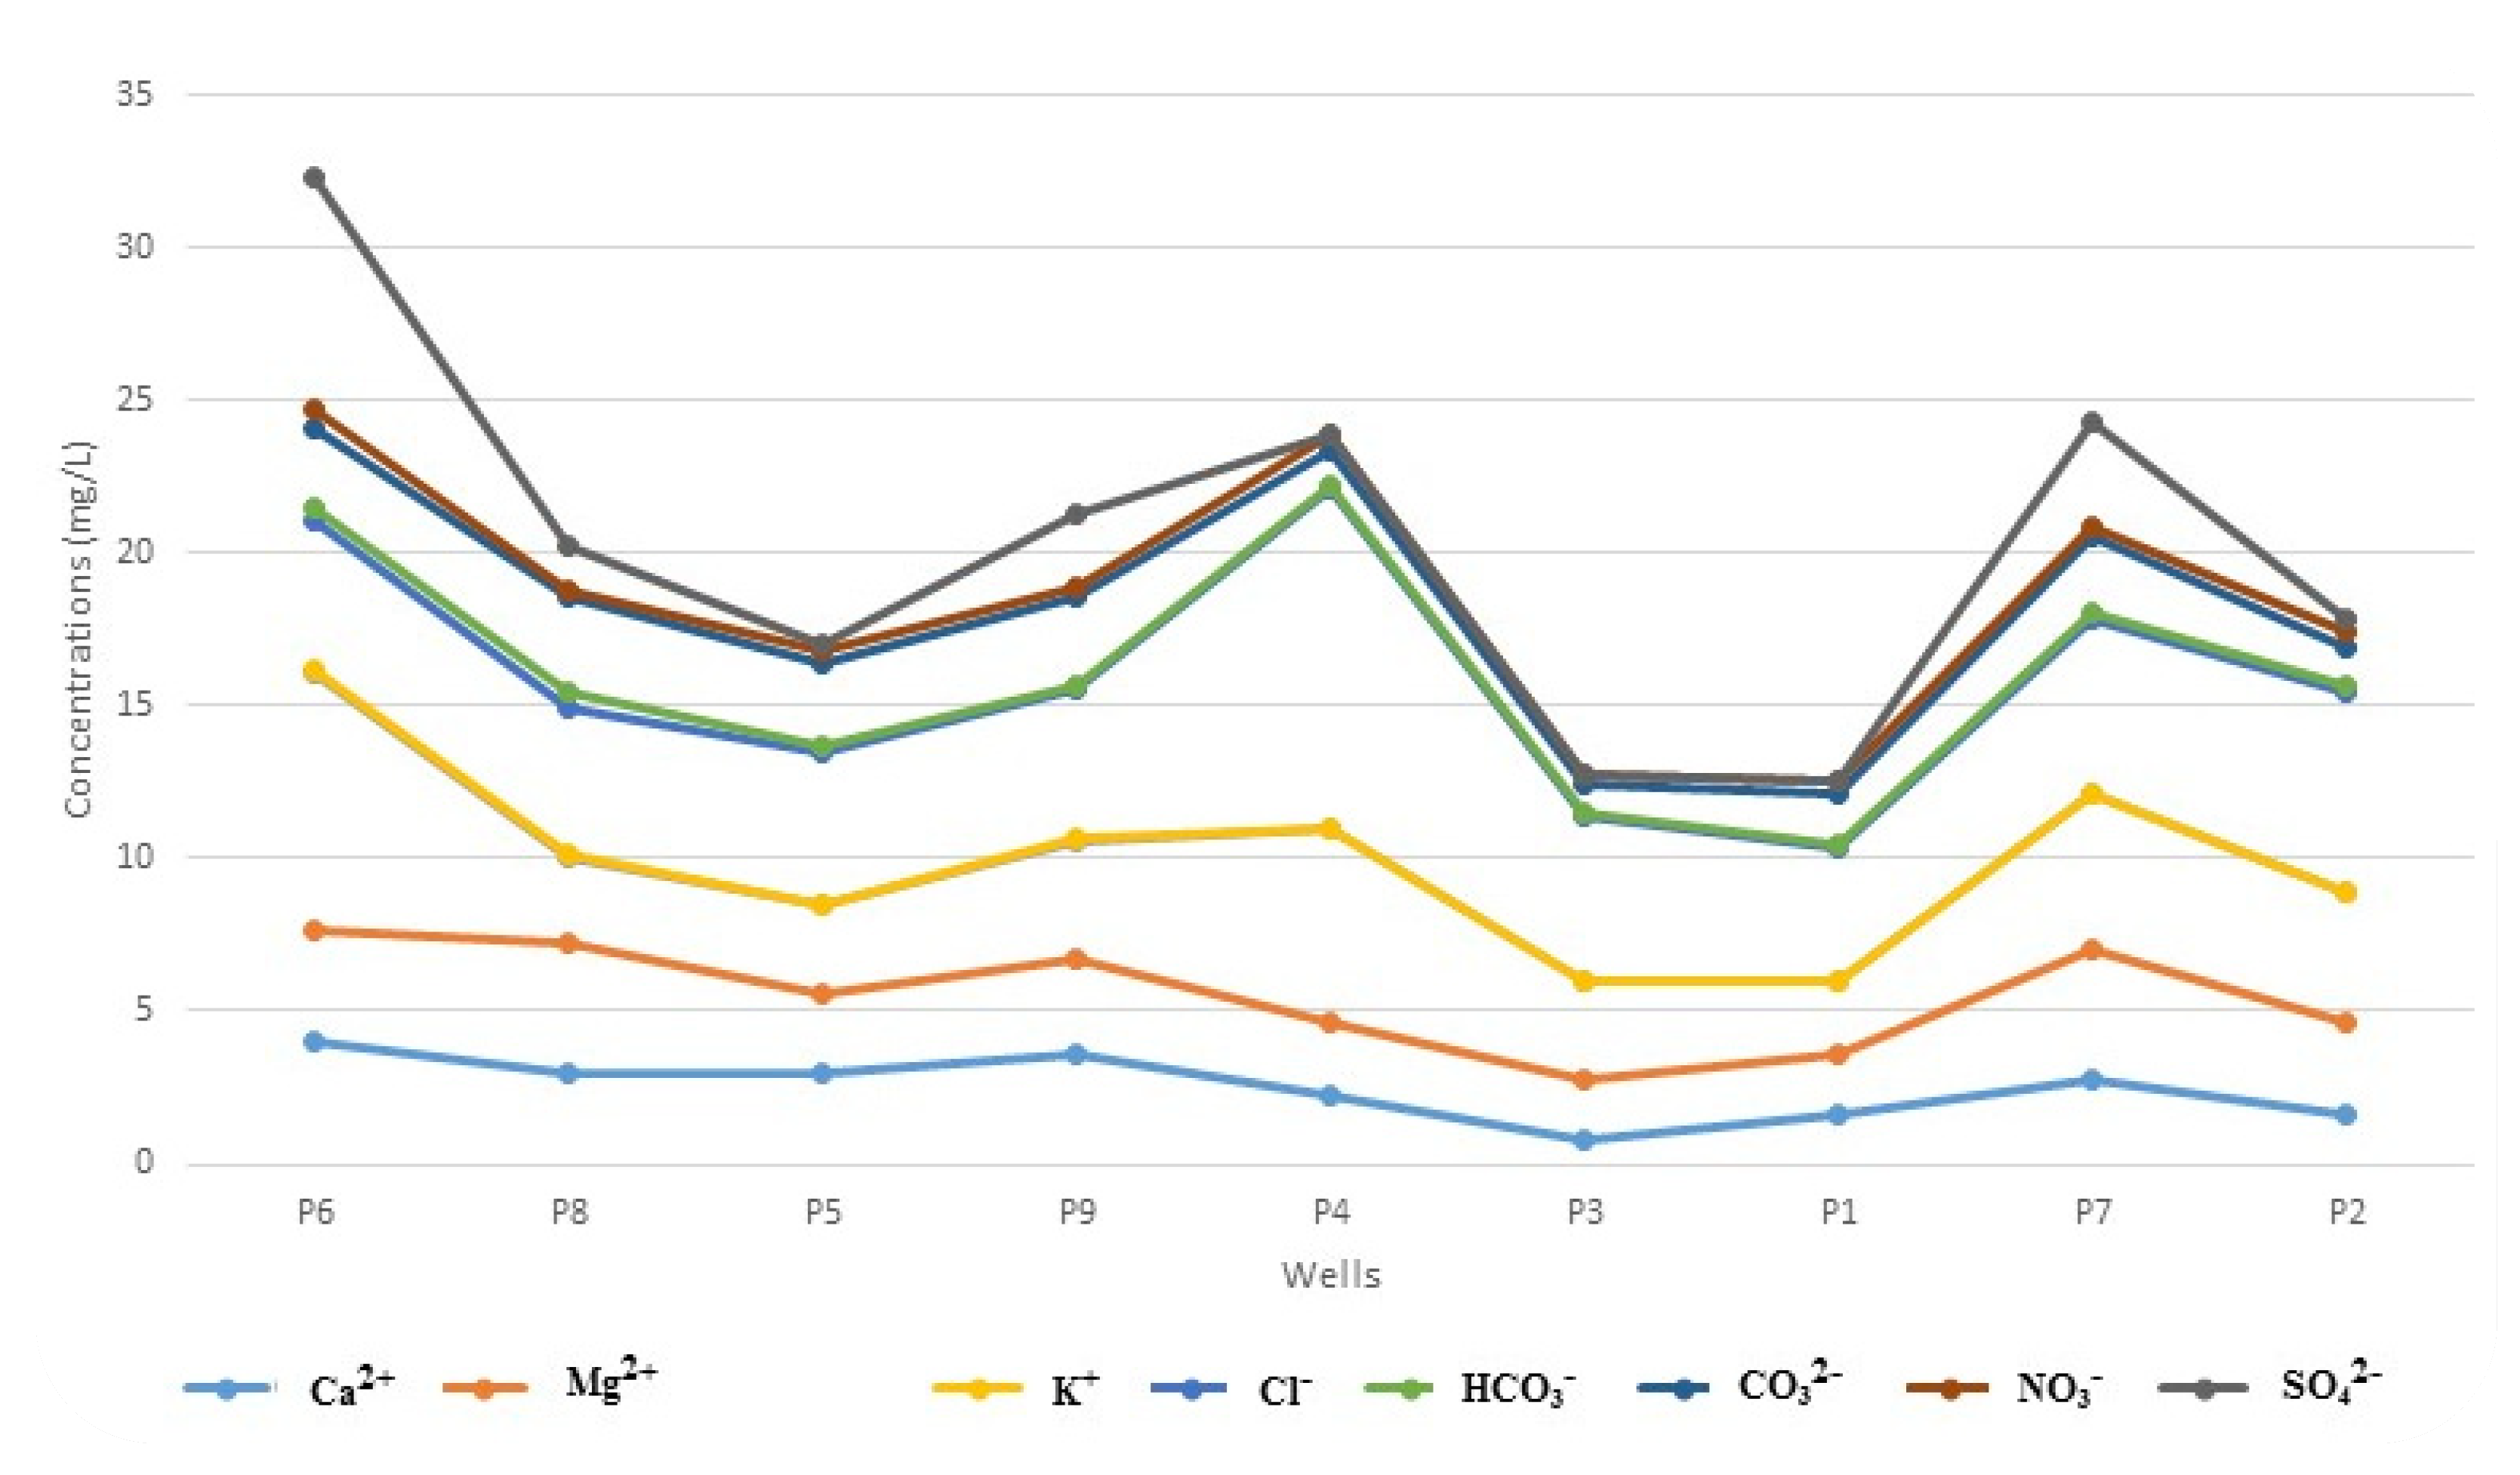
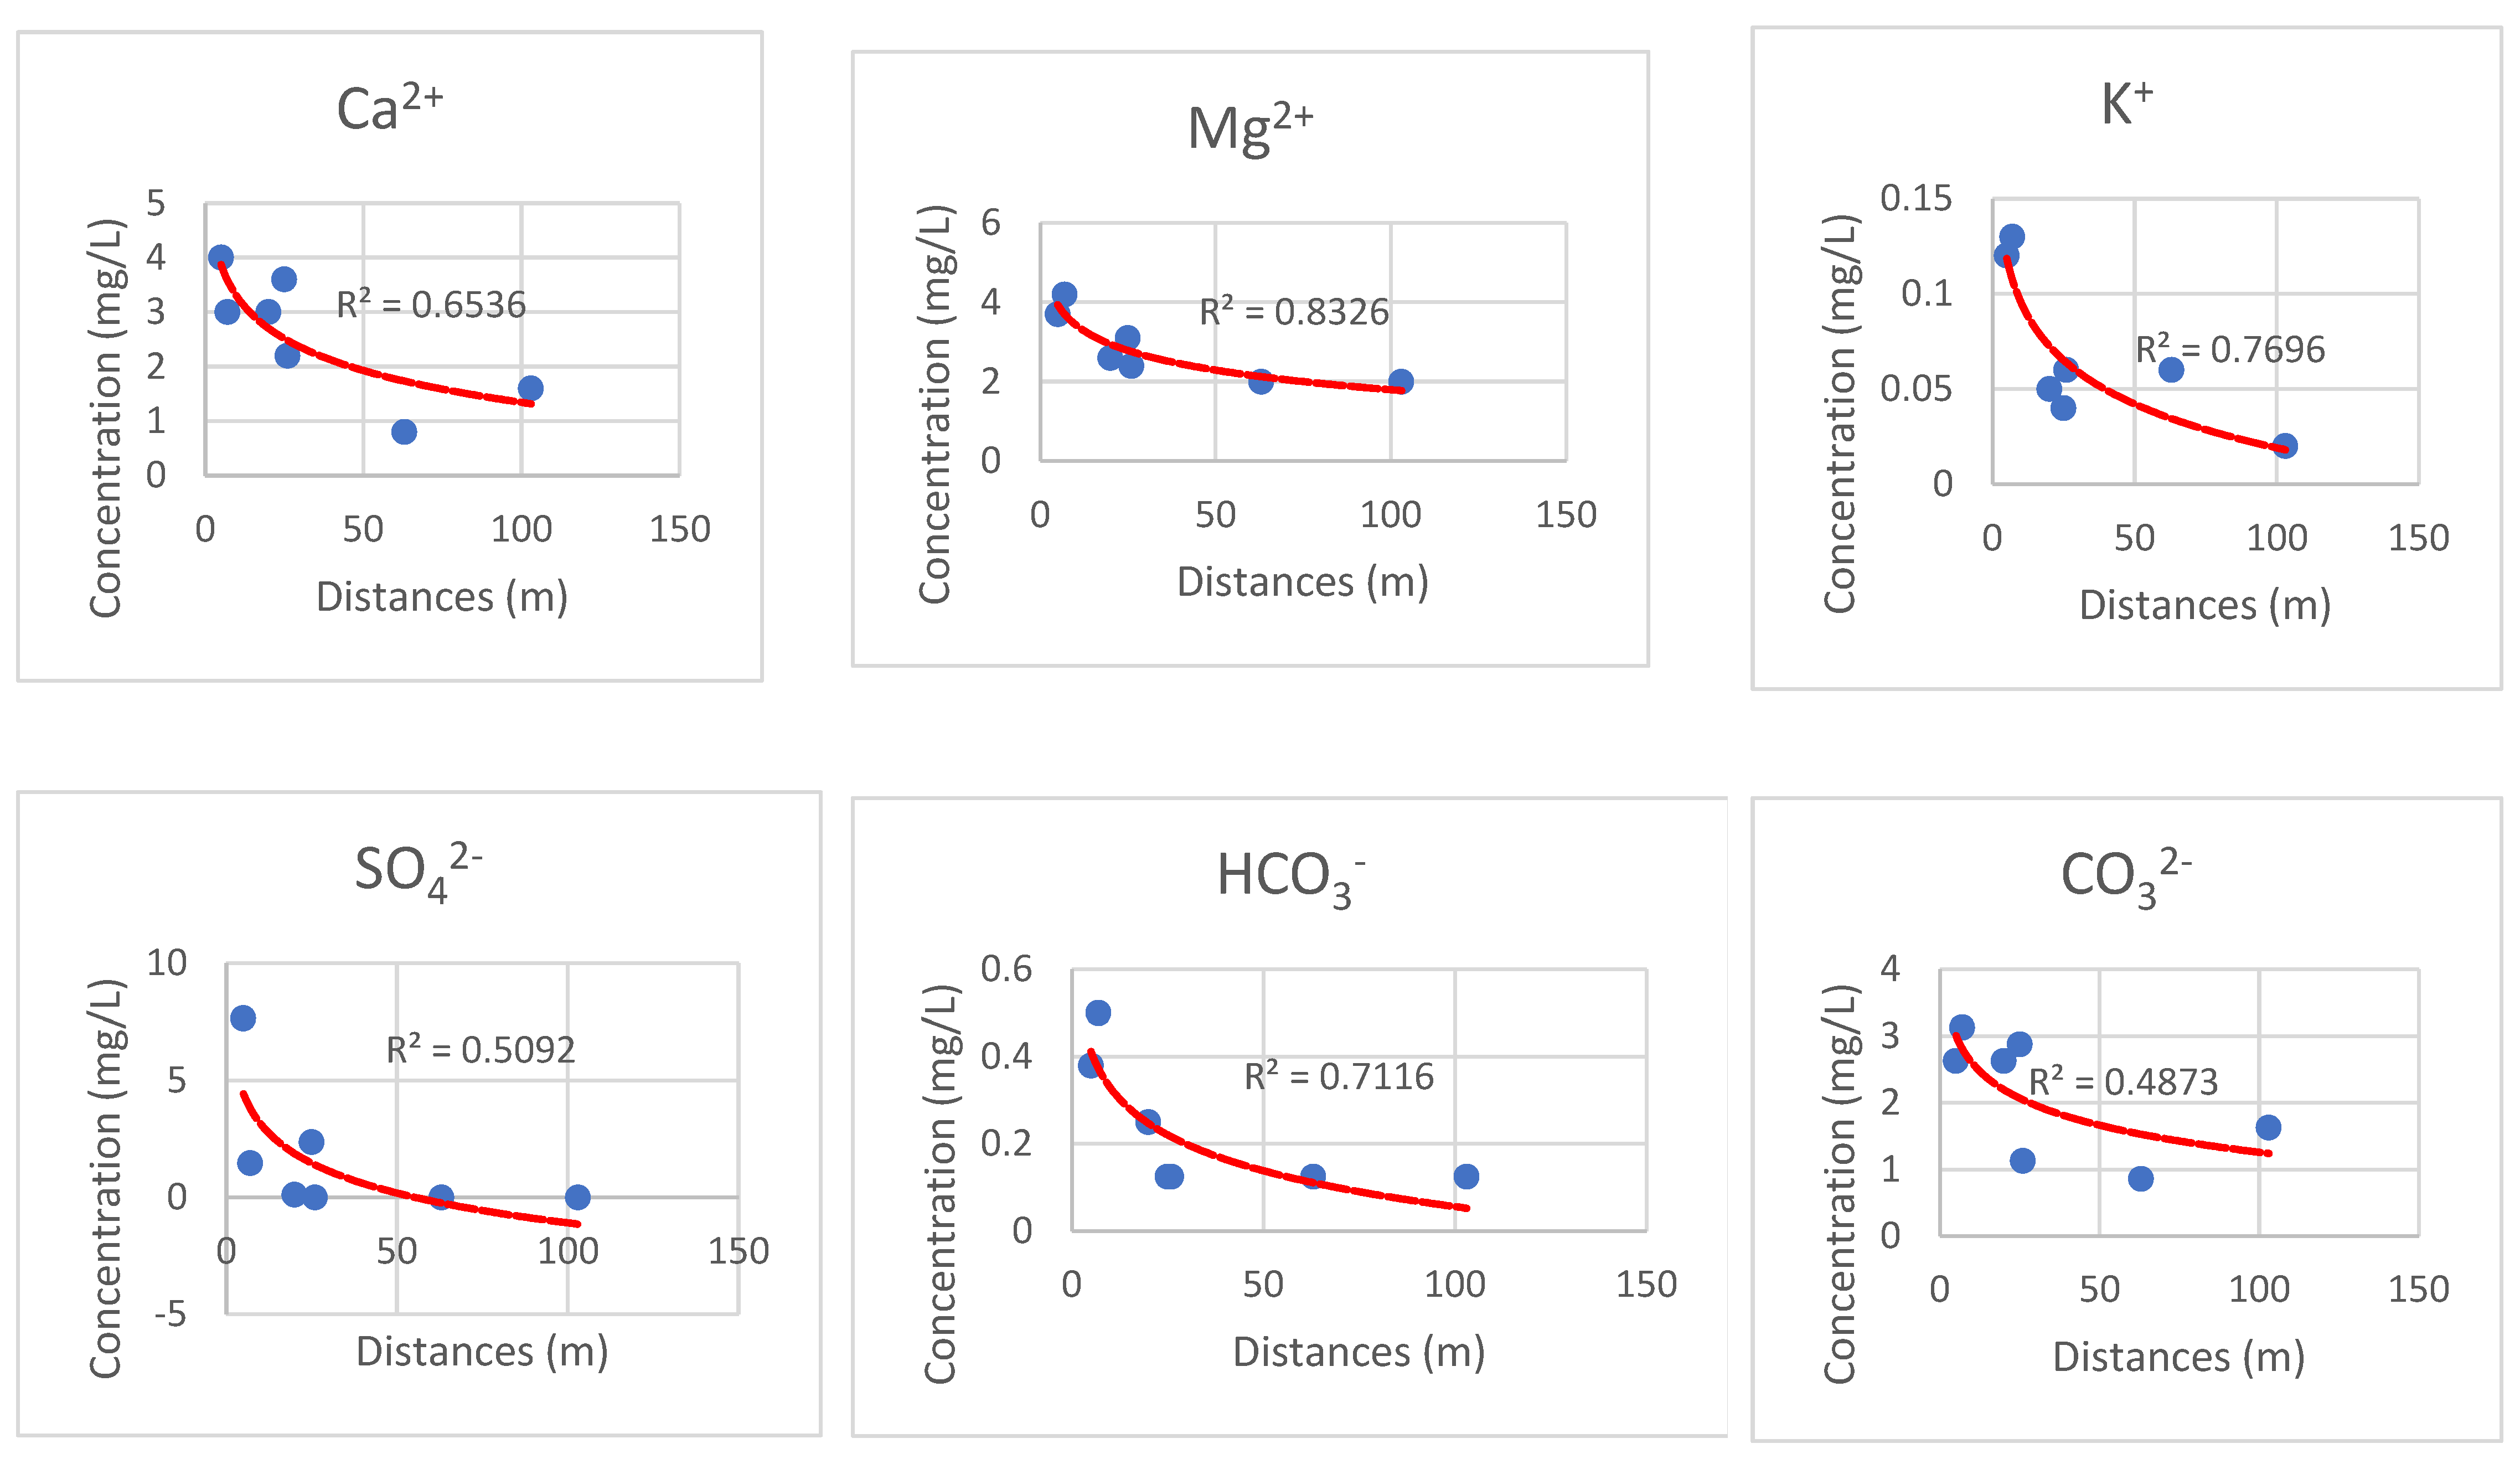
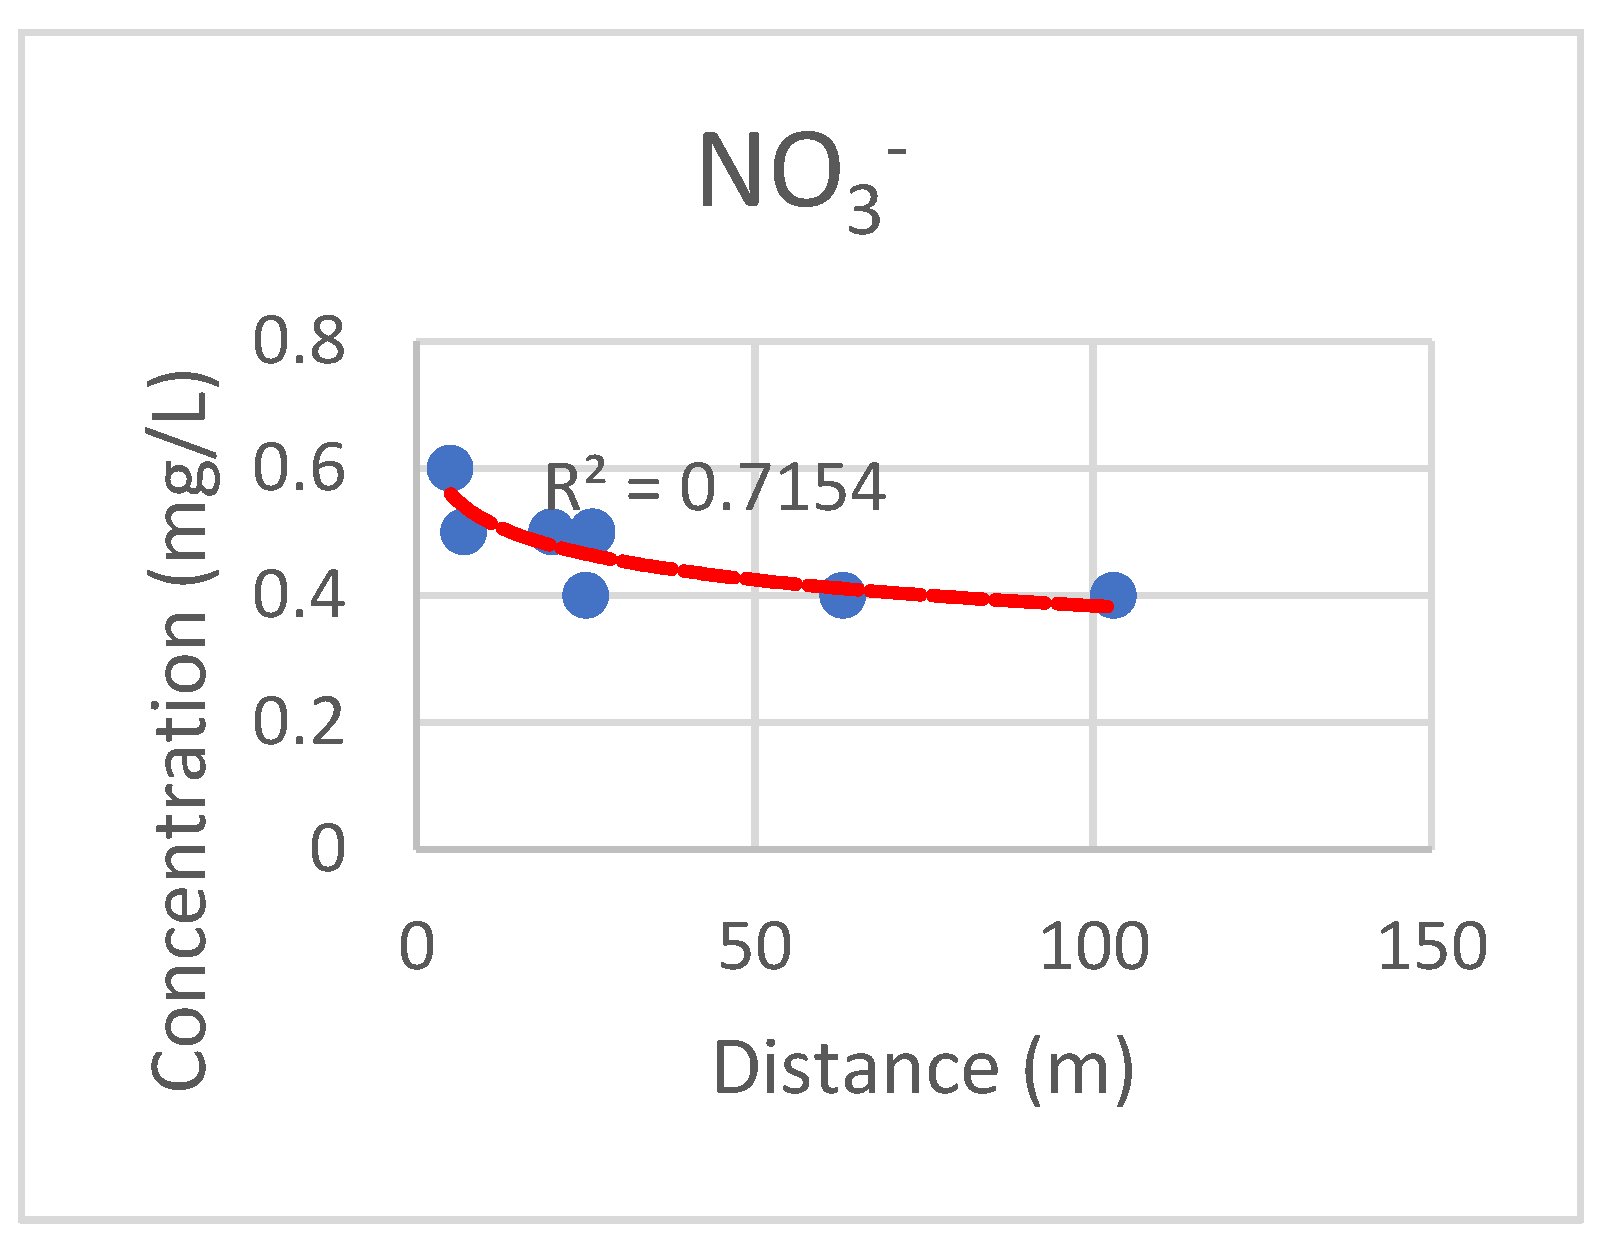
3.6. Distribution of the Main Ion Concentrations according to the Distance from the River
3.7. Interpretation for GW–SW Interactions with Hydrochemical Data
4. Conclusions
Author Contributions
Funding
Data Availability Statement
Acknowledgments
Conflicts of Interest
References
- Dakkak, H.; Zouahri, A.; Iaaich, H.; Moussadek, R.; Elkhadir, M.; Douaik, A.; Soudi, B.; Benmohammadi, A. Apport Des Systèmes d’Information Géographique Au Diagnostic de La Pollution Nitrique Des Eaux Souterraines: Cas de La Zone de Skhirate–Maroc. Available online: https://www.researchgate.net/profile/Ahmed-Douaik/publication/262378124_Apport_des_Systemes_d’Information_Geographique_au_diagnostic_de_la_pollution_nitrique_des_eaux_souterraines_Cas_de_la_zone_de_Skhirate_-_Maroc/links/5698970e08ae1c42790560a0/Apport-des-Systemes-dInformation-Geographique-au-diagnostic-de-la-pollution-nitrique-des-eaux-souterraines-Cas-de-la-zone-de-Skhirate-Maroc.pdf (accessed on 1 March 2023).
- Hind, E.S. Vulnérabilité à La Pollution Des Eaux Souterraines: Aspects Dynamique et Application à l’aquifère de R’Mel (La-rache, Maroc). Int. J. Innov. Appl. Stud. 2015, 6, 929–940. [Google Scholar]
- Belhadj, M.Z. Qualité Des Eaux de Surface et Leur Impact Sur l’environnement Dans La Wilaya de Skikda. Ph.D. Thesis, Université Mohamed Khider-Biskra, Biskra, Algeria, 2017. [Google Scholar]
- Belhassan, K.; Hessane, M.A.; Essahlaoui, A. Interactions eaux de surface–eaux souterraines: Bassin versant de l’Oued Mikkes (Maroc). Hydrol. Sci. J. 2010, 55, 1371–1384. [Google Scholar] [CrossRef]
- Wang, W.; Chen, Y.; Wang, W.; Zhu, C.; Chen, Y.; Liu, X.; Zhang, T. Water quality and interaction between groundwater and surface water impacted by agricultural activities in an oasis-desert region. J. Hydrol. 2023, 617, 128937. [Google Scholar] [CrossRef]
- Ogwueleka, T.C.; Christopher, I.E. Hydrochemical interfaces and spatial assessment of Usuma River water quality in North-Central Nigeria. Sci. Afr. 2020, 8, e00371. [Google Scholar] [CrossRef]
- Dawoud, M.A.; Raouf, A.R.A. Groundwater Exploration and Assessment in Rural Communities of Yobe State, Northern Nigeria. Water Resour. Manag. 2008, 23, 581–601. [Google Scholar] [CrossRef]
- Tirkey, P.; Bhattacharya, T.; Chakraborty, S.; Baraik, S. Assessment of groundwater quality and associated health risks: A case study of Ranchi city, Jharkhand, India. Groundw. Sustain. Dev. 2017, 5, 85–100. [Google Scholar] [CrossRef]
- Gulgundi, M.S.; Shetty, A. Groundwater quality assessment of urban Bengaluru using multivariate statistical techniques. Appl. Water Sci. 2018, 8, 43. [Google Scholar] [CrossRef]
- Azzirgue, E.M.; Salmoun, F. Assessment of the Physico-Chemical Quality of Water of Oued Ouljat Echatt and Dam Ibn Batouta-Tangier. Int. J. Adv. Sci. Res. Eng. 2019, 5, 314–324. [Google Scholar] [CrossRef]
- Azzirgue, E.M.; Farida, S.; El Khalil, C.; Mejjad, N. Determination of the Jouamaa Groundwater Quality Using Physi-co-Chemical Water Analysis and Geographic Information System. In E3S Web of Conferences; EDP Sciences: Les Ulis, France, 2021; Volume 314, p. 07006. [Google Scholar]
- Azhari, H.E.; Cherif, E.K.; Sarti, O.; Azzirgue, E.M.; Dakak, H.; Yachou, H.; Esteves da Silva, J.C.; Salmoun, F. Assessment of Surface Water Quality Using the Water Quality Index (IWQ), Multivariate Statistical Analysis (MSA) and Geographic Infor-mation System (GIS) in Oued Laou Mediterranean Watershed, Morocco. Water 2023, 15, 130. [Google Scholar] [CrossRef]
- Taoufiq, L.; Kacimi, I.; Saadi, M.; Nouayti, N.; Kassou, N.; Bouramtane, T.; El-Mouhdi, K. Assessment of Physicochemical and Bacteriological Parameters in the Angads Aquifer (Northeast Morocco): Application of Principal Component Analysis and Piper and Schoeller–Berkaloff Diagrams. Appl. Environ. Soil Sci. 2023, 2023, 2806854. [Google Scholar] [CrossRef]
- Wang, B.; Wang, Y.; Wang, S. Improved water pollution index for determining spatiotemporal water quality dynamics: Case study in the Erdao Songhua River Basin, China. Ecol. Indic. 2021, 129, 107931. [Google Scholar] [CrossRef]
- Zhang, M.; Chen, G.; Luo, Z.; Sun, X.; Xu, J. Spatial distribution, source identification, and risk assessment of heavy metals in seawater and sediments from Meishan Bay, Zhejiang coast, China. Mar. Pollut. Bull. 2020, 156, 111217. [Google Scholar] [CrossRef]
- Zhang, H.; Yu, J.; Wang, P.; Wang, T.; Li, Y. Groundwater-fed oasis in arid Northwest China: Insights into hydrological and hydrochemical processes. J. Hydrol. 2021, 597, 126154. [Google Scholar] [CrossRef]
- Zhang, Y.; Jia, R.; Wu, J.; Wang, H.; Luo, Z. Uncertain in WQI-based groundwater quality assessment methods: A case study in east of Beijing, China. Environ. Earth Sci. 2022, 81, 202. [Google Scholar] [CrossRef]
- Uddin, M.G.; Nash, S.; Olbert, A.I. A review of water quality index models and their use for assessing surface water quality. Ecol. Indic. 2021, 122, 107218. [Google Scholar] [CrossRef]
- Alexakis, D.E. Applying Factor Analysis and the CCME Water Quality Index for Assessing Groundwater Quality of an Aegean Island (Rhodes, Greece). Geosciences 2022, 12, 384. [Google Scholar] [CrossRef]
- Atta, H.S.; Omar, M.A.-S.; Tawfik, A.M. Water quality index for assessment of drinking groundwater purpose case study: Area surrounding Ismailia Canal, Egypt. J. Eng. Appl. Sci. 2022, 69, 83. [Google Scholar] [CrossRef]
- Vadiati, M.; Asghari-Moghaddam, A.; Nakhaei, M.; Adamowski, J.; Akbarzadeh, A. A fuzzy-logic based decision-making approach for identification of groundwater quality based on groundwater quality indices. J. Environ. Manag. 2016, 184, 255–270. [Google Scholar] [CrossRef]
- Azzirgue, E.M.; Cherif, E.K.; Tchakoucht, T.A.; El Azhari, H.; Salmoun, F. Testing Groundwater Quality in Jouamaa Hakama Region (North of Morocco) Using Water Quality Indices (WQIs) and Fuzzy Logic Method: An Exploratory Study. Water 2022, 14, 3028. [Google Scholar] [CrossRef]
- Azzirgue, E.M.; Salmoun, F.; Cherif, E.K.; Ait Tchakoucht, T.; Mejjad, N. Using Machine Learning Approaches to Predict Water Quality of Ibn Battuta Dam (Tangier, Morocco). In Proceedings of the 2nd International Conference on Big Data, Modelling and Machine Learning, Kenitra, Morocco, 15–16 July 2021; SCITEPRESS—Science and Technology Publications: Kenitra, Morocco, 2021; pp. 350–354. [Google Scholar]
- Trabelsi, F.; Bel Hadj Ali, S. Exploring Machine Learning Models in Predicting Irrigation Groundwater Quality Indices for Effective Decision Making in Medjerda River Basin, Tunisia. Sustainability 2022, 14, 2341. [Google Scholar] [CrossRef]
- Eid, M.H.; Elbagory, M.; Tamma, A.A.; Gad, M.; Elsayed, S.; Hussein, H.; Moghanm, F.S.; Omara, A.E.-D.; Kovács, A.; Péter, S. Evaluation of Groundwater Quality for Irrigation in Deep Aquifers Using Multiple Graphical and Indexing Approaches Sup-ported with Machine Learning Models and GIS Techniques, Souf Valley, Algeria. Water 2023, 15, 182. [Google Scholar] [CrossRef]
- Uddin, G.; Nash, S.; Rahman, A.; Olbert, A.I. A sophisticated model for rating water quality. Sci. Total. Environ. 2023, 868, 161614. [Google Scholar] [CrossRef]
- Zanial, W.N.C.W.; Malek, M.B.A.; Reba, M.N.M.; Zaini, N.; Ahmed, A.N.; Sherif, M.; Elshafie, A. River flow prediction based on improved machine learning method: Cuckoo Search-Artificial Neural Network. Appl. Water Sci. 2022, 13, 28. [Google Scholar] [CrossRef]
- aldahy, D.H.; Ibrahim, M.A. Artificial Neural Networks Modelling for Al-Rustumiya Wastwater Treatment Plant in Baghdad. 3c Empresa Investig. Pensam. Crít. 2023, 12, 257–271. [Google Scholar] [CrossRef]
- Samson, S.; Elangovan, K. Multivariate Statistical Analysis to Assess Groundwater Quality in Namakkal District, Tamil Nadu, India; NISCAIR-CSIR: New Delhi, India, 2017. [Google Scholar]
- Cherif, E.K.; Salmoun, F.; Nouayti, N.; da Silva, J.C.E. Determination of Physical-Chemical Quality of Tangier Free Zone and Gzenaya Zone Industrial Wastewaters (TFZ & GZ) in Tangier, Morocco. In Proceedings of the 4th Edition of International Conference on Geo-IT and Water Resources 2020, Geo-IT and Water Resources 2020, New York, NY, USA, 11 March 2020; ACM: Al-Hoceima, Morocco, 2020. [Google Scholar]
- Ravikumar, P.; Somashekar, R.K. Principal component analysis and hydrochemical facies characterization to evaluate groundwater quality in Varahi river basin, Karnataka state, India. Appl. Water Sci. 2015, 7, 745–755. [Google Scholar] [CrossRef]
- Güler, C.; Thyne, G.D.; McCray, J.E.; Turner, K.A. Evaluation of Graphical and Multivariate Statistical Methods for Classifi-cation of Water Chemistry Data. Hydrogeol. J. 2002, 10, 455–474. [Google Scholar] [CrossRef]
- Khouni, I.; Louhichi, G.; Ghrabi, A. Use of GIS based Inverse Distance Weighted interpolation to assess surface water quality: Case of Wadi El Bey, Tunisia. Environ. Technol. Innov. 2021, 24, 101892. [Google Scholar] [CrossRef]
- Etikala, B.; Golla, V.; Li, P.; Renati, S. Deciphering groundwater potential zones using MIF technique and GIS: A study from Tirupati area, Chittoor District, Andhra Pradesh, India. Hydroresearch 2019, 1, 1–7. [Google Scholar] [CrossRef]
- Golla, V.; Arveti, N.; Etikala, B.; Sreedhar, Y.; Narasimhlu, K.; Harish, P. Data Sets on Spatial Analysis of Hydro Geochemistry of Gudur Area, SPSR Nellore District by Using Inverse Distance Weighted Method in Arc GIS 10.1. Data Brief 2019, 22, 1003–1011. [Google Scholar] [CrossRef]
- Ohlert, P.L.; Bach, M.; Breuer, L. Accuracy assessment of inverse distance weighting interpolation of groundwater nitrate concentrations in Bavaria (Germany). Environ. Sci. Pollut. Res. 2022, 30, 9445–9455. [Google Scholar] [CrossRef]
- Lahmar, M.; El Khodrani, N.; Omrania, S.; Dakak, H.; Douaik, A.; Iaaich, H.; El Azzouzi, M.; Mekkaoui, M.; Zouahri, A. As-sessement of the Physico-Chemical Quality of Groundwater in the Sidi Yahya Region, Gharb, Morocco. Moroc. J. Chem. 2019, 7, 424–430. [Google Scholar]
- El Oumlouki, K.; Moussadek, R.; Douaik, A.; Iaaich, H.; Dakak, H.; Chati, M.T.; Ghanimi, A.; El Midaoui, A.; El Amrani, M.; Zouahri, A. Assessment of the Groundwater Salinity Used for Irrigation and Risks of Soil Degradation in Souss-Massa, Morocco. Irrig. Drain. 2018, 67, 38–51. [Google Scholar] [CrossRef]
- El Mouine, Y.; El Hamdi, A.; Morarech, M.; Valles, V.; Yachou, H.; Dakak, H. Groundwater Contamination Due to Landfill Leachate—A Case Study of Tadla Plain. Environ. Sci. Proc. 2022, 16, 53. [Google Scholar] [CrossRef]
- Chandran, S.; Selvan, P.; Dhanasekarapandian, M.; Kumar, V.; Surendran, U. Hydrogeochemical characteristics of surface and groundwater: Suitability for human consumption and irrigated agriculture purposes in Suruliyar sub basin, South India. Environ. Geochem. Health 2021, 44, 1713–1737. [Google Scholar] [CrossRef] [PubMed]
- Zouahri, A.; Dakak, H.; Douaik, A.; El Khadir, M.; Moussadek, R. Evaluation of groundwater suitability for irrigation in the Skhirat region, Northwest of Morocco. Environ. Monit. Assess. 2014, 187, 4184. [Google Scholar] [CrossRef] [PubMed]
- Yidana, S.M.; Yidana, A. Assessing water quality using water quality index and multivariate analysis. Environ. Earth Sci. 2009, 59, 1461–1473. [Google Scholar] [CrossRef]
- Montcoudiol, N.; Molson, J.; Lemieux, J.M. Groundwater Geochemistry of the Outaouais Region (Québec, Canada): A Re-gional-Scale Study. Hydrogeol. J. 2015, 23, 377. [Google Scholar] [CrossRef]
- Cloutier, V.; Lefebvre, R.; Therrien, R.; Savard, M.M. Multivariate statistical analysis of geochemical data as indicative of the hydrogeochemical evolution of groundwater in a sedimentary rock aquifer system. J. Hydrol. 2008, 353, 294–313. [Google Scholar] [CrossRef]
- de la Hera-Portillo, Á.; López-Gutiérrez, J.; Moreno-Merino, L.; Llorente-Isidro, M.; Fensham, R.; Fernández, M.; Ghanem, M.; Salman, K.; Sánchez-Fabián, J.; Gallego-Rojas, N.; et al. Geodiversity of Las Loras UNESCO Global Geopark: Hydrogeological Significance of Groundwater and Landscape Interaction and Conceptual Model of Functioning. Resources 2023, 12, 14. [Google Scholar] [CrossRef]
- Wali, S.U.; Alias, N.B.; Bin Harun, S.; Umar, K.J.; Gada, M.A.; Dankani, I.M.; Kaoje, I.U.; Usman, A.A. Water quality indices and multivariate statistical analysis of urban groundwater in semi-arid Sokoto Basin, Northwestern Nigeria. Groundw. Sustain. Dev. 2022, 18, 100779. [Google Scholar] [CrossRef]
- Jassas, H.; Merkel, B. Assessment of hydrochemical evolution of groundwater and its suitability for drinking and irrigation purposes in Al-Khazir Gomal Basin, Northern Iraq. Environ. Earth Sci. 2015, 74, 6647–6663. [Google Scholar] [CrossRef]
- Alkinani, M.; Merkel, B. Hydrochemical and isotopic investigation of groundwater of Al-Batin alluvial fan aquifer, Southern Iraq. Environ. Earth Sci. 2017, 76, 301. [Google Scholar] [CrossRef]
- Kumar, B.; Singh, U.K.; Ojha, S.N. Evaluation of geochemical data of Yamuna River using WQI and multivariate statistical analyses: A case study. Int. J. River Basin Manag. 2018, 17, 143–155. [Google Scholar] [CrossRef]
- Kumar, M.; Ramanathan, A.; Keshari, A.K. Understanding the extent of interactions between groundwater and surface water through major ion chemistry and multivariate statistical techniques. Hydrol. Process. 2008, 23, 297–310. [Google Scholar] [CrossRef]
- Danczak, R.E.; Sawyer, A.H.; Williams, K.H.; Stegen, J.C.; Hobson, C.; Wilkins, M.J. Seasonal hyporheic dynamics control coupled microbiology and geochemistry in Colorado River sediments. J. Geophys. Res. Biogeosciences 2016, 121, 2976–2987. [Google Scholar] [CrossRef]
- Harjung, A.; Perujo, N.; Butturini, A.; Romaní, A.M.; Sabater, F. Responses of microbial activity in hyporheic pore water to biogeochemical changes in a drying headwater stream. Freshw. Biol. 2019, 64, 735–749. [Google Scholar] [CrossRef]
- Yuan, R.; Wang, M.; Wang, S.; Song, X. Water transfer imposes hydrochemical impacts on groundwater by altering the interaction of groundwater and surface water. J. Hydrol. 2020, 583, 124617. [Google Scholar] [CrossRef]
- Vrzel, J.; Solomon, D.K.; Blažeka, Ž.; Ogrinc, N. The study of the interactions between groundwater and Sava River water in the Ljubljansko polje aquifer system (Slovenia). J. Hydrol. 2018, 556, 384–396. [Google Scholar] [CrossRef]
- Rugel, K.; Golladay, S.W.; Jackson, C.R.; Rasmussen, T.C. Delineating groundwater/surface water interaction in a karst watershed: Lower Flint River Basin, southwestern Georgia, USA. J. Hydrol. Reg. Stud. 2016, 5, 1–19. [Google Scholar] [CrossRef]
- Rozemeijer, J.; Klein, J.; Hendriks, D.; Borren, W.; Ouboter, M.; Rip, W. Groundwater-surface water relations in regulated lowland catchments; hydrological and hydrochemical effects of a major change in surface water level management. Sci. Total. Environ. 2019, 660, 1317–1326. [Google Scholar] [CrossRef]
- Kshetrimayum, K.; Laishram, P. Assessment of surface water and groundwater interaction using hydrogeology, hydrochemical and isotopic constituents in the Imphal river basin, Northeast India. Groundw. Sustain. Dev. 2020, 11, 100391. [Google Scholar] [CrossRef]
- Kong, F.; Song, J.; Zhang, Y.; Fu, G.; Cheng, D.; Zhang, G.; Xue, Y. Surface Water-Groundwater Interaction in the Guanzhong Section of the Weihe River Basin, China. Groundwater 2018, 57, 647–660. [Google Scholar] [CrossRef]
- Menció, A.; Galán, M.; Boix, D.; Mas-Pla, J. Analysis of stream–aquifer relationships: A comparison between mass balance and Darcy’s law approaches. J. Hydrol. 2014, 517, 157–172. [Google Scholar] [CrossRef]
- Martinez, J.L.; Raiber, M.; Cox, M.E. Assessment of groundwater–surface water interaction using long-term hydrochemical data and isotope hydrology: Headwaters of the Condamine River, Southeast Queensland, Australia. Sci. Total. Environ. 2015, 536, 499–516. [Google Scholar] [CrossRef]
- Yang, N.; Zhou, P.; Wang, G.; Zhang, B.; Shi, Z.; Liao, F.; Li, B.; Chen, X.; Guo, L.; Dang, X.; et al. Hydrochemical and isotopic interpretation of interactions between surface water and groundwater in Delingha, Northwest China. J. Hydrol. 2021, 598, 126243. [Google Scholar] [CrossRef]
- Fadili, A.; Mehdi, K.; Riss, J.; Najib, S.; Makan, A.; Boutayab, K. Evaluation of groundwater mineralization processes and seawater intrusion extension in the coastal aquifer of Oualidia, Morocco: Hydrochemical and geophysical approach. Arab. J. Geosci. 2015, 8, 8567–8582. [Google Scholar] [CrossRef]
- Nouayti, N.; Cherif, E.K.; Algarra, M.; Pola, M.L.; Fernández, S.; Nouayti, A.; Esteves da Silva, J.C.; Driss, K.; Samlani, N.; Mohamed, H.; et al. Determination of Physicochemical Water Quality of the Ghis-Nekor Aquifer (Al Hoceima, Morocco) Using Hydrochemistry, Multiple Isotopic Tracers, and the Geographical Information System (GIS). Water 2022, 14, 606. [Google Scholar] [CrossRef]
- Ouhamdouch, S. Hydrogeochemical processes in rural coastal aquifer (Haha region, Morocco). Environ. Sci. Pollut. Res. 2023, 30, 43975–43990. [Google Scholar] [CrossRef] [PubMed]
- Ghalit, M.; Bouaissa, M.; Gharibi, E.; Taupin, J.-D.; Patris, N. Hydrogeochemical Characteristics and Isotopic Tools Used to Identify the Mineralization Processes of Bottled Mineral Water in Morocco. Geosciences 2023, 13, 38. [Google Scholar] [CrossRef]
- Ez-Zaouy, Y.; Bouchaou, L.; Schreiber, H.; Montcoudiol, N.; Kalberkamp, U.; Danni, S.O.; Touab, A.; Abourrig, F.; Hssaisoune, M. Combined geophysical methods to investigate seawater intrusion in the Souss-Massa coastal area, Morocco. Groundw. Sustain. Dev. 2023, 21, 100915. [Google Scholar] [CrossRef]
- El Ouali, A.; Roubil, A.; Lahrach, A.; Moudden, F.; Ouzerbane, Z.; Hammani, O.; El Hmaidi, A. Assessment of groundwater quality and its recharge mechanisms using hydrogeochemical and isotopic data in the Tafilalet plain (south-eastern Morocco). Mediterr. Geosci. Rev. 2023, 5, 1–14. [Google Scholar] [CrossRef]
- El Yousfi, Y.; Himi, M.; El Ouarghi, H.; Aqnouy, M.; Benyoussef, S.; Gueddari, H.; Hmeid, H.A.; Alitane, A.; Chaibi, M.; Zahid, M.; et al. Assessment and Prediction of the Water Quality Index for the Groundwater of the Ghiss-Nekkor (Al Hoceima, Northeastern Morocco). Sustainability 2022, 15, 402. [Google Scholar] [CrossRef]
- Kacem, L.; Agoussine, M.; Igmoullan, B.; Mokhtari, S.; Amar, H. Features of interaction between lake water and springs, and evaluation of hydrochemical composition of water in Ifni Lake (High Atlas Mountains, Morocco, north of Africa). Water Resour. 2016, 43, 395–401. [Google Scholar] [CrossRef]
- Haut Commissariat au Plan Direction Régionale de Tanger-Tétouan-Al Hoceima. Note d’information Sur Les Comptes Régio-naux En2019; Haut Commissariat au Plan Direction Régionale de Tanger-Tétouan-Al Hoceima: Tangier, Morocco, 2021. [Google Scholar]
- Tribak, Y.; El Morabiti, K.; Hlila, R. TEtude Hydrogéologique Préliminaire de La Zone Des Flyschs à l’Ouest de Tétouan (Maroc). Int. J. Innov. Appl. Stud. 2016, 14, 653. [Google Scholar]
- Mahamat, S.A.M.; Maoudombaye, T.; Abdelsalam, T.; Ndoumtamia, G.; Loukhman, B. Évaluation de la qualité physico-chimique des eaux d’adduction publique de la Société Tchadienne des Eaux à N’djamena au Tchad. J. Appl. Biosci. 2016, 95, 8973. [Google Scholar] [CrossRef]
- Tiwari, A.K.; Singh, P.K.; Mahato, M.K. GIS-Based Evaluation of Water Quality Index of Ground Water Resources in West Bokaro Coalfield, India. Curr. World Environ. 2014, 9, 843. [Google Scholar] [CrossRef]
- Barakat, A.; Hilali, A.; El Baghdadi, M.; Touhami, F. Assessment of shallow groundwater quality and its suitability for drinking purpose near the Béni-Mellal wastewater treatment lagoon (Morocco). Hum. Ecol. Risk Assess. Int. J. 2019, 26, 1476–1495. [Google Scholar] [CrossRef]
- NM 03.7.001; Norme Marocaine Relative à La Qualité Des Eaux d’alimentation Humaine. Bulletin Officiel: Rabat, Morocco, 2006.
- Ustaoğlu, F.; Tepe, Y.; Taş, B. Assessment of stream quality and health risk in a subtropical Turkey river system: A combined approach using statistical analysis and water quality index. Ecol. Indic. 2019, 113, 105815. [Google Scholar] [CrossRef]
- Xiao, Y.; Liu, K.; Hao, Q.; Xiao, D.; Zhu, Y.; Yin, S.; Zhang, Y. Hydrogeochemical insights into the signatures, genesis and sustainable perspective of nitrate enriched groundwater in the piedmont of Hutuo watershed, China. Catena 2022, 212, 106020. [Google Scholar] [CrossRef]
- Soumaila, K.I.; Mustapha, N.; Mohamed, C. Assessment of Surface Water Quality using Indices and Geographic Information System in the Sebou River Basin, Morocco. Eur. Sci. J. ESJ 2021, 17, 249. [Google Scholar] [CrossRef]
- Benamar, A.; Mahjoubi, F.Z.; Kzaibe, F. Evaluation of Water Quality of Oum Er Rbia River (Morocco) Using Water Quality Index (WQI) Method. J. Appl. Surf. Interfaces 2019, 5. [Google Scholar] [CrossRef]
- Olurin, O.; Ganiyu, S.; Ogunsanwo, F.; Ojo, A.O.; Alabi, A.; Adegbamigbe, O. Groundwater quality assessments around acassava processing mill on the sedimentary terrain of Ilaro, South-western Nigeria. Hydroresearch 2022, 5, 108–117. [Google Scholar] [CrossRef]
- Shankar, B.S.; Sanjeev, L. Assessment of Water Quality Index for the Groundwaters of an Industrial Area In Bangalore, India. Environ. Eng. Sci. 2008, 25, 911–916. [Google Scholar] [CrossRef]
- Knopek, T.; Dabrowska, D. The Use of the Contamination Index and the LWPI Index to Assess the Quality of Groundwater in the Area of a Municipal Waste Landfill. Toxics 2021, 9, 66. [Google Scholar] [CrossRef]
- Krishan, G.; Kumar, M.; Rao, M.S.; Garg, R.; Yadav, B.K.; Kansal, M.; Singh, S.; Bradley, A.; Muste, M.; Sharma, L. Integrated approach for the investigation of groundwater quality through hydrochemistry and water quality index (WQI). Urban Clim. 2023, 47, 101383. [Google Scholar] [CrossRef]
- Kadam, A.; Wagh, V.; Jacobs, J.; Patil, S.; Pawar, N.; Umrikar, B.; Sankhua, R.; Kumar, S. Integrated approach for the evaluation of groundwater quality through hydro geochemistry and human health risk from Shivganga river basin, Pune, Maharashtra, India. Environ. Sci. Pollut. Res. 2021, 29, 4311–4333. [Google Scholar] [CrossRef]
- Li, C.; Gao, Z.; Chen, H.; Wang, J.; Liu, J.; Li, C.; Teng, Y.; Liu, C.; Xu, C. Hydrochemical analysis and quality assessment of groundwater in southeast North China Plain using hydrochemical, entropy-weight water quality index, and GIS techniques. Environ. Earth Sci. 2021, 80, 523. [Google Scholar] [CrossRef]
- Akhtar, N.; Ishak, M.; Ahmad, M.; Umar, K.; Yusuff, M.M.; Anees, M.; Qadir, A.; Almanasir, Y.A. Modification of the Water Quality Index (WQI) Process for Simple Calculation Using the Multi-Criteria Decision-Making (MCDM) Method: A Review. Water 2021, 13, 905. [Google Scholar] [CrossRef]
- Mukherjee, I.; Singh, U.K.; Chakma, S. Evaluation of groundwater quality for irrigation water supply using multi-criteria decision-making techniques and GIS in an agroeconomic tract of Lower Ganga basin, India. J. Environ. Manag. 2022, 309, 114691. [Google Scholar] [CrossRef]
- Batarseh, M.; Imreizeeq, E.; Tilev, S.; Al Alaween, M.; Suleiman, W.; Al Remeithi, A.M.; Al Tamimi, M.K.; Al Alawneh, M. Assessment of groundwater quality for irrigation in the arid regions using irrigation water quality index (IWQI) and GIS-Zoning maps: Case study from Abu Dhabi Emirate, UAE. Groundw. Sustain. Dev. 2021, 14, 100611. [Google Scholar] [CrossRef]
- Mahammad, S.; Hoque, M.; Islam, A.; Majumder, A. Assessment of groundwater quality for irrigation purposes: A case study of Hooghly District, West Bengal, India. In Case Studies in Geospatial Applications to Groundwater Resources; Elsevier: Amsterdam, The Netherlands, 2023; pp. 289–314. [Google Scholar] [CrossRef]
- Wilcox, L. Classification and Use of Irrigation Waters (No. 969); US Department of Agriculture: Washington, DC, USA, 1955. [Google Scholar]
- Alsubih, M.; Mallick, J.; Islam, A.R.M.T.; Almesfer, M.K.; Ben Kahla, N.; Talukdar, S.; Ahmed, M. Assessing Surface Water Quality for Irrigation Purposes in Some Dams of Asir Region, Saudi Arabia Using Multi-Statistical Modeling Approaches. Water 2022, 14, 1439. [Google Scholar] [CrossRef]
- Samtio, M.S.; Hakro, A.A.A.D.; Jahangir, T.M.; Mastoi, A.S.; Lanjwani, M.F.; Rajper, R.H.; Lashari, R.A.; Agheem, M.H.; Noonari, M.W. Impact of rock-water interaction on hydrogeochemical characteristics of groundwater: Using multivariate statistical, water quality index and irrigation indices of chachro sub-district, thar desert, sindh, Pakistan. Groundw. Sustain. Dev. 2023, 20, 100878. [Google Scholar] [CrossRef]
- Richards, L. Diagnosis and improvement of saline and alkali soils. Soil Sci. 1954, 78, 154. [Google Scholar] [CrossRef]
- Eaton, F.M. Significance of Carbonates in Irrigation Waters. Soil Sci. 1950, 69, 123–134. [Google Scholar] [CrossRef]
- Doneen, L. Notes on Water Quality in Agriculture; Department of Water Sciences and Engineering, University of California: Davis, CA, USA, 1964. [Google Scholar]
- Kelley, W.P. Use of Saline Irrigation Water. Soil Sci. 1963, 95, 385–391. [Google Scholar] [CrossRef]
- Gupta, S.K.; Gupta, I.C. Management of Saline Soils and Waters; Oxford & IBH Publishing, Co.: New Delhi, India, 1987. [Google Scholar]
- Paliwal, K.V. ; Indian Agricultural Research Institute. Irrigation with Saline Water; New Delhi (India) IARI, Water Technology Centre: New Delhi, India, 1972. [Google Scholar]
- Backhaus, K.; Erichson, B.; Gensler, S.; Weiber, R.; Weiber, T. Cluster Analysis. In Multivariate Analysis: An Application-Oriented Introduction; Backhaus, K., Erichson, B., Gensler, S., Weiber, R., Weiber, T., Eds.; Springer Fachmedien: Wiesbaden, Germany, 2021; pp. 451–530. ISBN 978-3-658-32589-3. [Google Scholar]
- Shyamala, G.; Sree Sakthi Engineering College; Jeyanthi, J. Integrated Weighted Overlay Model Using Inverse Distance Weightage for Assessing Groundwater Quality. J. Environ. Sci. Manag. 2019, 20, 26–32. [Google Scholar] [CrossRef]
- Ogbozige, F.J.; Adie, D.B.; Abubakar, U.A. Water quality assessment and mapping using inverse distance weighted interpolation: A case of River Kaduna, Nigeria. Niger. J. Technol. 2018, 37, 249. [Google Scholar] [CrossRef]
- Yadav, K.K.; Gupta, N.; Kumar, V.; Choudhary, P.; Khan, S.A. GIS-based evaluation of groundwater geochemistry and statistical determination of the fate of contaminants in shallow aquifers from different functional areas of Agra city, India: Levels and spatial distributions. RSC Adv. 2018, 8, 15876–15889. [Google Scholar] [CrossRef]
- Bon, A.F.; Ngoss, T.A.M.N.; Mboudou, G.E.; Banakeng, L.A.; Ngoupayou, J.R.N.; Ekodeck, G.E. Groundwater flow patterns, hydrogeochemistry and metals background levels of shallow hard rock aquifer in a humid tropical urban area in sub-Saharan Africa- A case study from Olézoa watershed (Yaoundé-Cameroon). J. Hydrol. Reg. Stud. 2021, 37, 100904. [Google Scholar] [CrossRef]
- Aladejana, J.A.; Kalin, R.M.; Sentenac, P.; Hassan, I. Groundwater quality index as a hydrochemical tool for monitoring saltwater intrusion into coastal freshwater aquifer of Eastern Dahomey Basin, Southwestern Nigeria. Groundw. Sustain. Dev. 2021, 13, 100568. [Google Scholar] [CrossRef]
- Badmus, G.; Ogungbemi, O.; Enuiyin, O.; Adeyeye, J.; Ogunyemi, A. Delineation of leachate plume migration and appraisal of heavy metals in groundwater around Emirin dumpsite, Ado-Ekiti, Nigeria. Sci. Afr. 2022, 17, e01308. [Google Scholar] [CrossRef]
- Zemour, Y.; Mebrouk, N.; Mayer, A.; Mekebret, I.; Sherif, M.I. Hydrochemical and geological controls on dissolved radium and radon in northwestern Algeria hydrothermal groundwaters. Chemosphere 2023, 313, 137573. [Google Scholar] [CrossRef]
- Mladenov, N.; Parsons, D.; Kinoshita, A.M.; Pinongcos, F.; Mueller, M.; Garcia, D.; Lipson, D.A.; Grijalva, L.M.; Zink, T.A. Groundwater-surface water interactions and flux of organic matter and nutrients in an urban, Mediterranean stream. Sci. Total. Environ. 2021, 811, 152379. [Google Scholar] [CrossRef] [PubMed]
- Osiakwan, G.M.; Appiah-Adjei, E.K.; Kabo-Bah, A.T.; Gibrilla, A.; Anornu, G. Assessment of groundwater quality and the controlling factors in coastal aquifers of Ghana: An integrated statistical, geostatistical and hydrogeochemical approach. J. Afr. Earth Sci. 2021, 184, 104371. [Google Scholar] [CrossRef]
- Fu, T.; Li, C.; Wang, Z.; Qi, C.; Chen, G.; Fu, Y.; Su, Q.; Xu, X.; Liu, W.; Yu, H. Hydrochemical characteristics and quality assessment of groundwater in Guangxi coastal areas, China. Mar. Pollut. Bull. 2023, 188, 114564. [Google Scholar] [CrossRef]
- Piper, A.M. A graphic procedure in the geochemical interpretation of water-analyses. Eos Trans. Am. Geophys. Union 1944, 25, 914–928. [Google Scholar] [CrossRef]
- Upchurch, S.; Scott, T.M.; Alfieri, M.C.; Fratesi, B.; Dobecki, T.L. Hydrogeochemistry of Florida Karst Waters. In The Karst Systems of Florida; Cave and Karst Systems of the World; Springer International Publishing: Cham, Switzerland, 2019; pp. 145–206. ISBN 978-3-319-69634-8. [Google Scholar]
- Schoeller, H. Geochemistry of Groundwater. In Groundwater Studies–An International Guide for Research and Practice; Brown, R.H., Konoplyantsev, A.A., Ineson, J., Kovalevsky, V.S., Eds.; UNESCO: Paris, French, 1977; pp. 1–18. [Google Scholar]
- Gueddari, H.; Akodad, M.; Baghour, M.; Moumen, A.; Skalli, A.; El Yousfi, Y.; Ismail, A.; Chahban, M.; Azizi, G.; Hmeid, H.A.; et al. The salinity origin and hydrogeochemical evolution of groundwater in the Oued Kert basin, north-eastern of Morocco. Sci. Afr. 2022, 16, e01226. [Google Scholar] [CrossRef]
- World Health Organization. Guidelines for Drinking Water Quality–Fourth Edition Incorporating the First Addendum; World Health Organization: Geneva, Switzerland, 2017. [Google Scholar]
- Chen, D.; Elhadj, A.; Xu, H.; Xu, X.; Qiao, Z. A Study on the Relationship between Land Use Change and Water Quality of the Mitidja Watershed in Algeria Based on GIS and RS. Sustainability 2020, 12, 3510. [Google Scholar] [CrossRef]
- Ramakrishnaiah, C.R.; Sadashivaiah, C.; Ranganna, G. Assessment of Water Quality Index for the Groundwater in Tumkur Taluk, Karnataka State, India. E-J. Chem. 2009, 6, 523–530. [Google Scholar] [CrossRef]
- Ismail, E.; Abdelhalim, A.; Heleika, M.A. Hydrochemical characteristics and quality assessment of groundwater aquifers northwest of Assiut district, Egypt. J. Afr. Earth Sci. 2021, 181, 104260. [Google Scholar] [CrossRef]
- Kothari, V.; Vij, S.; Sharma, S.; Gupta, N. Correlation of various water quality parameters and water quality index of districts of Uttarakhand. Environ. Sustain. Indic. 2020, 9, 100093. [Google Scholar] [CrossRef]
- Nong, X.; Shao, D.; Xiao, Y.; Zhong, H. Spatio-Temporal Characterization Analysis and Water Quality Assessment of the South-to-North Water Diversion Project of China. Int. J. Environ. Res. Public Health 2019, 16, 2227. [Google Scholar] [CrossRef] [PubMed]
- Xu, S.; Frey, S.; Erler, A.; Khader, O.; Berg, S.; Hwang, H.; Callaghan, M.; Davison, J.; Sudicky, E. Investigating groundwater-lake interactions in the Laurentian Great Lakes with a fully-integrated surface water-groundwater model. J. Hydrol. 2021, 594, 125911. [Google Scholar] [CrossRef]
- El Osta, M.; Masoud, M.; Alqarawy, A.; Elsayed, S.; Gad, M. Groundwater Suitability for Drinking and Irrigation Using Water Quality Indices and Multivariate Modeling in Makkah Al-Mukarramah Province, Saudi Arabia. Water 2022, 14, 483. [Google Scholar] [CrossRef]


| Points | Long | Lat |
|---|---|---|
| R1 | −5.67463746° | 35.66688479° |
| R2 | −5.67766835° | 35.66541206° |
| R3 | −5.68093907° | 35.66351440° |
| R4 | −5.68364274° | 35.66088328° |
| R5 | −5.68626245° | 35.65523154° |
| R6 | −5.68576545° | 35.65334556° |
| R7 | −5.68819553° | 35.65227545° |
| R8 | −5.68982623° | 35.64715242° |
| R9 | −5.69294471° | 35.64394728° |
| R10 | −5.69726585° | 35.64224707° |
| R11 | −5.70137617° | 35.63777176° |
| P1 | −5.68275827° | 35.66043753° |
| P2 | −5.68265338° | 35.66000167° |
| P3 | −5.68549656° | 35.65540978° |
| P4 | −5.68530379° | 35.65319523 ° |
| P5 | −5.68832221° | 35.65258791° |
| P6 | −5.68988600° | 35.64719612° |
| P7 | −5.69093475° | 35.64789468° |
| P8 | −5.69290863° | 35.64402414° |
| P9 | −5.69721983° | 35.64247992° |
| Parameters | Analytical Method | Unit | Maximum Allowable Values WHO | Moroccan Standard [74,75] |
|---|---|---|---|---|
| pH | pH meter | --- | 6.5 < pH < 8.5 | 6.5 < pH < 9 |
| T | Thermometer | °C | T° < 25 | T° < 30 |
| EC | Conductimeter | µS/cm | 2700 | 2700 |
| DO | Oximeter | mg/L | 5 < O2 < 8 | 5 < O2 < 8 |
| TURB | Turbidimetry | NFU | 5 | 5 |
| Ca2+ | Titrimetric technique | mg/L | 75 | 75 |
| Mg2+ | Complexometry with E.D.T.A. (0.02 N) | mg/L | 50 | 50 |
| Na+ | Flame photometer | mg/L | 200 | 200 |
| K+ | photometer | mg/L | 50 | 50 |
| Cl− | Mohr’s method | mg/L | 250 | 300 |
| HCO3− | Acido-basic titration (HCl 0.05 N) | mg/L | 120 | 120 |
| CO32− | mg/L | 100 | 100 | |
| NO32− | Steam distillation | mg/L | 50 | 50 |
| SO42− | Nephelometric method | mg/L | 250 | 200 |
| TDS | mg/L | 500 | 500 | |
| TH | mg/L | 400 | 400 |
| Classes | Classification |
|---|---|
| 0 to 25 | Excellent |
| 26 to 50 | Good |
| 51 to 75 | Poor |
| 76 to 100 | Very poor |
| >100 | Unsuitable for drinking |
| Parameters | Classification | References |
|---|---|---|
| SAR | Excellent, Good, Permissible, Doubtful | [93] |
| RSC | Good, Medium, Bad | [94] |
| Na% | Excellent, Good, Permissible, Doubtful, Unsuitable | [90] |
| PI | Excellent, Good, Unsuitable | [95] |
| KI | Permissible, Non- Permissible | [96] |
| PS | Excellent, Good, | [95] |
| RSBC | Excellent, Good, | [97] |
| MH | Suitable, Unsuitable, | [98] |
| Sampling | T | EC | TDS | pH | DO (mg/L) | Ca2+ (mg/L) | Mg2+ (mg/L) | Na+ (mg/L) | K+ (mg/L) | Cl− (mg/L) | HCO3− (mg/L) | CO32− (mg/L) | NO3− (mg/L) | SO42− (mg/L) | TURB | TH |
|---|---|---|---|---|---|---|---|---|---|---|---|---|---|---|---|---|
| R1 | 17.00 | 1157.0 | 740.5 | 7.08 | 8.30 | 36.0 | 16.8 | 135.5 | 12.48 | 153.3 | 7.63 | 67.50 | 18.00 | 113.09 | 30.50 | 159.07 |
| R2 | 17.40 | 1205.0 | 771.2 | 7.17 | 6.82 | 44.0 | 16.8 | 126.6 | 11.80 | 152.3 | 7.63 | 78.75 | 18.00 | 96.31 | 45.20 | 179.05 |
| R3 | 20.10 | 1142.0 | 730.9 | 7.31 | 7.01 | 44.0 | 19.2 | 119.7 | 10.73 | 149.1 | 7.63 | 71.25 | 24.00 | 101.66 | 30.20 | 188.93 |
| R4 | 19.00 | 1072.0 | 686.1 | 6.91 | 7.00 | 44.0 | 16.8 | 114.7 | 9.75 | 148.1 | 7.63 | 56.25 | 36.00 | 96.38 | 21.50 | 179.05 |
| R5 | 18.60 | 1161.0 | 743.0 | 7.04 | 6.76 | 44.0 | 18.0 | 71.2 | 9.46 | 149.5 | 7.63 | 67.50 | 36.00 | 0.00 | 22.40 | 183.99 |
| R6 | 19.10 | 1188.0 | 760.3 | 7.09 | 6.11 | 52.0 | 15.6 | 128.6 | 10.34 | 151.2 | 7.63 | 56.25 | 30.00 | 140.88 | 19.00 | 194.08 |
| R7 | 20.30 | 1182.0 | 756.5 | 6.97 | 6.5 | 48.0 | 21.6 | 129.6 | 10.24 | 163.8 | 7.63 | 63.75 | 30.00 | 127.94 | 19.20 | 208.80 |
| R8 | 19.80 | 1061.0 | 679.0 | 7.08 | 6.4 | 40.0 | 10.8 | 117.7 | 10.73 | 160.0 | 7.63 | 71.25 | 30.00 | 34.66 | 20.10 | 144.35 |
| R9 | 20.10 | 1053.0 | 673.9 | 7.12 | 6.7 | 40.0 | 12.0 | 123.6 | 10.92 | 144.6 | 7.63 | 67.50 | 30.00 | 79.20 | 17.60 | 149.30 |
| R10 | 20.50 | 884.0 | 565.8 | 7.09 | 6.2 | 32.0 | 18.0 | 87.0 | 7.70 | 152.6 | 7.63 | 67.50 | 30.00 | 0.00 | 17.80 | 154.03 |
| R11 | 20.70 | 878.0 | 561.9 | 7.20 | 7.4 | 36.0 | 13.2 | 82.1 | 7.51 | 164.5 | 15.25 | 37.50 | 36.00 | 0.00 | 16.90 | 144.25 |
| Average | 19.33 | 1089.36 | 697.19 | 7.10 | 6.8 | 41.8 | 16.3 | 112.4 | 10.1 | 153.5 | 8.3 | 64.1 | 28.9 | 71.8 | 23.67 | 171.4 |
| Max | 20.70 | 1205.0 | 771.2 | 7.31 | 8.3 | 52.0 | 21.6 | 135.5 | 12.5 | 164.5 | 15.3 | 78.8 | 36.0 | 140.9 | 45.20 | 208.8 |
| Min | 17.00 | 878.0 | 561.9 | 6.91 | 6.1 | 32.0 | 10.8 | 71.2 | 7.5 | 144.6 | 7.6 | 37.5 | 18.0 | 0.0 | 16.90 | 144.2 |
| Sampling | T | EC | TDS | pH | DO (mg/L) | Ca2+ (mg/L) | Mg2+ (mg/L) | Na+ (mg/L) | K+ (mg/L) | Cl− (mg/L) | HCO3− (mg/L) | CO32− (mg/L) | NO3− (mg/L) | SO42− (mg/L) | TURB | TH |
|---|---|---|---|---|---|---|---|---|---|---|---|---|---|---|---|---|
| P1 | 16.20 | 806.0 | 515.8 | 7.39 | 7.6 | 32.0 | 24.0 | 55.5 | 0.68 | 152.3 | 7.63 | 48.75 | 24.00 | 0.00 | 4.30 | 178.736 |
| P2 | 16.80 | 1262.0 | 807.7 | 6.91 | 6.3 | 32.0 | 36.0 | 98.9 | 0.39 | 231.0 | 7.63 | 37.50 | 36.00 | 16.08 | 4.10 | 228.152 |
| P3 | 17.30 | 824.0 | 527.4 | 6.92 | 6.5 | 16.0 | 24.0 | 72.2 | 2.15 | 189.4 | 7.63 | 26.25 | 24.00 | 0.00 | 3.40 | 138.784 |
| P4 | 16.90 | 1509.0 | 965.8 | 7.70 | 7.5 | 44.0 | 28.8 | 146.4 | 2.24 | 389.2 | 7.63 | 33.75 | 30.00 | 0.00 | 2.90 | 228.4664 |
| P5 | 17.20 | 1198.0 | 766.7 | 7.29 | 7.0 | 60.0 | 31.2 | 65.3 | 1.66 | 174.7 | 15.25 | 78.75 | 30.00 | 5.54 | 3.10 | 278.3016 |
| P6 | 18.50 | 1768.0 | 1131.5 | 7.39 | 6.8 | 80.0 | 44.4 | 191.9 | 4.49 | 171.9 | 22.88 | 78.75 | 36.00 | 367.06 | 3.30 | 382.5992 |
| P7 | 17.10 | 1355.0 | 867.2 | 7.79 | 6.3 | 56.0 | 50.4 | 117.7 | 2.24 | 197.1 | 15.25 | 75.00 | 18.00 | 167.74 | 5.40 | 347.3792 |
| P8 | 18.20 | 1688.0 | 1080.3 | 7.57 | 6.7 | 60.0 | 50.4 | 64.3 | 5.07 | 169.4 | 30.50 | 93.75 | 12.00 | 70.08 | 5.80 | 357.3672 |
| P9 | 18.10 | 1623.0 | 1038.7 | 7.44 | 7.6 | 72.0 | 37.2 | 90.0 | 1.56 | 170.8 | 7.63 | 86.25 | 24.00 | 113.90 | 5.90 | 332.9736 |
| Average | 17.37 | 1337.0 | 855.7 | 7.38 | 6.9 | 50.2 | 36.3 | 100.2 | 2.3 | 205.1 | 13.6 | 62.1 | 26.0 | 82.3 | 4.24 | 274.8 |
| Max | 18.50 | 1768.0 | 1131.5 | 7.79 | 7.6 | 80.0 | 50.4 | 191.9 | 5.1 | 389.2 | 30.5 | 93.8 | 36.0 | 367.1 | 5.90 | 382.6 |
| Min | 16.20 | 806.0 | 515.8 | 6.91 | 6.3 | 16.0 | 24.0 | 55.5 | 0.4 | 152.3 | 7.6 | 26.3 | 12.0 | 0.0 | 2.90 | 138.8 |
| Samples River | WQI Score | Classification | Samples Wells | WQI Score | Classification |
|---|---|---|---|---|---|
| R1 | 165.497266 | Unsuitable | P1 | 59.6085173 | Poor |
| R2 | 208.221093 | Unsuitable | P2 | 74.295544 | Poor |
| R3 | 160.598102 | Unsuitable | P3 | 55.5992429 | Poor |
| R4 | 134.61429 | Unsuitable | P4 | 78.246694 | Very poor |
| R5 | 133.754536 | Unsuitable | P5 | 67.5059323 | Poor |
| R6 | 132.447409 | Unsuitable | P6 | 102.009686 | Unsuitable |
| R7 | 130.996801 | Unsuitable | P7 | 87.2619479 | Very poor |
| R8 | 124.981967 | Unsuitable | P8 | 88.2725732 | Very poor |
| R9 | 120.361114 | Unsuitable | P9 | 90.8769462 | Very poor |
| R10 | 111.714051 | Unsuitable | |||
| R11 | 112.648884 | Unsuitable |
| Samples | SAR | RSC | Na% | PI | KI | PS | RSBC | MH |
|---|---|---|---|---|---|---|---|---|
| R1 | 6..59 | −0.83 | 66.00 | 68.69 | 1.84 | 5.56 | −1.68 | 43.75 |
| R2 | 5.80 | −0.85 | 61.73 | 64.34 | 1.53 | 5.35 | −2.08 | 38.89 |
| R3 | 5.34 | −1.30 | 59.04 | 61.72 | 1.37 | 5.32 | −2.08 | 42.11 |
| R4 | 5.26 | −1.60 | 59.27 | 62.20 | 1.39 | 5.23 | −2.08 | 38.89 |
| R5 | 3.22 | −1.33 | 47.43 | 50.76 | 0.84 | 4.27 | −2.08 | 40.54 |
| R6 | 5.66 | −1.90 | 60.02 | 62.63 | 1.43 | 5.79 | −2.48 | 33.33 |
| R7 | 5.50 | −1.95 | 58.40 | 60.88 | 1.34 | 6.01 | −2.28 | 42.86 |
| R8 | 6.01 | −0.40 | 65.03 | 68.24 | 1.76 | 4.93 | −1.88 | 31.03 |
| R9 | 6.21 | −0.63 | 65.34 | 68.40 | 1.79 | 4.96 | −1.88 | 33.33 |
| R10 | 4.30 | −0.73 | 56.22 | 60.10 | 1.22 | 4.36 | −1.48 | 48.39 |
| R11 | 4.19 | −1.40 | 56.47 | 62.90 | 1.23 | 4.70 | −1.55 | 37.93 |
| P1 | 2.54 | −1.85 | 40.30 | 46.00 | 0.67 | 4.35 | −1.48 | 55.56 |
| P2 | 4.01 | −3.23 | 48.37 | 52.29 | 0.93 | 6.77 | −1.48 | 65.22 |
| P3 | 3.75 | −1.80 | 53.29 | 58.81 | 1.12 | 5.41 | −0.68 | 71.43 |
| P4 | 5.93 | −3.35 | 58.26 | 61.27 | 1.38 | 11.12 | −2.08 | 52.17 |
| P5 | 2.40 | −2.73 | 33.97 | 39.56 | 0.51 | 5.05 | −2.75 | 46.43 |
| P6 | 6.01 | −4.70 | 52.34 | 55.82 | 1.08 | 8.73 | −3.63 | 48.05 |
| P7 | 3.87 | −4.25 | 42.50 | 46.36 | 0.73 | 7.38 | −2.55 | 60.00 |
| P8 | 2.08 | −3.58 | 28.89 | 35.04 | 0.39 | 5.57 | −2.50 | 58.33 |
| P9 | 3.02 | −3.70 | 37.11 | 40.20 | 0.58 | 6.07 | −3.48 | 46.27 |
| Variables | T | EC | TDS | pH | DO | Ca | Mg | Na | K | Cl | HCO3 | CO3 | NO3 | SO4 | TH |
|---|---|---|---|---|---|---|---|---|---|---|---|---|---|---|---|
| T | 1 | ||||||||||||||
| EC | −0.224 | 1 | |||||||||||||
| TDS | −0.224 | 1.000 | 1 | ||||||||||||
| pH | −0.327 | 0.566 | 0.566 | 1 | |||||||||||
| DO | −0.721 | −0.069 | −0.069 | 0.198 | 1 | ||||||||||
| Ca | 0.001 | 0.834 | 0.834 | 0.520 | −0.236 | 1 | |||||||||
| Mg | −0.476 | 0.729 | 0.729 | 0.652 | 0.327 | 0.578 | 1 | ||||||||
| Na | 0.136 | 0.427 | 0.427 | 0.083 | −0.176 | 0.360 | 0.002 | 1 | |||||||
| K | 0.605 | −0.242 | −0.242 | −0.450 | −0.596 | −0.133 | −0.690 | 0.344 | 1 | ||||||
| Cl | −0.406 | 0.335 | 0.335 | 0.435 | 0.254 | −0.029 | 0.297 | 0.217 | −0.484 | 1 | |||||
| HCO3 | −0.043 | 0.567 | 0.567 | 0.495 | −0.078 | 0.553 | 0.685 | −0.026 | −0.258 | −0.030 | 1 | ||||
| CO3 | 0.132 | 0.519 | 0.519 | 0.318 | −0.387 | 0.703 | 0.322 | 0.091 | 0.236 | −0.451 | 0.435 | 1 | |||
| NO3 | 0.367 | −0.185 | −0.185 | −0.450 | −0.172 | −0.046 | −0.332 | 0.163 | 0.011 | 0.085 | −0.259 | −0.419 | 1 | ||
| SO4 | 0.071 | 0.593 | 0.593 | 0.217 | −0.101 | 0.694 | 0.382 | 0.747 | 0.144 | −0.194 | 0.366 | 0.453 | −0.044 | 1 | |
| TH | −0.310 | 0.867 | 0.867 | 0.670 | 0.102 | 0.847 | 0.924 | 0.171 | −0.512 | 0.180 | 0.706 | 0.541 | −0.238 | 0.575 | 1 |
Disclaimer/Publisher’s Note: The statements, opinions and data contained in all publications are solely those of the individual author(s) and contributor(s) and not of MDPI and/or the editor(s). MDPI and/or the editor(s) disclaim responsibility for any injury to people or property resulting from any ideas, methods, instructions or products referred to in the content. |
© 2023 by the authors. Licensee MDPI, Basel, Switzerland. This article is an open access article distributed under the terms and conditions of the Creative Commons Attribution (CC BY) license (https://creativecommons.org/licenses/by/4.0/).
Share and Cite
Azzirgue, E.M.; Cherif, E.K.; El Azhari, H.; Dakak, H.; Yachou, H.; Ghanimi, A.; Nouayti, N.; Esteves da Silva, J.; Salmoun, F. Interactions Evaluation between the Jouamaa Hakama Groundwater and Ouljat Echatt River in the North of Morocco, Using Hydrochemical Modeling, Multivariate Statistics and GIS. Water 2023, 15, 1752. https://doi.org/10.3390/w15091752
Azzirgue EM, Cherif EK, El Azhari H, Dakak H, Yachou H, Ghanimi A, Nouayti N, Esteves da Silva J, Salmoun F. Interactions Evaluation between the Jouamaa Hakama Groundwater and Ouljat Echatt River in the North of Morocco, Using Hydrochemical Modeling, Multivariate Statistics and GIS. Water. 2023; 15(9):1752. https://doi.org/10.3390/w15091752
Chicago/Turabian StyleAzzirgue, El Mustapha, El Khalil Cherif, Hamza El Azhari, Houria Dakak, Hasna Yachou, Ahmed Ghanimi, Nordine Nouayti, Joaquim Esteves da Silva, and Farida Salmoun. 2023. "Interactions Evaluation between the Jouamaa Hakama Groundwater and Ouljat Echatt River in the North of Morocco, Using Hydrochemical Modeling, Multivariate Statistics and GIS" Water 15, no. 9: 1752. https://doi.org/10.3390/w15091752