
Hydrogeochemistry and Isotopic Composition of Waters in the Renella Cave (Central Italy): New Insights into Groundwater Dynamics
 , , , , , and
Abstract
:1. Introduction
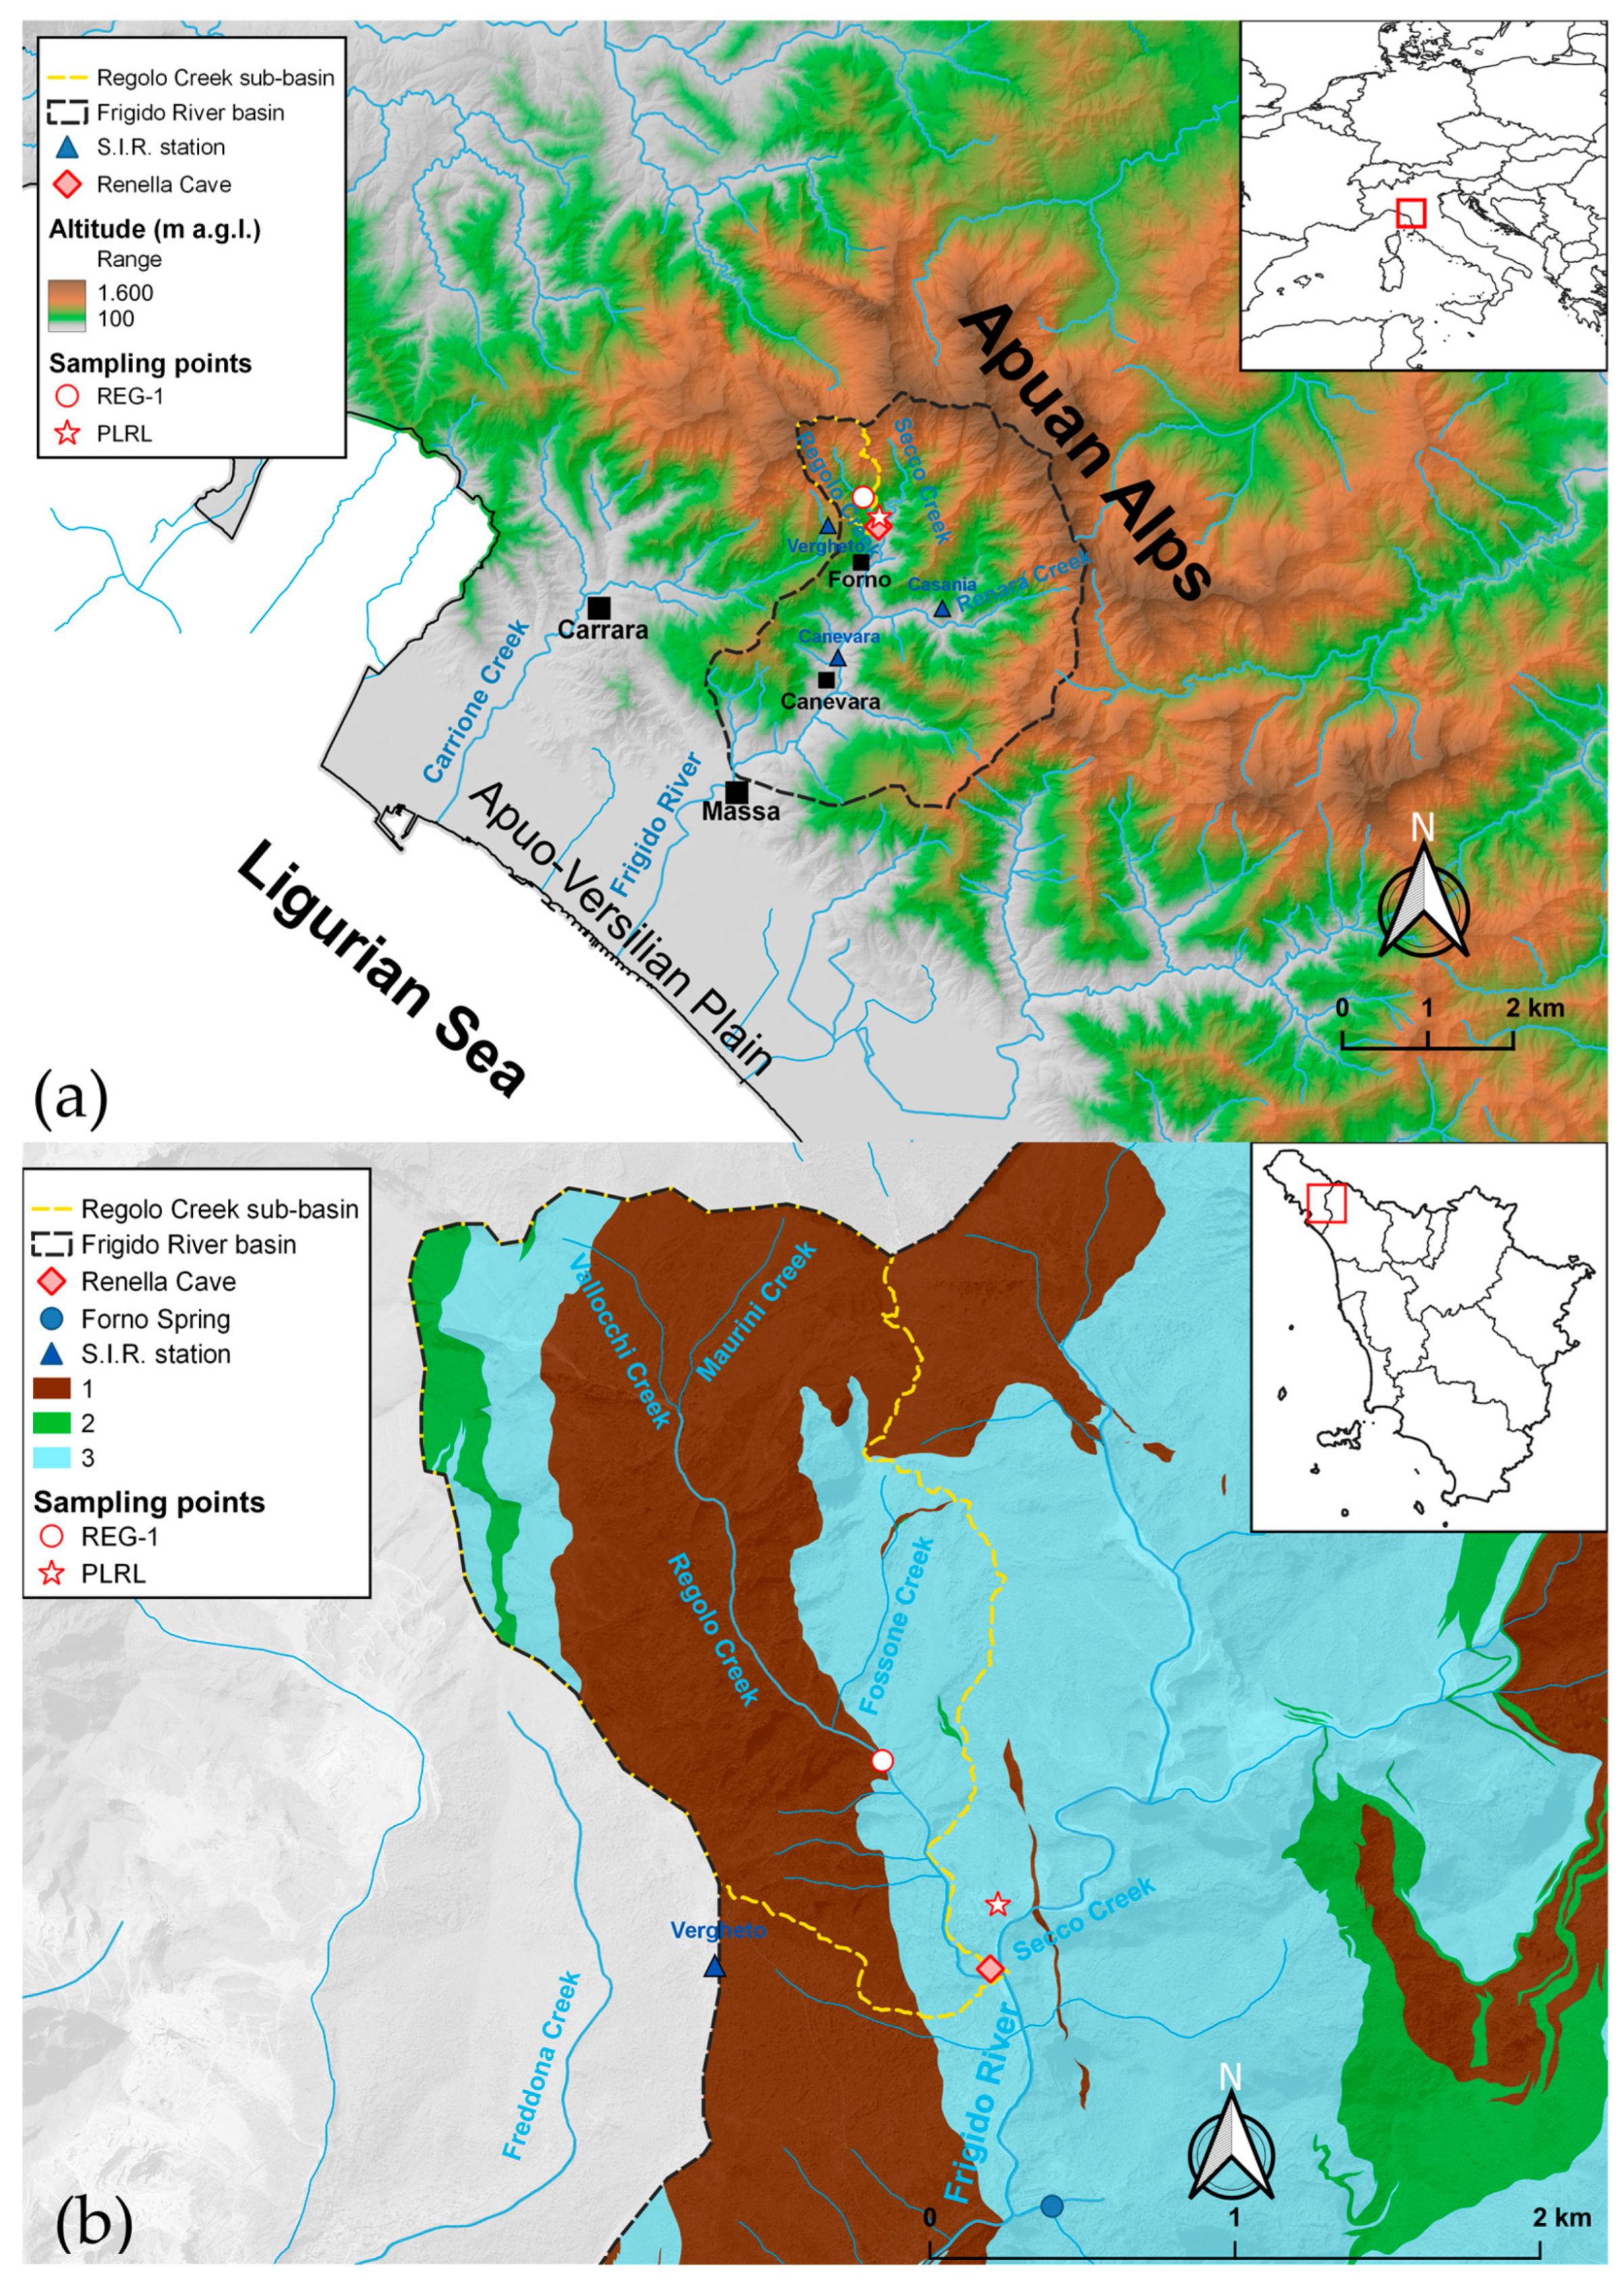
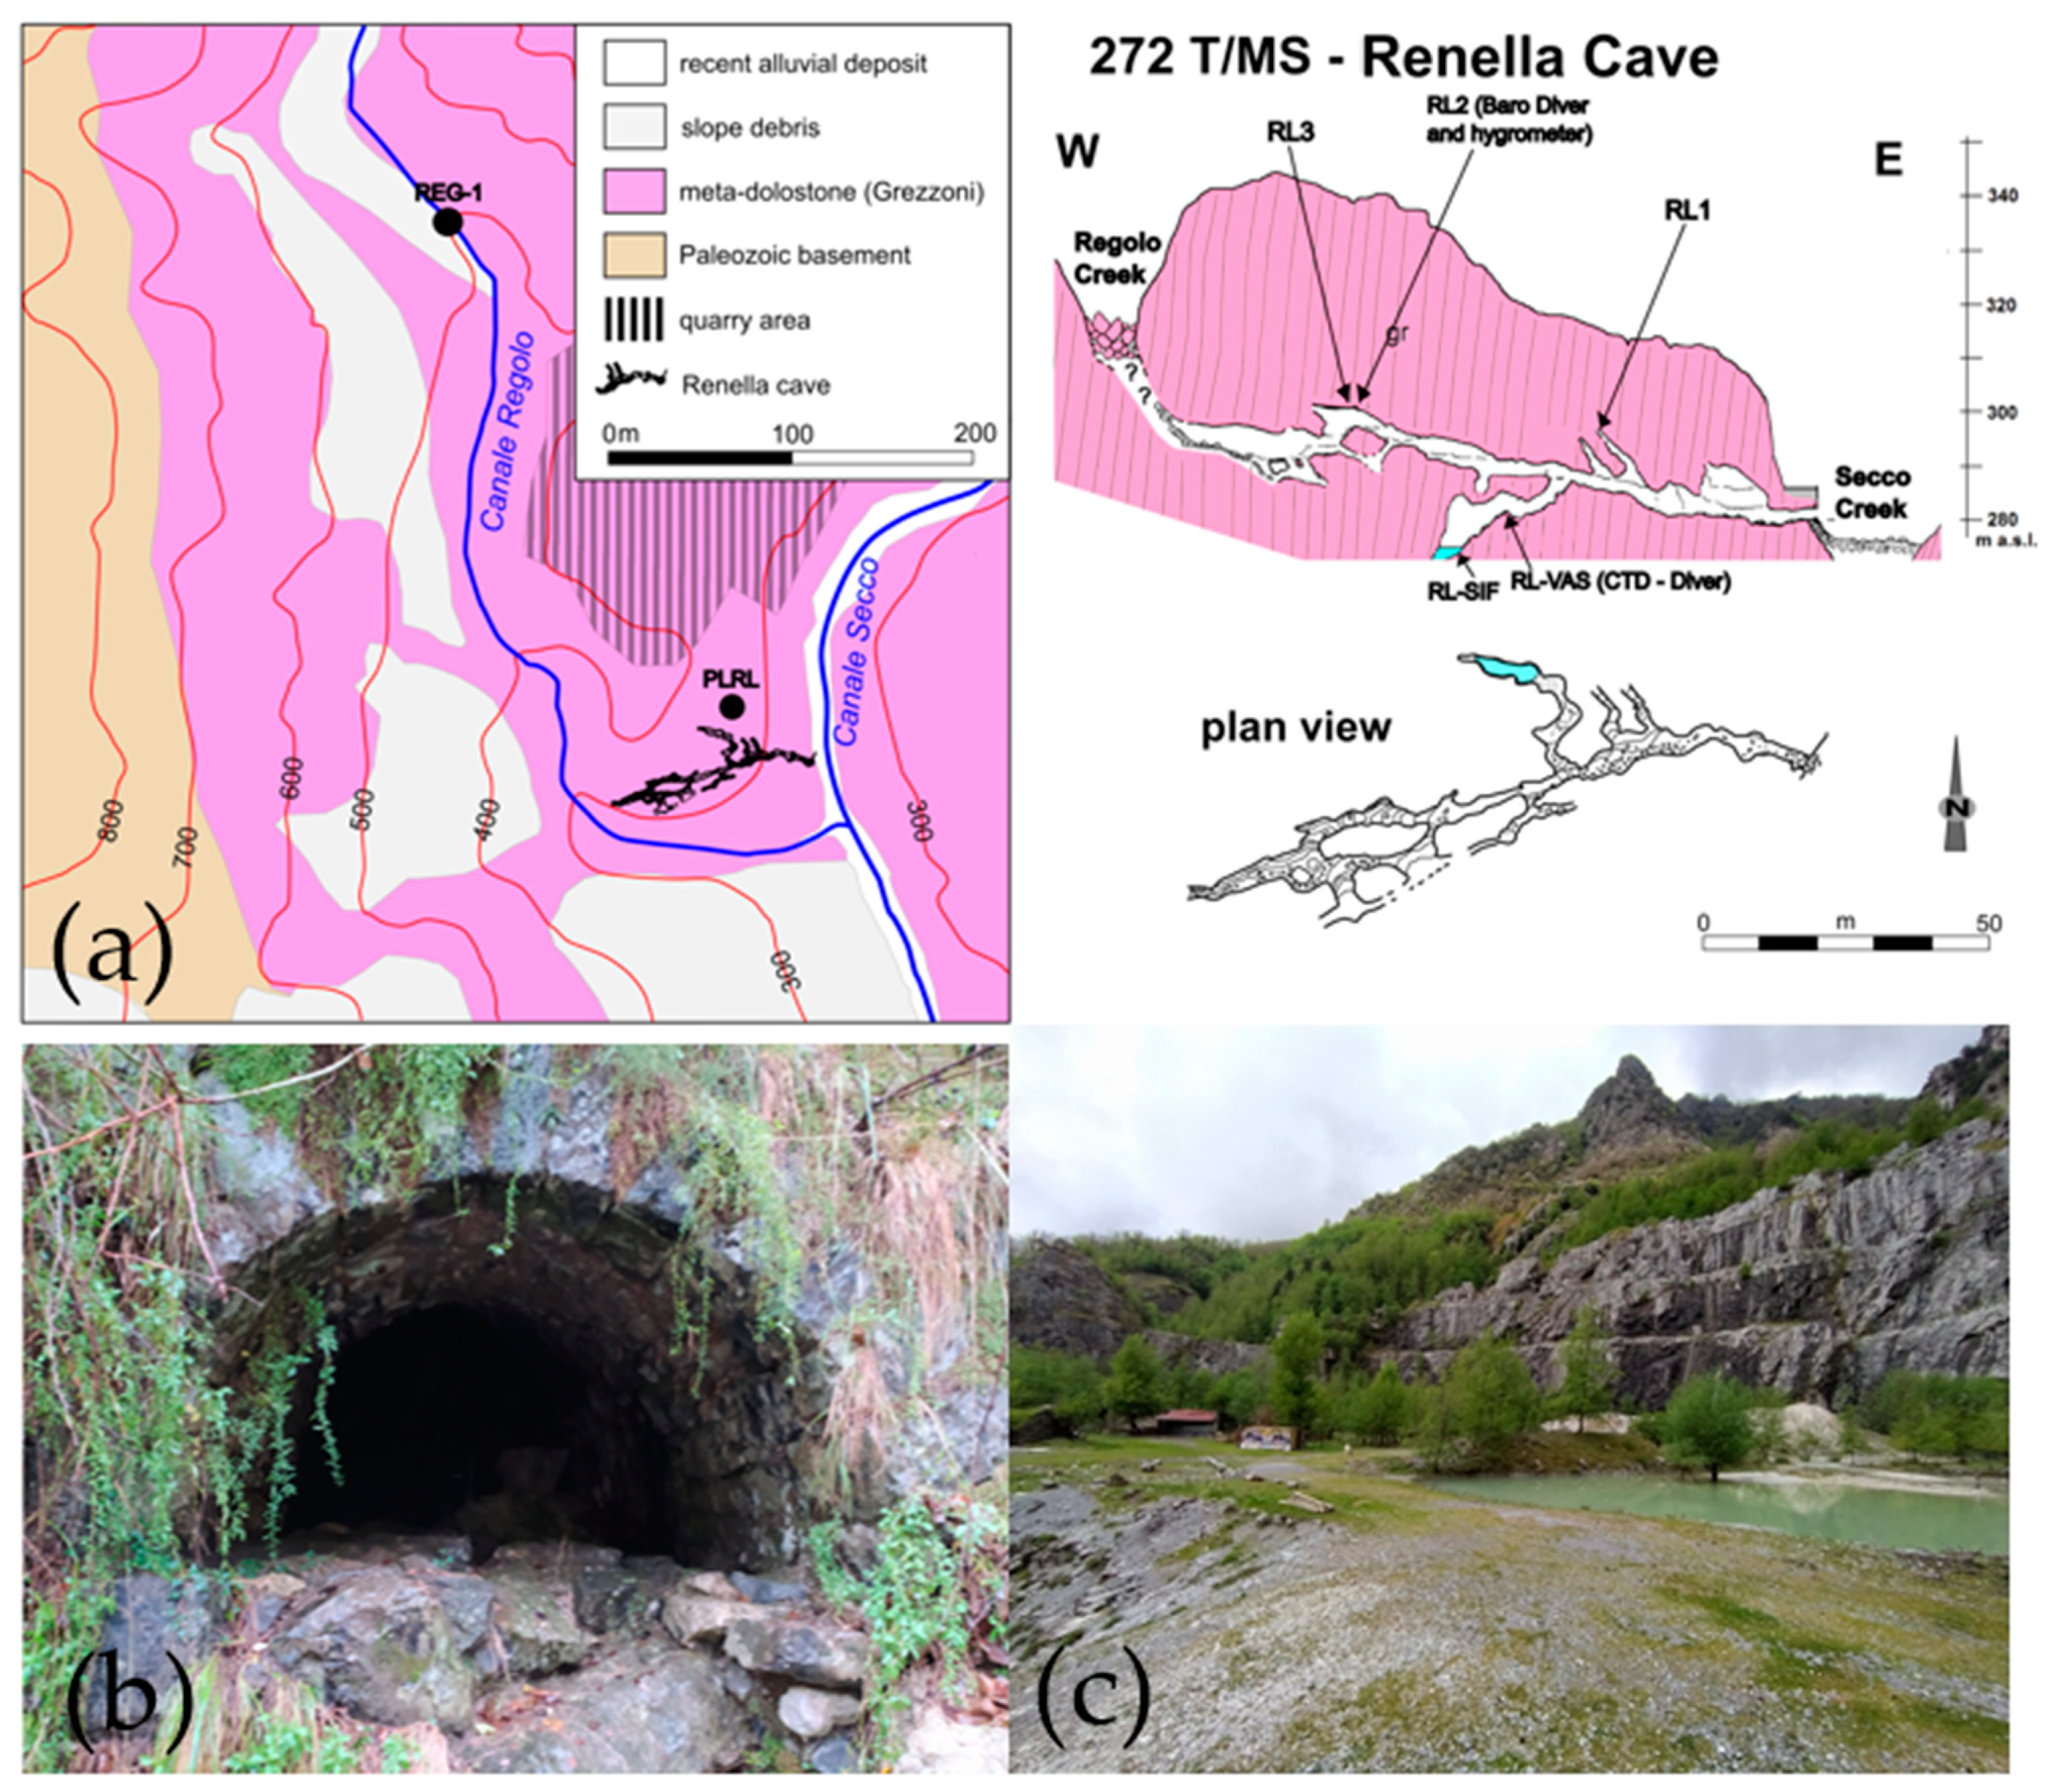
2. Study Area
2.1. Geomorphological and Geological Setting
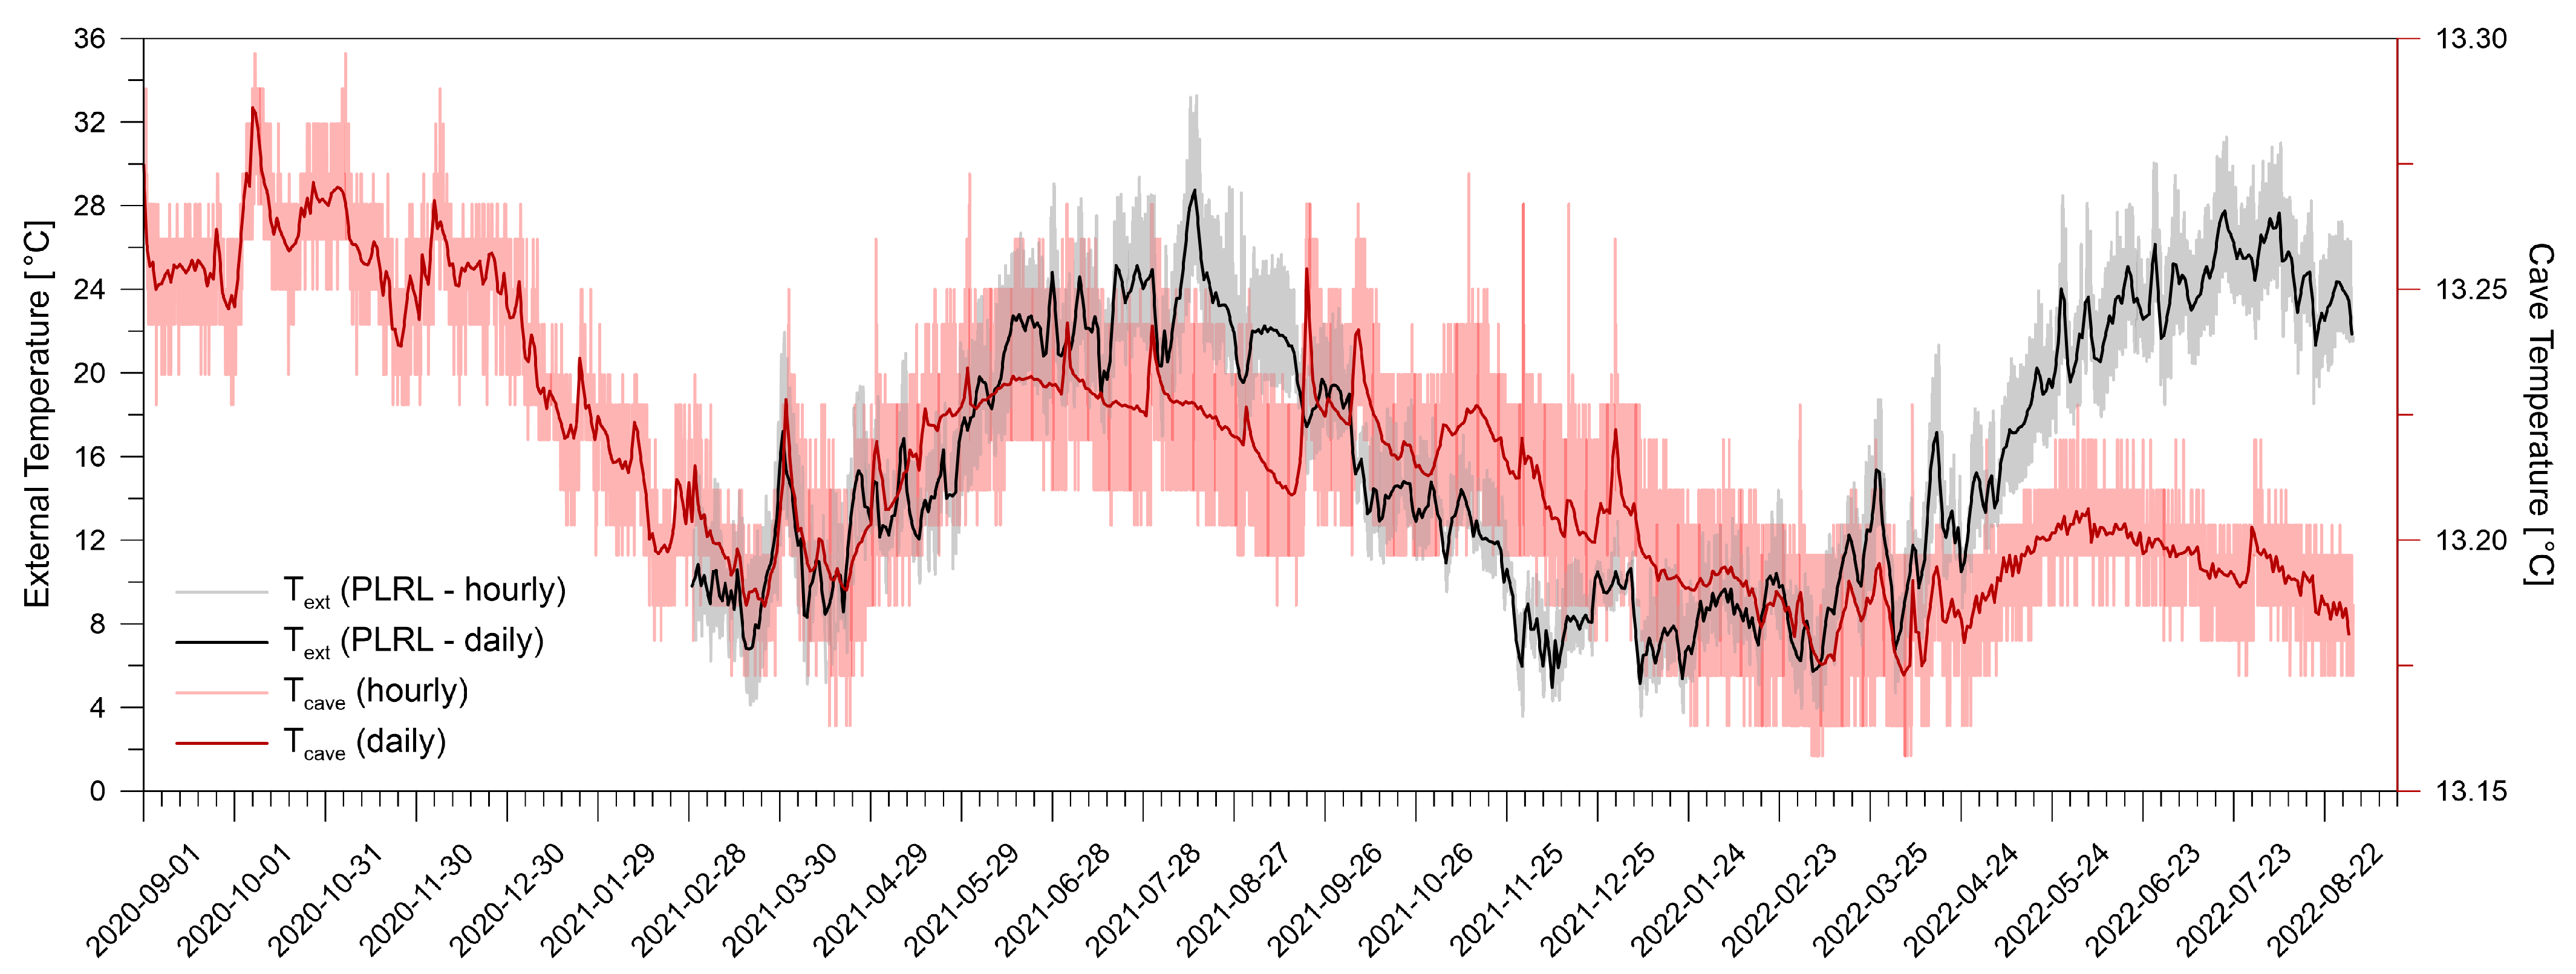
2.2. Local Climate
3. Materials and Methods
3.1. Samples Collection
3.2. Field Measurements
3.3. Laboratory Analysis
4. Results
4.1. Atmospheric and Cave Conditions
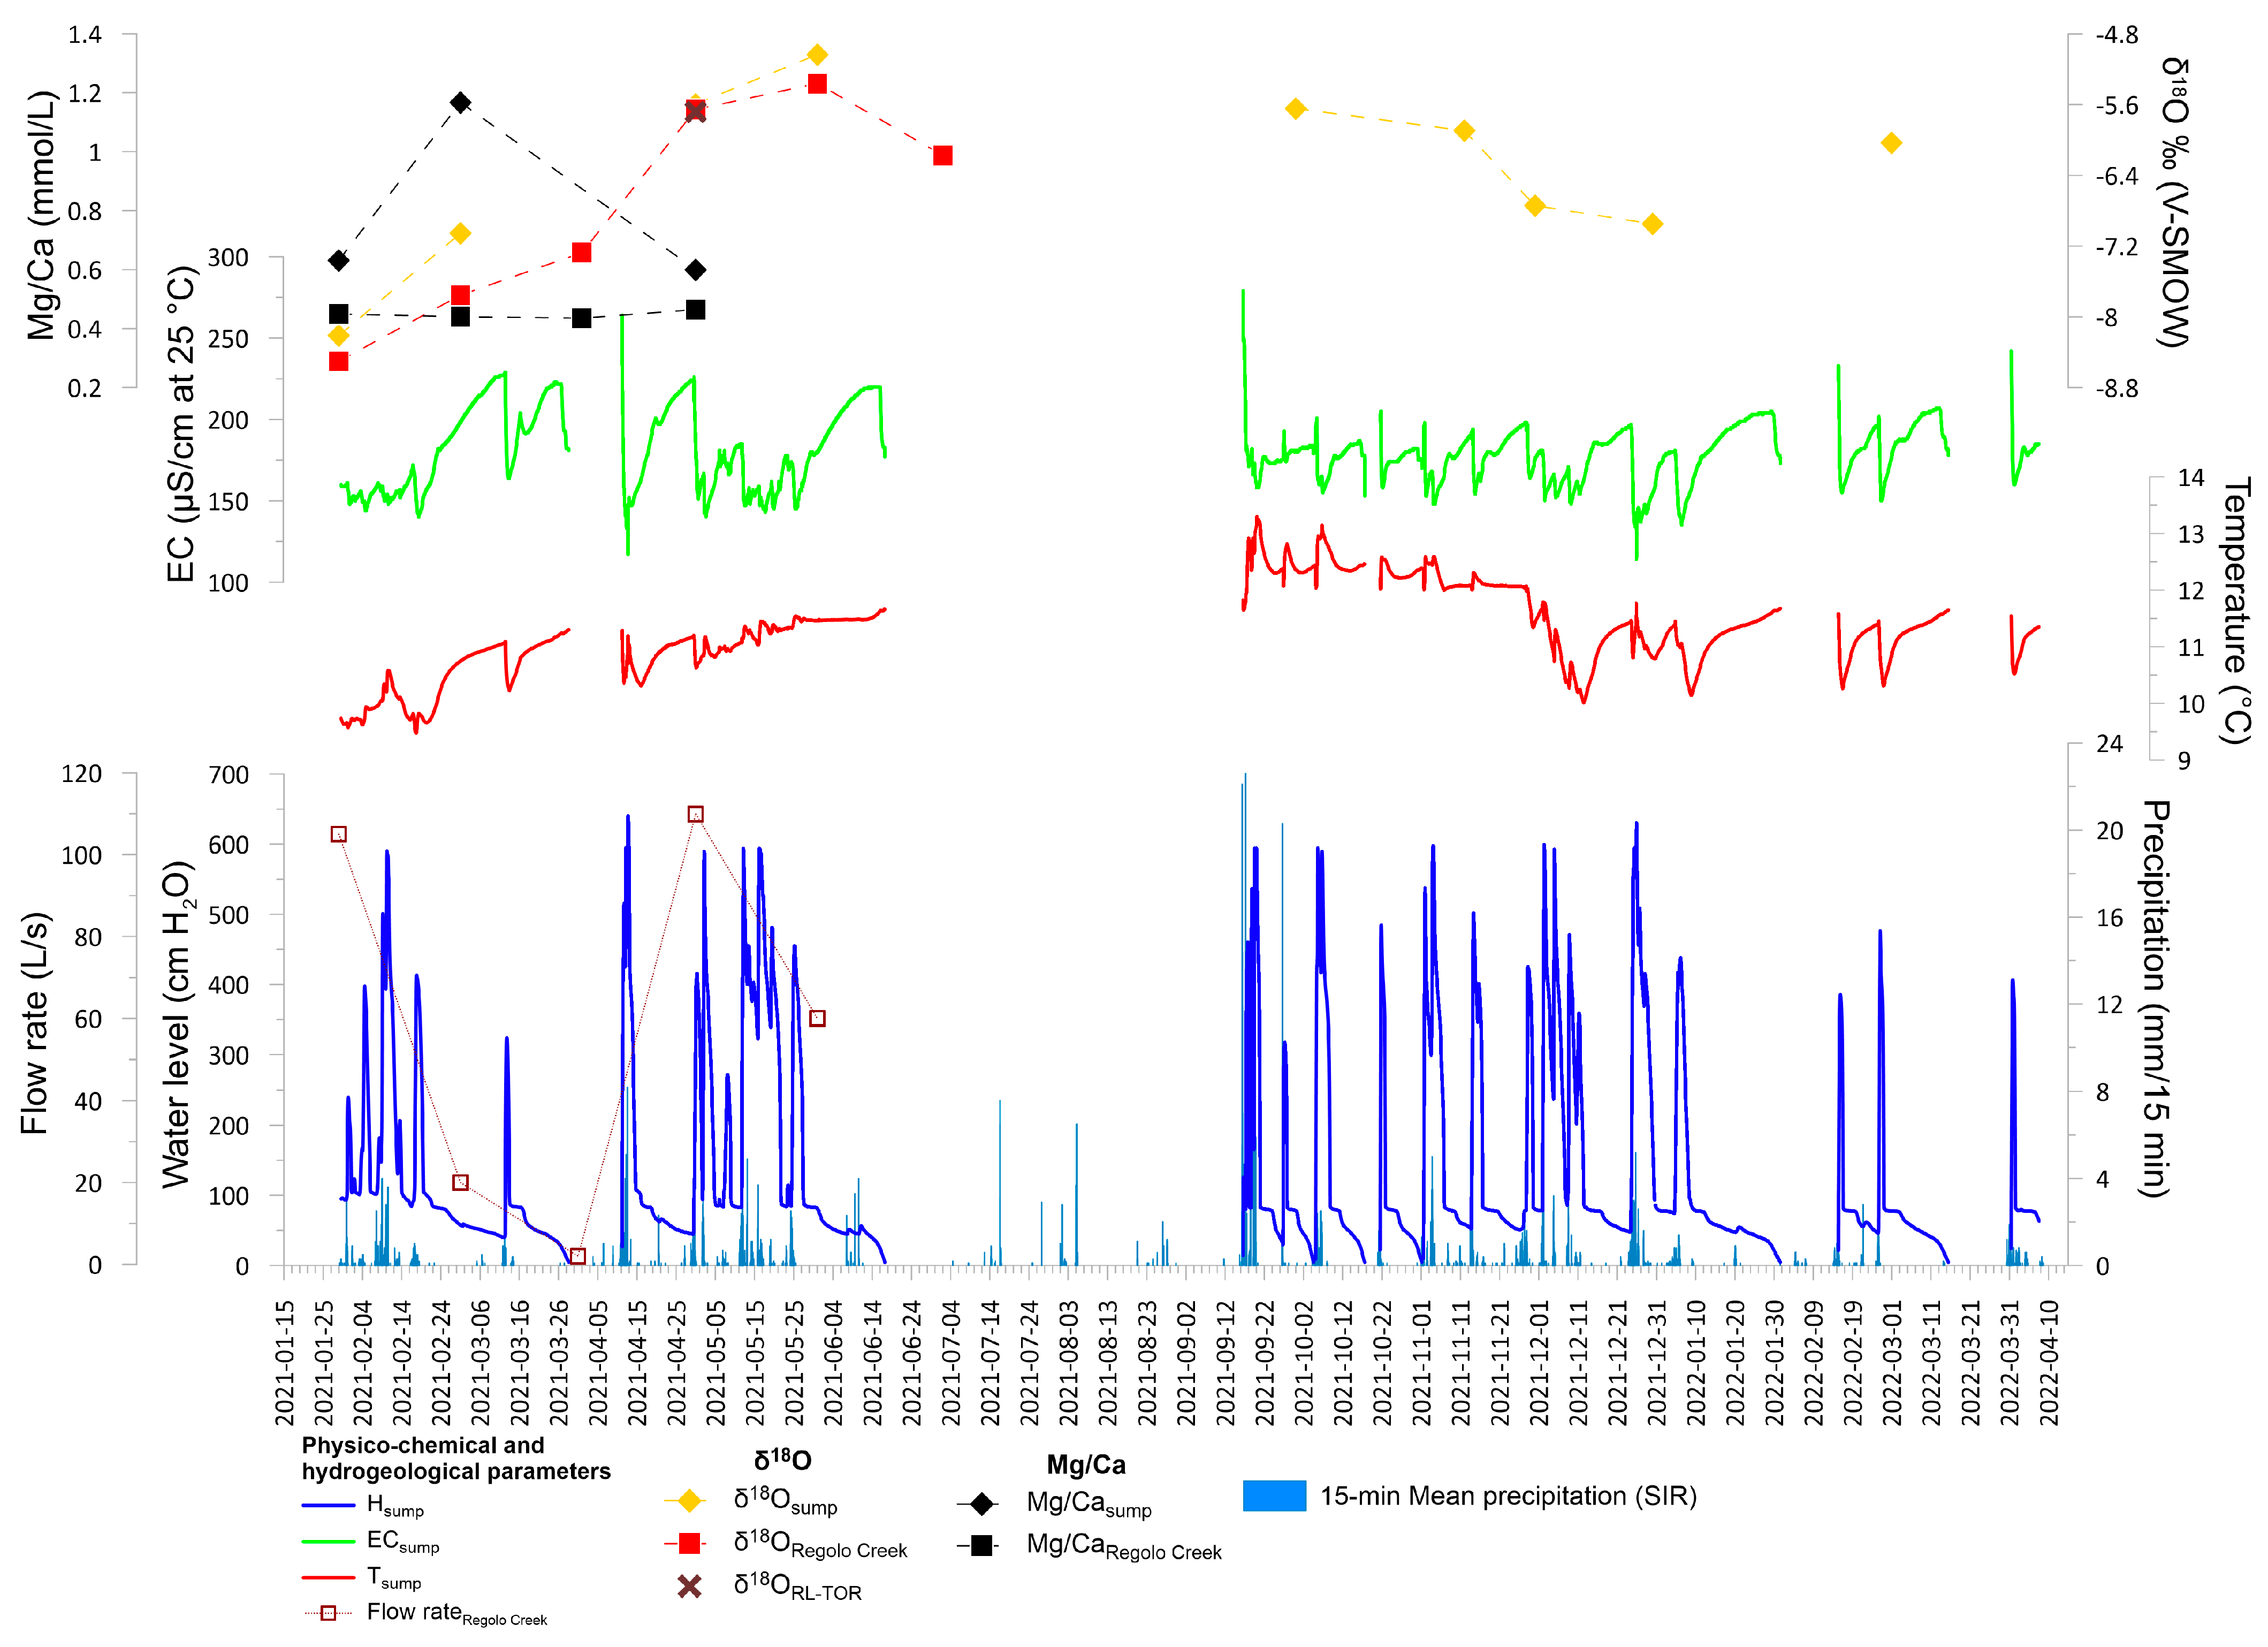
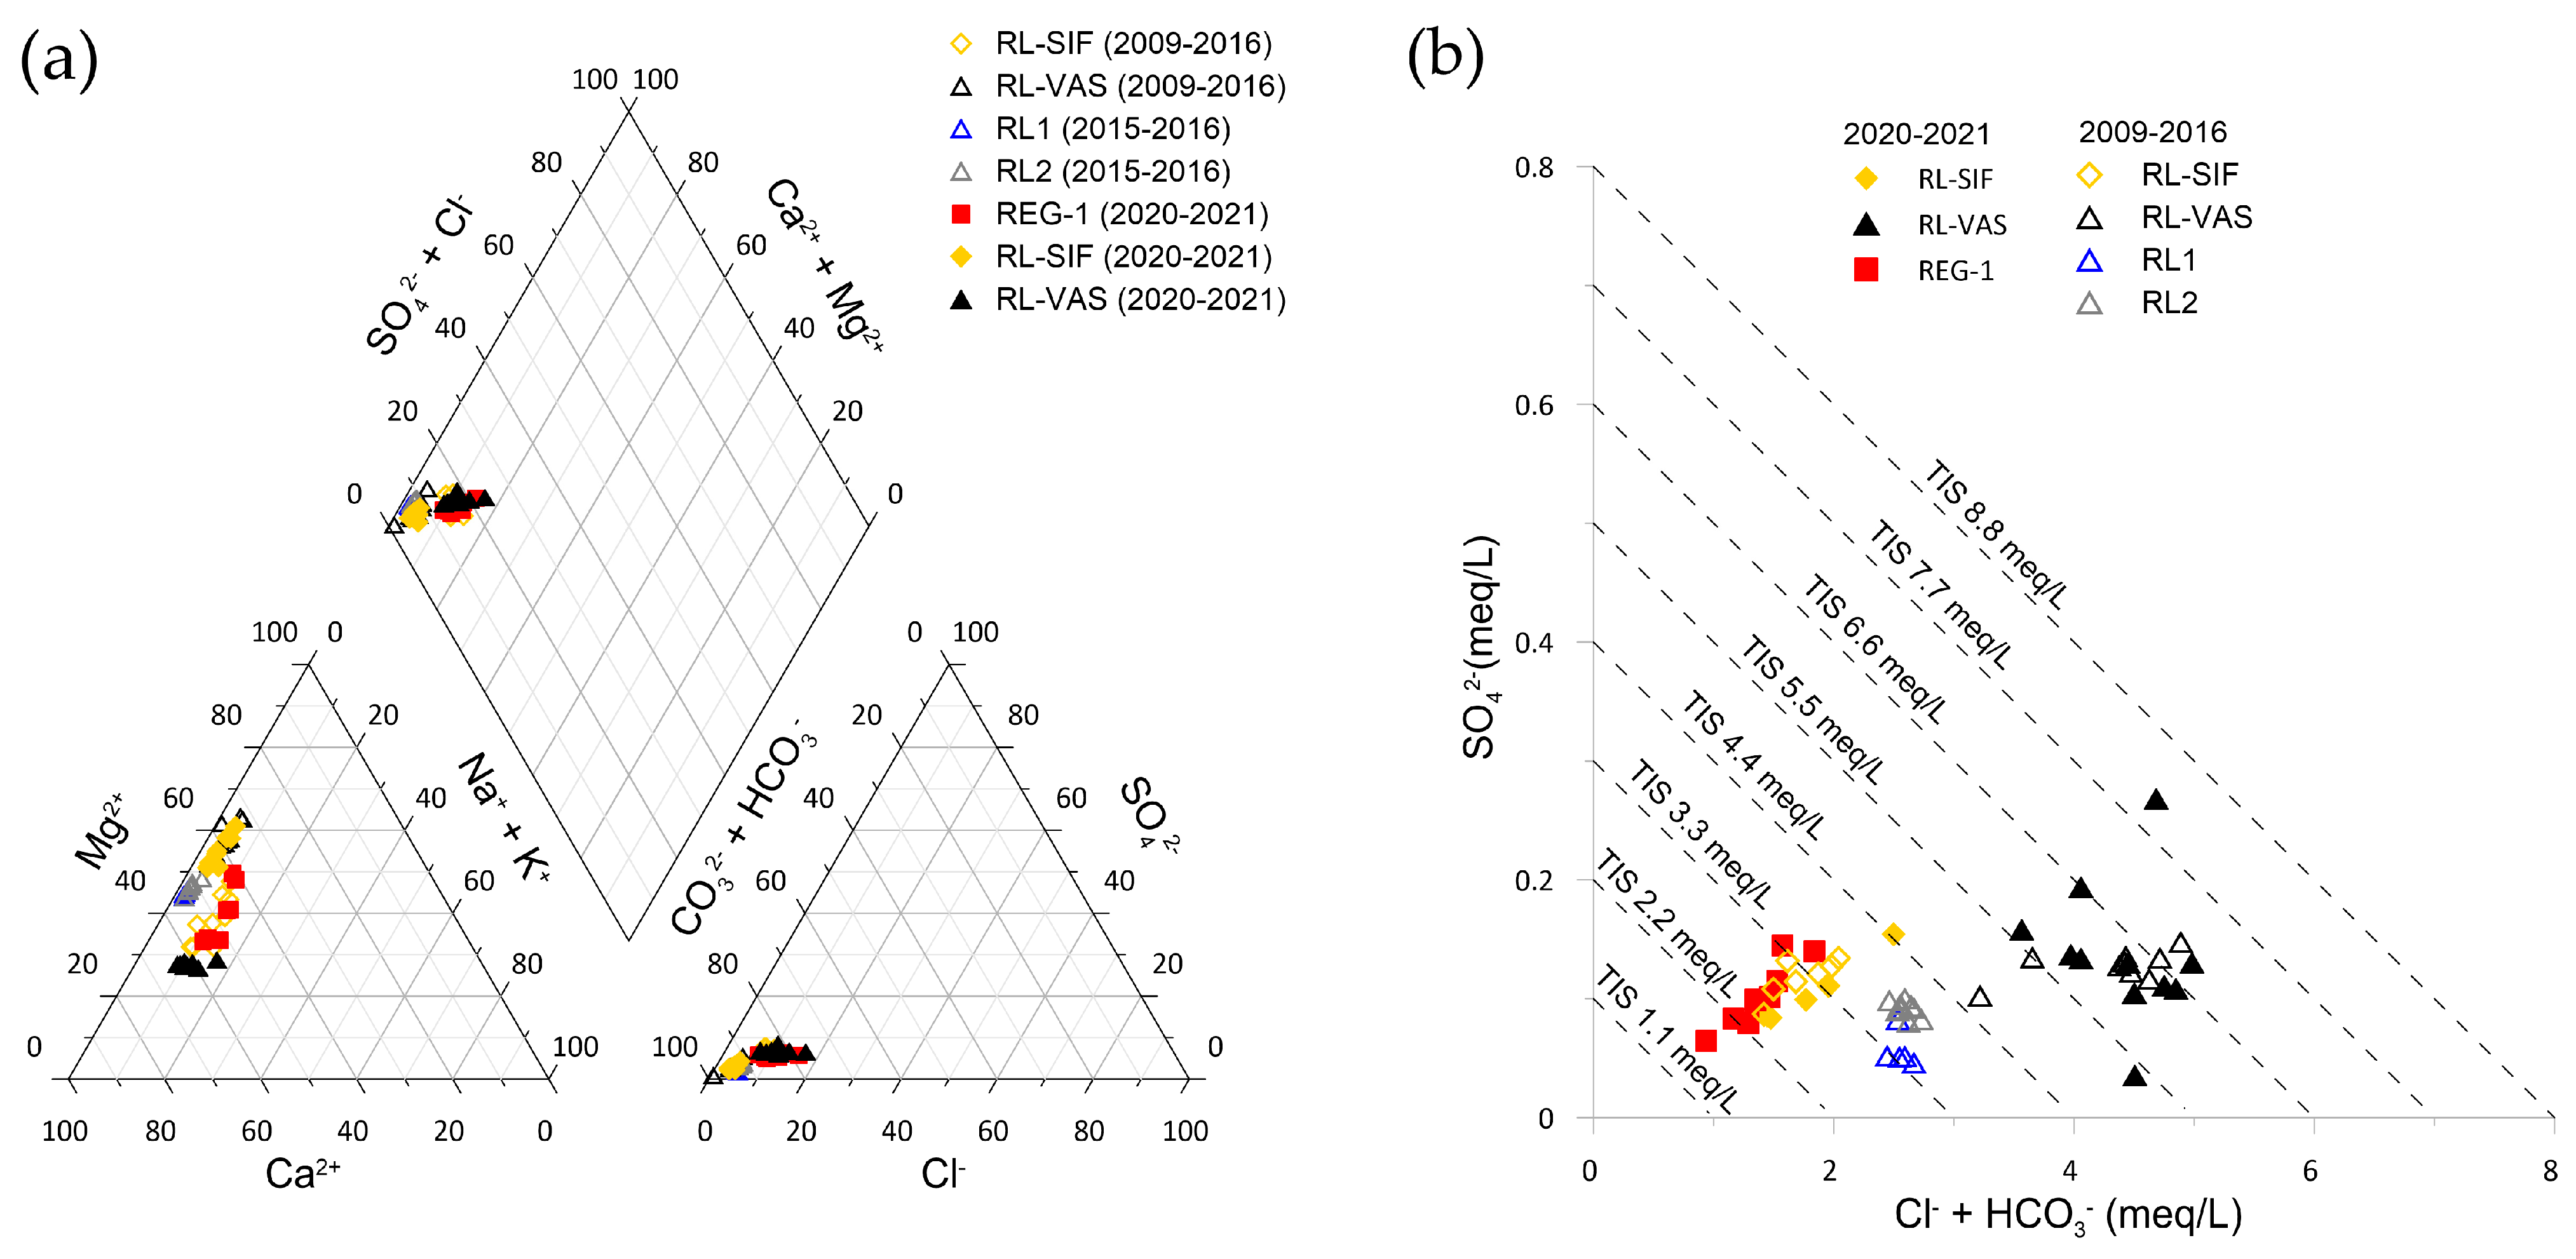
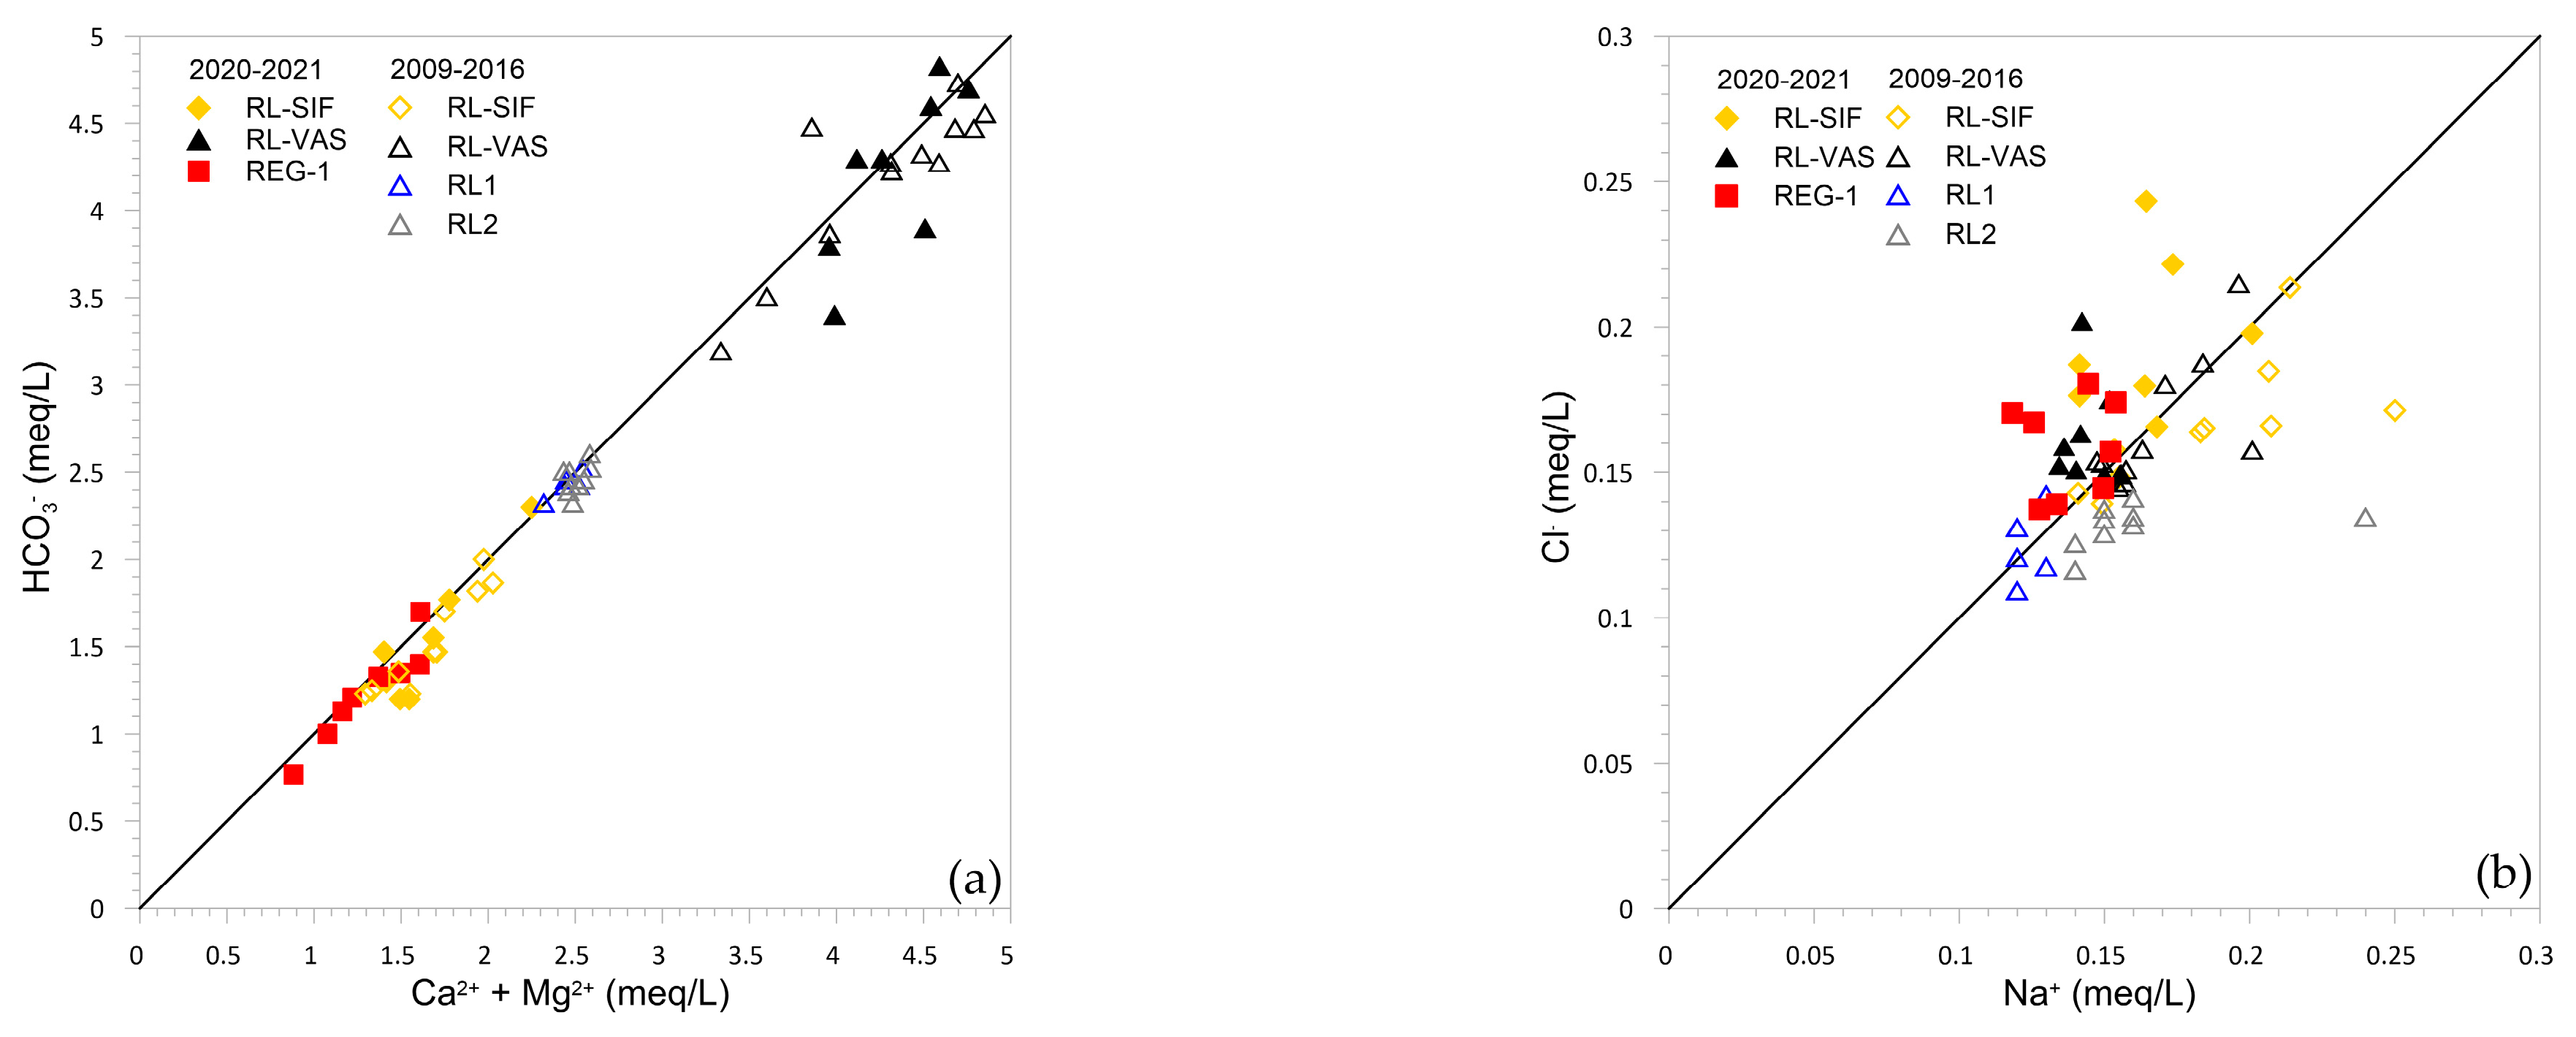
4.2. Physico-Chemical Parameters, Hydrogeochemistry of Stream and Cave Waters, and Hydrodynamic Conditions of the Cave Sump
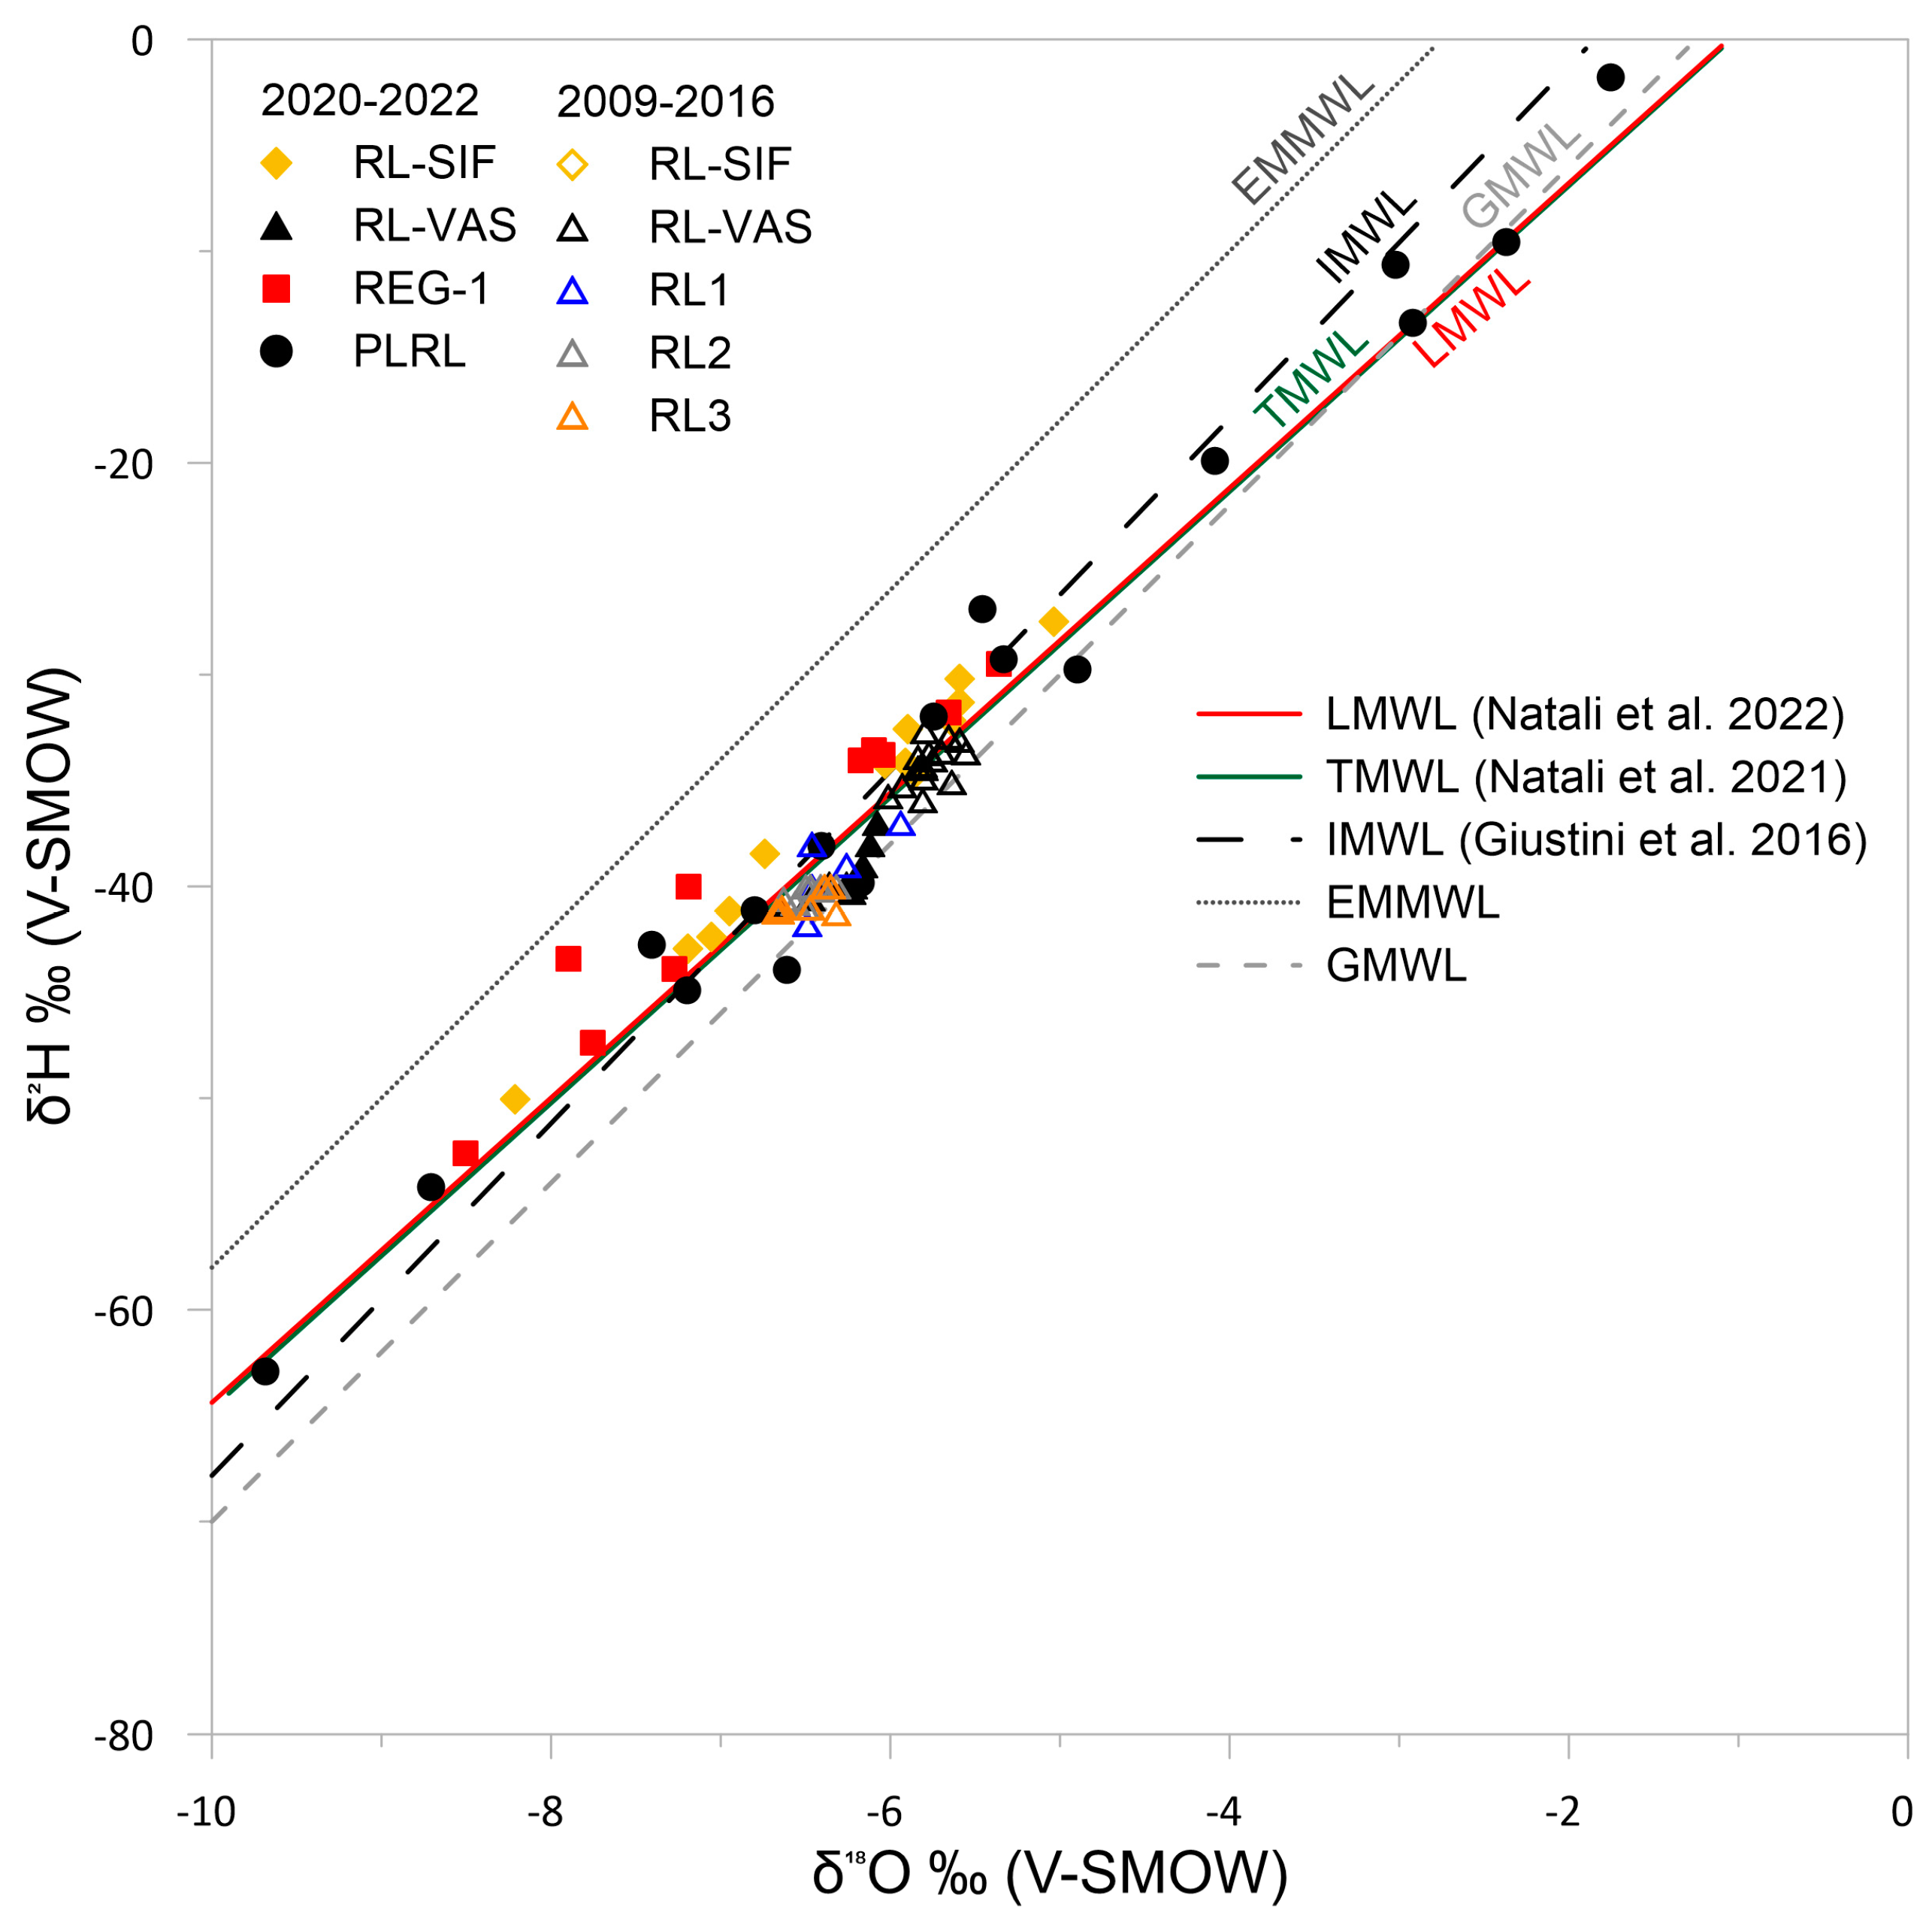
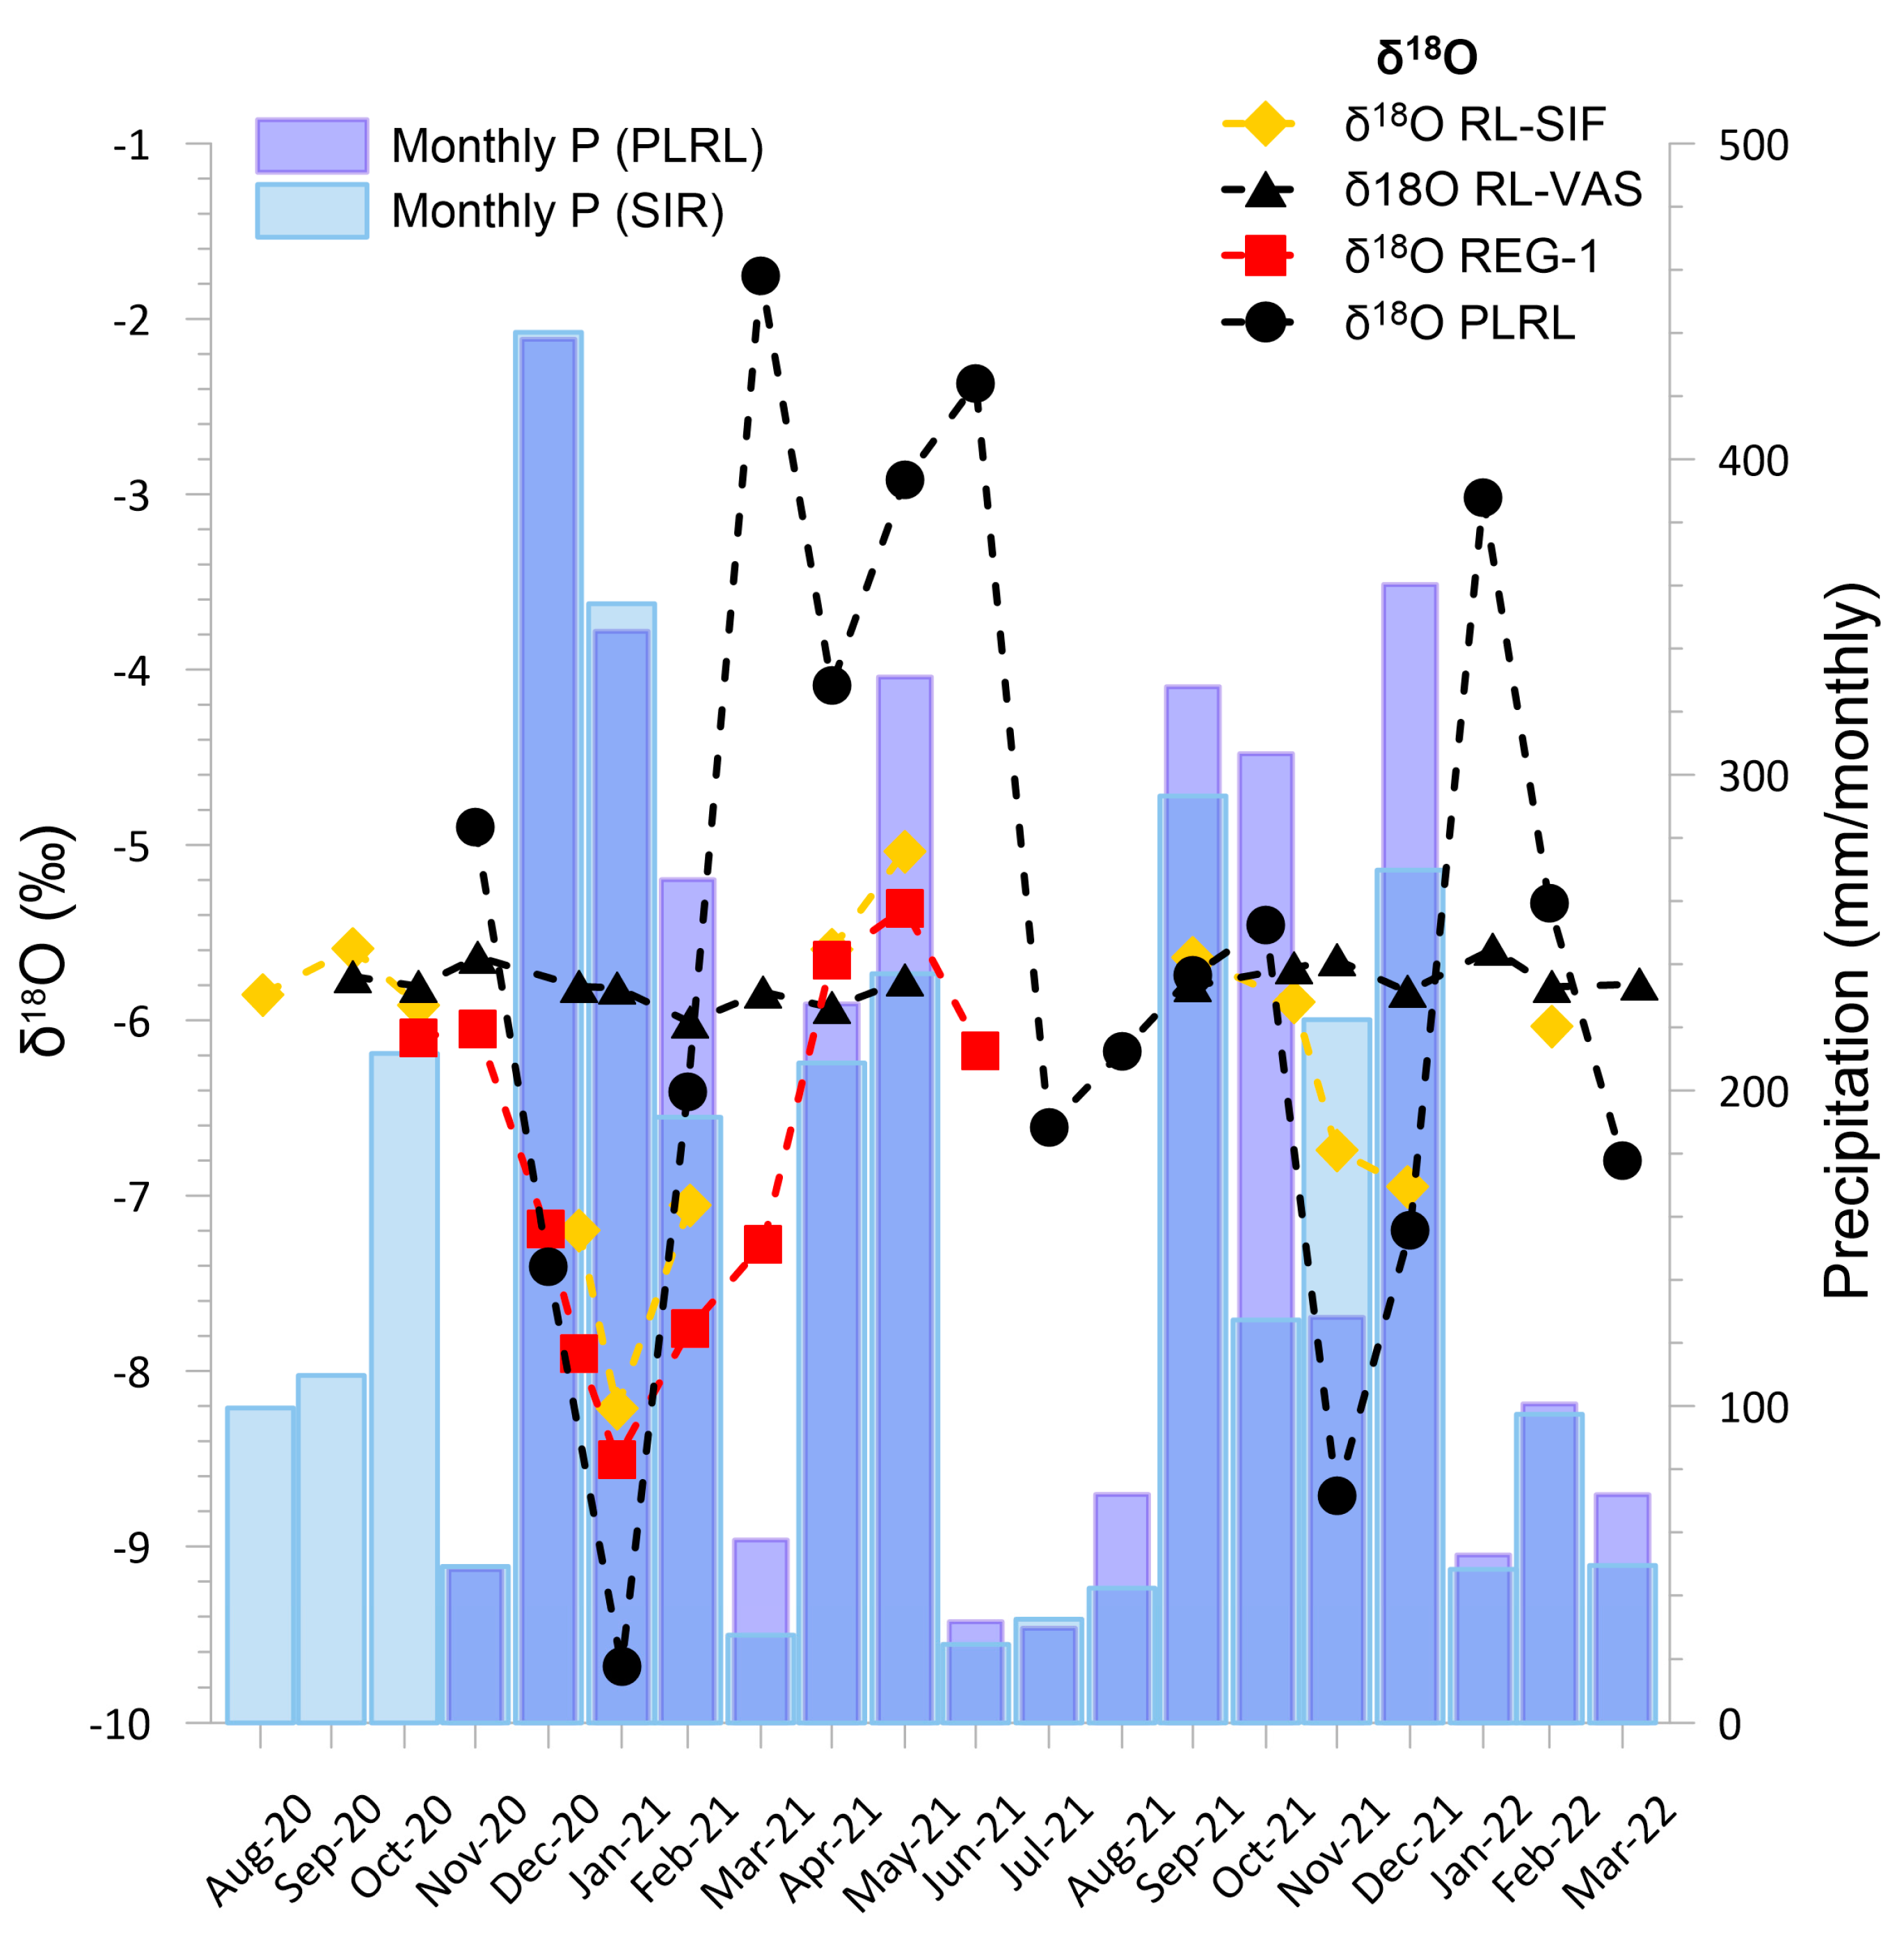
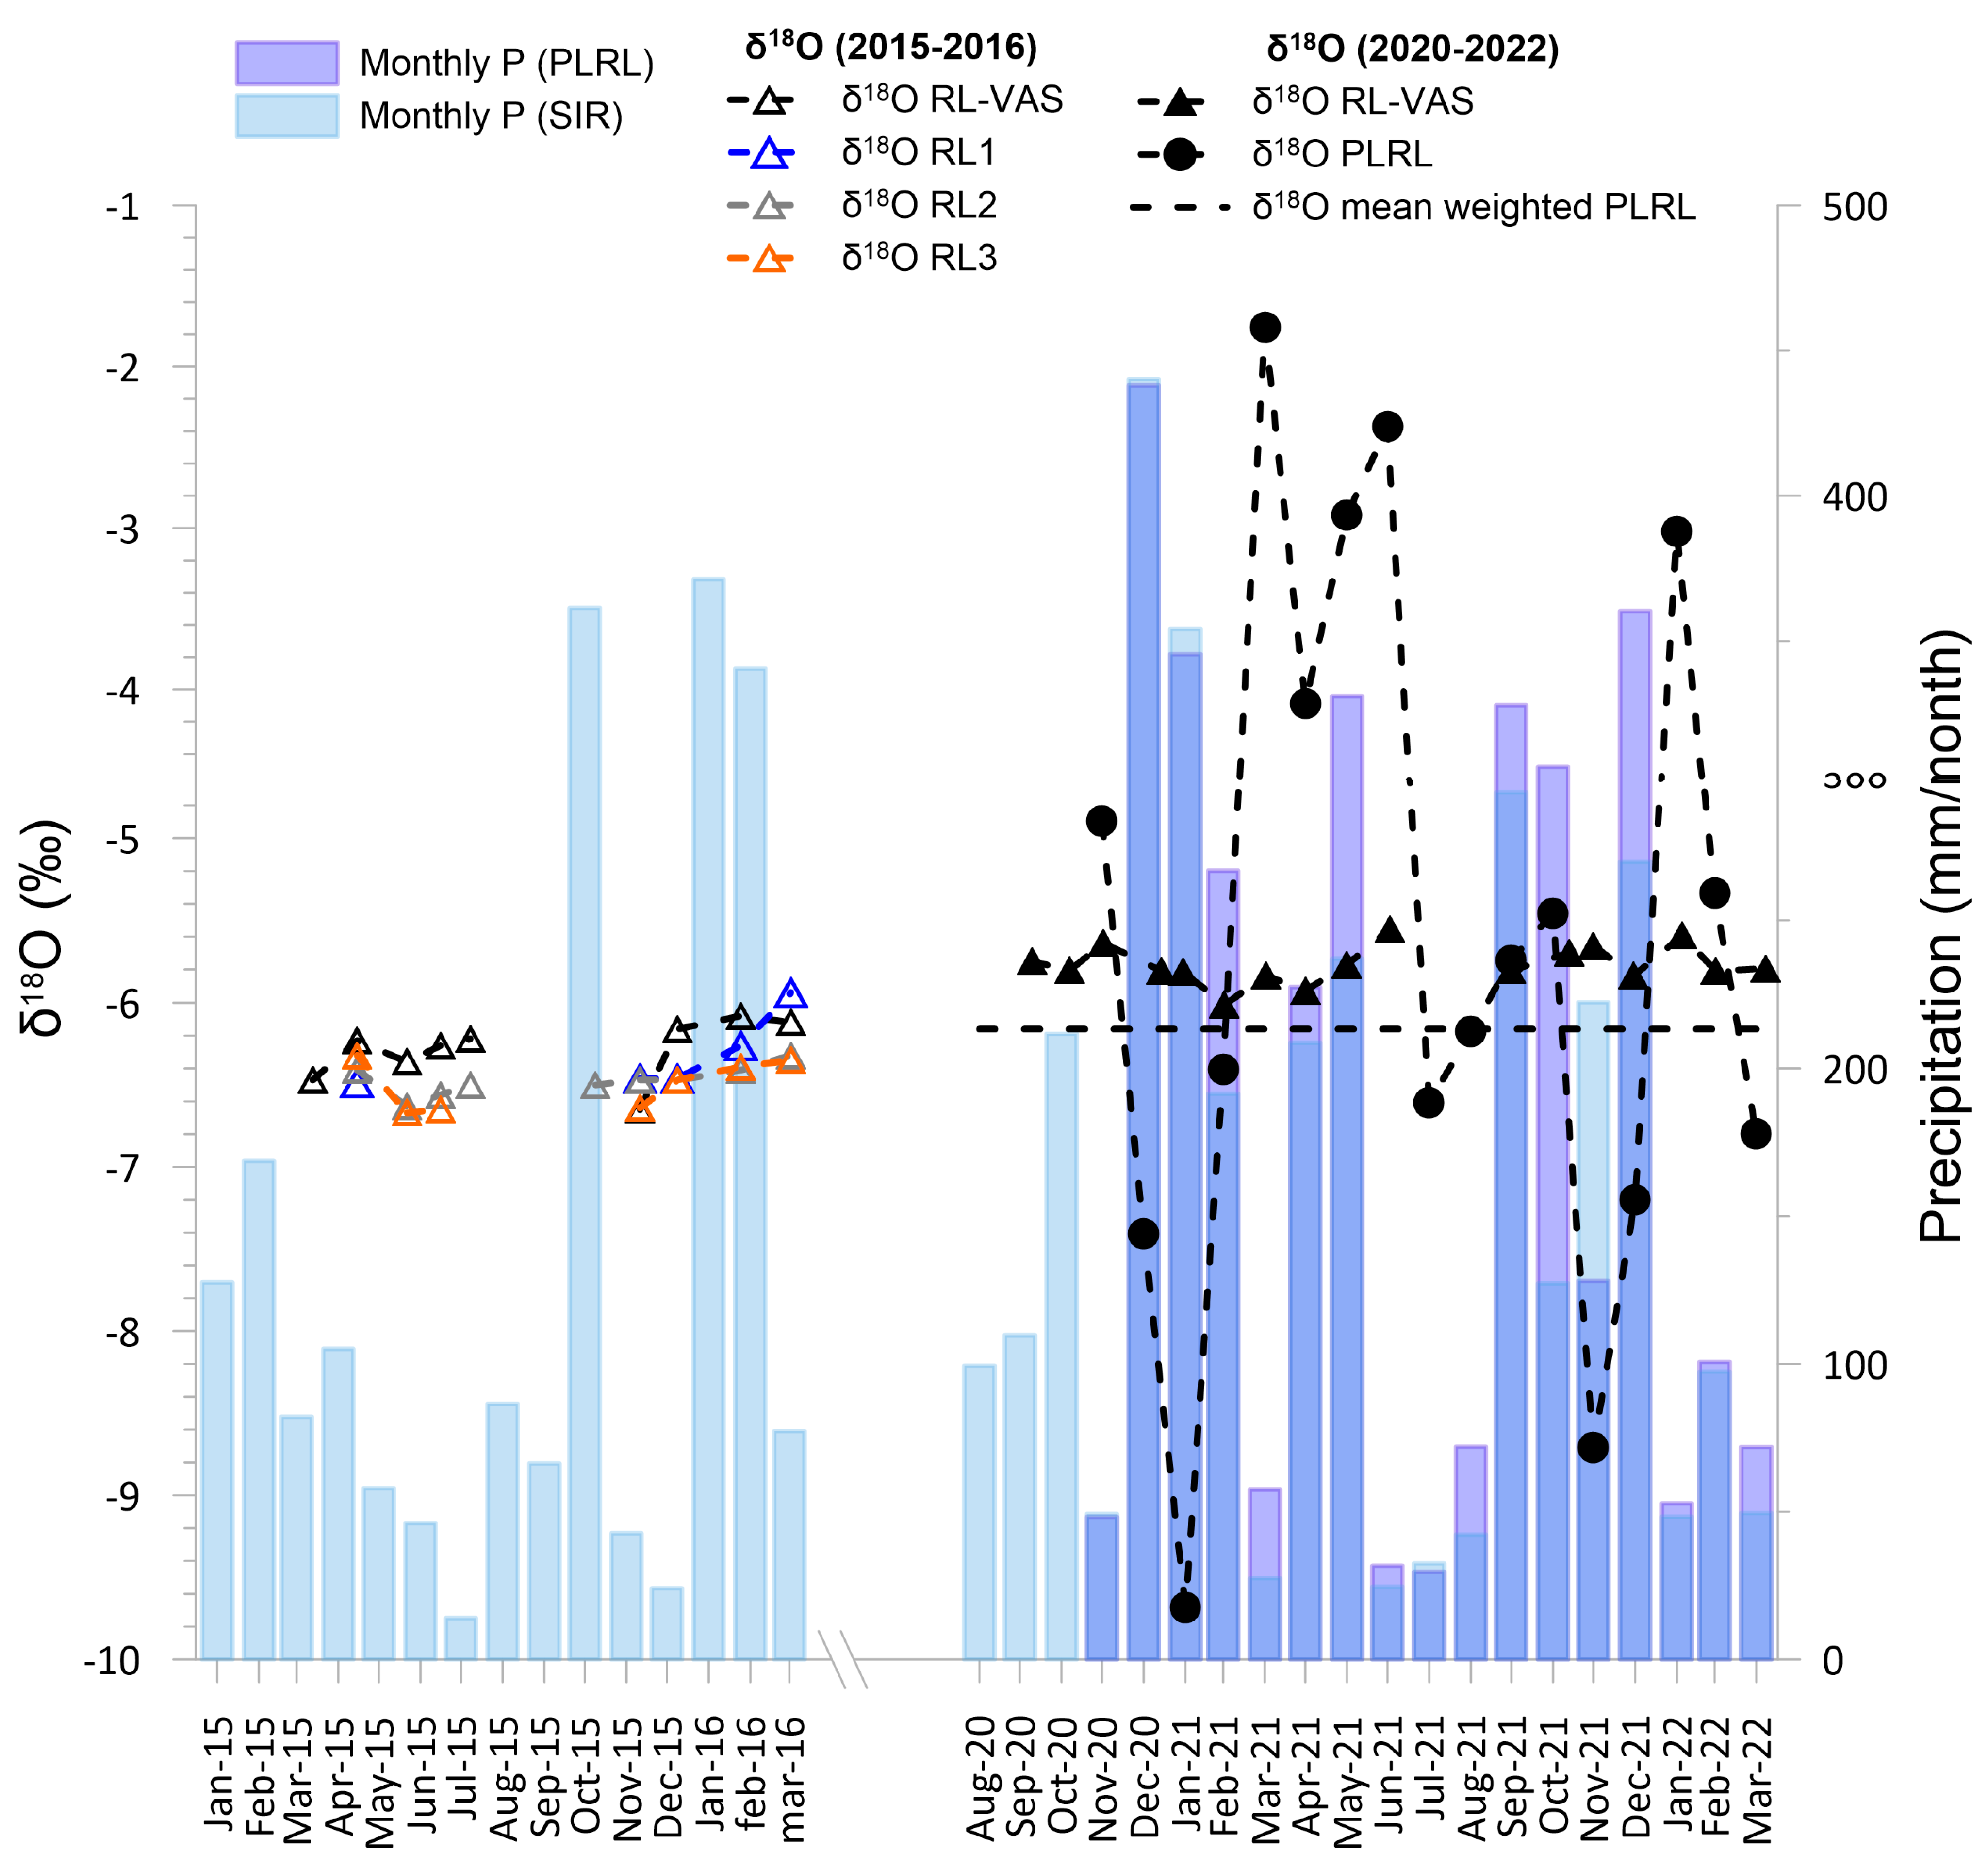
4.3. Isotopic Composition of Precipitation, Stream, and Cave Waters
5. Discussion
5.1. Hydrochemical Processes: Carbonate Dissolution, Dilution, and Calcite Precipitation
5.2. Isotope Hydrogeochemistry of Drip Pool and Drip Waters and Relation with Precipitation
5.3. Cave Sump Water Sources: Hydrology, Hydrogeochemistry, and Its Relationship with Regolo Creek
6. Conclusions
Supplementary Materials
Author Contributions
Funding
Data Availability Statement
Acknowledgments
Conflicts of Interest
References
- Hamza, M.H.; Added, A.; Rodríguez, R.; Abdeljaoued, S.; Ben Mammou, A. A GIS-based DRASTIC vulnerability and net recharge reassessment in an aquifer of a semi-arid region (Metline-Ras Jebel-Raf Raf aquifer, Northern Tunisia). J. Environ. Manag. 2007, 84, 12–19. [Google Scholar] [CrossRef]
- Andreo, B.; Vías, J.; Durán, J.J.; Jiménez, P.; López-Get, J.A.; Carrasco, F. Methodology for groundwater recharge assessment in carbonate aquifers: Application to pilot sites in southern Spain. Hydrogeol. J. 2008, 16, 911–925. [Google Scholar] [CrossRef]
- Chenoweth, J.; Hadjikakou, M.; Zoumides, C. Quantifying the human impact on water resources: A critical review of the water footprint concept. Hydrol. Earth Syst. Sci. 2014, 18, 2325–2342. [Google Scholar] [CrossRef]
- Doveri, M.; Piccini, L.; Menichini, M. Hydrodynamic and geochemical features of metamorphic carbonate aquifers and implications for water management: The Apuan Alps (NW Tuscany-Italy) case study. In Karst Water Environment; Younos, T., Schreiber, M., Kosič Ficco, K., Eds.; Springer International Publishing: Cham, Switzerland, 2019; pp. 209–249. [Google Scholar] [CrossRef]
- Marić, N.; Matić, I.; Papić, P.; Beškoski, V.P.; Ilić, M.; Gojgić-Cvijović, G.; Miletić, S.; Nikić, Z.; Vrvić, M.M. Natural attenuation of petroleum hydrocarbons—A study of biodegradation effects in groundwater (Vitanovac, Serbia). Environ. Monit. Assess 2018, 190, 89. [Google Scholar] [CrossRef]
- Ford, D.; Williams, P.D. Karst Hydrogeology and Geomorphology; John Wiley & Sons: Chichester, UK, 2007. [Google Scholar]
- Pu, J.; Cao, M.; Zhang, Y.; Yuan, D.; Zhao, H. Hydrochemical indications of human impact on karst groundwater in a subtropical karst area. Chongqing, China. Environ. Earth Sci. 2014, 72, 1683–1695. [Google Scholar] [CrossRef]
- Iván, V.; Mádl-Szőnyi, J. State of the art of karst vulnerability assessment: Overview, evaluation and outlook. Environ. Earth Sci. 2017, 76, 112. [Google Scholar] [CrossRef]
- Liang, Y.; Zhao, C.; Tang, C.; Shen, H.; Wang, Z.; Gao, X.; Wang, Y. Characterization, evolution, and environmental issues of karst water systems in Northern China. Hydrogeol. J. 2018, 26, 1371–1385. [Google Scholar] [CrossRef]
- Stevanović, Z. Karst waters in potable water supply: A global scale overview. Environ. Earth Sci. 2019, 78, 662. [Google Scholar] [CrossRef]
- Goldscheider, N.; Chen, Z.; Auler, A.S.; Bakalowicz, M.; Broda, S.; Drew, D.; Hartmann, J.; Jiang, G.; Moosdorf, N.; Stevanovic, Z.; et al. Global distribution of carbonate rocks and karst water resources. Hydrogeol. J. 2020, 28, 1661–1677. [Google Scholar] [CrossRef]
- Olarinoye, T.; Gleeson, T.; Marx, V.; Seeger, S.; Adinehvand, R.; Allocca, V.; Andreo, B.; Apaéstegui, J.; Apolit, C.; Arfib, B.; et al. Global karst springs hydrograph dataset for research and management of the world’s fastest-flowing groundwater. Sci. Data 2020, 7, 59. [Google Scholar] [CrossRef] [PubMed]
- Tedd, K.M.C.; Coxon, E.; Misstear, B.D.R.; Daly, D.; Craig, M.; Mannix, A.; Hunter Williams, N.H. An integrated pressure and pathway approach to the spatial analysis of groundwater nitrate: A case study from the southeast of Ireland. Sci. Total Environ. 2014, 476, 460–476. [Google Scholar] [CrossRef]
- Bates, B.C.; Kundzewicz, Z.; Wu, S.; Palutikof, J. (Eds.) Climate Change and Water; Technical Paper of the Intergovernmental Panel on Climate Change; IPCC Secretariat: Geneva, Switzerland, 2008; p. 210. Available online: http://www.taccire.sua.ac.tz/handle/123456789/552 (accessed on 10 April 2023).
- Giorgi, F. Thirty years of regional climate modeling: Where are we and where are we going next? J. Geophys. Res. Atmos. 2019, 124, 5696–5723. [Google Scholar] [CrossRef]
- Worthington, S. Characteristics of channel networks in unconfined carbonate aquifers. GSA Bulletin 2014, 127, 759–769. [Google Scholar] [CrossRef]
- Patekar, M.; Bašić, M.; Pola, M.; Kosović, I.; Terzić, J.; Lucca, A.; Mittempergher, S.; Berio, L.R.; Borović, S. Multidisciplinary investigations of a karst reservoir for managed aquifer recharge applications on the island of Vis (Croatia). Acque Sotter. Ital. J. Groundw. 2022, 11, 37–48. [Google Scholar] [CrossRef]
- Kazakis, N.; Chalikakis, K.; Mazzilli, N.; Ollivier, C.; Manakos, A.; Voudouris, K. Management and research strategies of karst aquifers in Greece: Literature overview and exemplification based on hydrodynamic modelling and vulnerability assessment of a strategic karst aquifer. Sci. Total Environ. 2018, 643, 592–609. [Google Scholar] [CrossRef]
- Goldscheider, N.; Drew, D. Speleological investigations. Int. J. Speleol. 2008, 37, 27–40. [Google Scholar] [CrossRef]
- Hartmann, A.; Lange, J.; Weiler, M.; Arbel, Y.; Greenbaum, N. A new approach to model the spatial and temporal variability of recharge to karst aquifers. Hydrol. Earth Syst. Sci. 2012, 16, 2219–2231. [Google Scholar] [CrossRef]
- Perrin, J.; Jeannin, P.Y.; Zwahlen, F. Epikarst storage in a karst aquifer: A conceptual model based on isotopic data. Milandre test site, Switzerland. J. Hydrol. 2003, 279, 106–124. [Google Scholar] [CrossRef]
- Aquilina, L.; Ladouche, B.; Dörfliger, N. Water storage and transfer in the epikarst of karstic systems during high flow periods. J. Hydrol. 2006, 327, 472–485. [Google Scholar] [CrossRef]
- Williams, P.W. The role of the epikarst in karst and cave hydrogeology: A review. Int. J. Speleol. 2008, 37, 1–10. [Google Scholar] [CrossRef]
- Drysdale, R.N.; Zanchetta, G.; Hellstrom, J.C.; Fallick, A.E.; Zhao, J.X.; Isola, I.; Bruschi, G. Palaeoclimatic implications of the growth history and stable isotope (δ18O and δ13C) geochemistry of a middle to late Pleistocene stalagmite from central-western Italy. Earth Planet Sci. Lett. 2004, 227, 215–229. [Google Scholar] [CrossRef]
- Drysdale, R.N.; Zanchetta, G.; Hellstrom, J.; Maas, R.; Fallick, A.; Pickett, M.; Cartwright, I.; Piccini, L. Late Holocene drought responsible for the collapse of Old World civilizations is recorded in an Italian cave flowstone. Geology 2006, 34, 101–104. [Google Scholar] [CrossRef]
- Isola, I.; Zanchetta, G.; Drysdale, R.N.; Regattieri, E.; Bini, M.; Bajo, P.; Hellstrom, J.C.; Baneschi, I.; Lionello, P.; Woodhead, J.; et al. The 4.2 ka event in the central Mediterranean: New data from a Corchia speleothem (Apuan Alps; central Italy). Clim. Past 2019, 15, 135–151. [Google Scholar] [CrossRef]
- Zanchetta, G.; Regattieri, E.; Isola, I.; Drysdale, R.N.; Bini, M.; Baneschi, I.; Hellstrom, J.C. The so-called “4.2 Event” in the Central Mediterranean and its climatic teleconnections. Alp. Mediterr. Quat. 2016, 29, 5–17. [Google Scholar]
- Zanchetta, G.; Bini, M.; Bloomfield, K.; Izdebski, A.; Vivoli, N.; Regattieri, E.; Isola, I.; Drysdale, R.N.; Bajo, P.; Hellstrom, J.C.; et al. Beyond one-way determinism: San Frediano’s miracle and climate change in Central and Northern Italy in late antiquity. Clim. Chang. 2021, 165, 25. [Google Scholar] [CrossRef]
- Zhornyak, L.V.; Zanchetta, G.; Drysdale, R.N.; Hellstrom, J.C.; Isola, I.; Regattieri, E.; Piccini, L.; Baneschi, I.; Couchoud, I. Stratigraphic evidence for a “pluvial phase” between ca 8200-7100 ka from Renella cave (Central Italy). Quat. Sci. Rev. 2011, 30, 409–417. [Google Scholar] [CrossRef]
- Piccini, L.; Pranzini, G.; Tedici, L.; Forti, P. Le risorse idriche dei complessi carbonatici del comprensorio Apuo-Versiliese. Quad. Geo. App. 1999, 6, 61–78. [Google Scholar]
- Piccini, L. Acquiferi carbonatici e sorgenti carsiche delle Alpi Apuane. In Proceedings of the Le Risorse Idriche Sotterranee Delle Alpi Apuane: Conoscenze Attuali e Prospettive di Utilizzo: Massa, Italy, 22 June 2002; pp. 41–76. [Google Scholar]
- Piccini, L.; Di Lorenzo, T.; Costagliola, P.; Galassi, D.M.P. Marble Slurry’s Impact on Groundwater: The Case Study of the Apuan Alps Karst Aquifers. Water 2019, 11, 2462. [Google Scholar] [CrossRef]
- Köppen, W. Grundriss der Klimakunde; de Gruyter: Berlin, Germany; Boston, MA, USA, 1931. [Google Scholar] [CrossRef]
- Lionello, P.; Bhend, J.; Buzzi, A.; Della-Marta, P.M.; Krichak, S.O.; Jansà, A.; Maheras, P.; Sanna, A.; Trigo, R. Cyclones in the Mediterranean region. Climatology and effects on the environment. In Developments in Earth and Enviromental Sciences; Elsevier: Amsterdam, The Netherlands, 2006; Volume 4, pp. 325–372. [Google Scholar] [CrossRef]
- Reale, M.; Lionello, P. Synoptic climatology of winter intense precipitation events along the Mediterranean coasts. Nat. Hazards Earth Syst. Sci. 2013, 13, 1707–1722. [Google Scholar] [CrossRef]
- Trigo, I.F.; Bigg, G.R.; Davies, T.D. Climatology of cyclogenesis mechanisms in the Mediterranean. Am. Meteorol. Soc. 2002, 130, 549–569. [Google Scholar] [CrossRef]
- Natali, S.; Doveri, M.; Giannecchini, R.; Baneschi, I.; Zanchetta, G. Is the deuterium excess in precipitation a reliable tracer of moisture sources and water resources fate in the western Mediterranean? New insights from Apuan Alps (Italy). J. Hydrol. 2022, 614, 128497. [Google Scholar] [CrossRef]
- López-Moreno, J.I.; Vicente-Serrano, S.M.; Morán-Tejeda, E.; Lorenzo-Lacruz, J.; Kenawya, A.; Beniston, M. Effects of the North Atlantic Oscillation (NAO) on combined temperature and precipitation winter modes in the Mediterranean mountains: Observed relationships and projections for the 21st century. Glob. Planet Ch. 2011, 77, 62–76. [Google Scholar] [CrossRef]
- Luppichini, M.; Barstanti, M.; Giannecchini, R.; Bini, M. Statistical relationships between large-scale circulation patterns and local-scale effects: NAO and rainfall regime in a key area of the Mediterranean basin. Atmos. Res. 2021, 248, 105270. [Google Scholar] [CrossRef]
- Piccini, L.; Zanchetta, G.; Drysdale, R.N.; Hellstrom, J.; Isola, I.; Fallick, A.E.; Leone, G.; Doveri, M.; Mussi, M.; Mantelli, F.; et al. The environmental features of the Monte Corchia cave system (Apuan Alps, central Italy) and their effects on speleothem growth. Int. J. Speleol. 2008, 37, 153–172. [Google Scholar] [CrossRef]
- Natali, S. Idrologia e Idrochimica del Sistema Carsico Buca della Renella (Forno, Massa): Implicazioni Paleoambientali. Bachelor’s Thesis, University of Pisa, Pisa, Italy, 2015. [Google Scholar]
- Tardelli, A. Studio idrologico e idrochimico del sistema carsico Buca della Renella (Forno, Massa-Carrara): Implicazioni paleoambientali. Master’s Thesis, University of Pisa, Pisa, Italy, 2016. [Google Scholar]
- Moore, R.D. Introduction to Salt Dilution Gauging for Streamflow Measurement Part 2: Constant-rate Injection. Watershed Manag. Bull. 2004, 8, 1. [Google Scholar]
- Østrem, Gunnar A method of measuring water discharge in turbulent streams. Geogr. Bull. 1964, 21, 21–43.
- Appelo, C.A.J.; Postma, D. Geochemistry, Groundwater and Pollution, 2nd ed.; Appelo, C.A.J., Postma, D., Eds.; CRC Press: Boca Raton, FL, USA, 2005. [Google Scholar] [CrossRef]
- Epstein, S.; Mayeda, T. Variation of 18O content of waters from natural sources. Geochim. Cosmochim. Acta 1953, 4, 213–224. [Google Scholar] [CrossRef]
- Lis, G.; Wassenaar, L.I.; Hendry, M.J. High-Precision Laser Spectroscopy D/H and 18O/16O Measurements of Microliter Natural Water Samples. Anal. Chem. 2008, 80, 287–293. [Google Scholar] [CrossRef]
- Craig, H. Standards for reporting concentrations of deuterium and 18O in natural waters. Science 1961, 133, 1833–1834. [Google Scholar] [CrossRef]
- Baneschi, I.; Piccini, L.; Regattieri, E.; Isola, I.; Guidi, M.; Lotti, L.; Mantelli, F.; Menichetti, M.; Drysdale, R.N.; Zanchetta, G. Hypogean microclimatology and hydrology of the 800– 900 m a.s.l. level in the Monte Corchia cave (Tuscany, Italy): Preliminary considerations and implications for paleoclimatological studies. Acta Carsologica 2011, 40, 175–187. [Google Scholar] [CrossRef]
- Regattieri, E.; Zanchetta, G.; Drysdale, R.N.; Isola, I.; Hellstrom, J.; Roncioni, A. A continuous stable isotopic record from Penultimate glacial maximum on to the Last Interglacial (159–121 ka) from Tana Che Urla Cave (Apuan Alps, central Italy). Quat. Res. 2014, 82, 450–461. [Google Scholar] [CrossRef]
- Petrič, M.; Kogovšek, J. Hydrogeological Characteristics of the Area of Intermittent Karst Lakes of Pivka. Acta Carsologica 2005, 34, 599–618. [Google Scholar] [CrossRef]
- Piccini, L.; Nannoni, A.; Poggetti, E. Hydrodynamics of karst aquifers in metamorphic carbonate rocks: Results from spring monitoring in the Apuan Alps (Tuscany, Italy). Hydrogeol. J. 2023, 31, 241–255. [Google Scholar] [CrossRef]
- Piper, A.M. A graphic procedure in the geochemical interpretation of water analyses. Eos. Trans. AGU 1944, 25, 914–928. [Google Scholar] [CrossRef]
- Natali, S.; Baneschi, I.; Doveri, M.; Giannecchini, R.; Selmo, E.; Zanchetta, G. Meteorological and geographical control on stable isotopic signature of precipitation in a western Mediterranean area (Tuscany, Italy): Disentangling a complex signal. J. Hydrol. 2021, 603, 126944. [Google Scholar] [CrossRef]
- Giustini, F.; Brilli, M.; Patera, A. Mapping oxygen stable isotopes of precipitation in Italy. J. Hydrol. Reg. Stud. 2016, 8, 162–181. [Google Scholar] [CrossRef]
- Guan, H.; Love, A.J.; Simmons, C.T.; Makhnin, O.; Kayaalp, A.S. Factors influencing chloride deposition in a coastal hilly area and application to chloride deposition mapping. Hydrol. Earth Syst. Sci. 2010, 14, 801–813. [Google Scholar] [CrossRef]
- Mantelli, F.; Lotti, L.; Montigiani, A.; Piccini, L. Chimica delle acque del Complesso Carsico del Monte Corchia. Acta Apuana 2015, 11, 33–45. [Google Scholar]


| 2020–2022 | 2015–2016 | 2009–2013 | |||||||||||||
|---|---|---|---|---|---|---|---|---|---|---|---|---|---|---|---|
| Parameter | Code | RL-SIF | RL-VAS | REG-1 | PLRL | RL-SIF | RL-VAS | RL1 | RL2 | RL3 | RL-SIF | RL-VAS | RL1 | RL2 | RL3 |
| n | 7 | 8 | 8 | / | 7 | 9 | 5 | 9 | / | 3 | 4 | / | / | / | |
| T (°C) | min | 10.2 | 10.8 | 3.9 | / | 9.2 | 11.4 | / | / | / | 9.2 | 11.4 | / | / | / |
| mean | 11.1 | 12.3 | 10.1 | / | 11.7 | 12.9 | / | / | / | 10.9 | 12.4 | / | / | / | |
| sd | 0.8 | 0.7 | 4.8 | / | 1.1 | 0.6 | / | / | / | 1.6 | 0.7 | / | / | / | |
| max | 12.4 | 13.2 | 19.9 | / | 13.3 | 13.5 | / | / | / | 12.3 | 12.9 | / | / | / | |
| pH | min | 7.9 | 8.1 | 7.6 | / | 7.6 | 7.9 | / | / | / | 8.1 | 8.3 | / | / | / |
| mean | 8.1 | 8.3 | 8.1 | / | 8.0 | 8.2 | / | / | / | 8.1 | 8.3 | / | / | / | |
| sd | 0.1 | 0.1 | 2.6 | / | 0.2 | 0.2 | / | / | / | 0 | 0 | / | / | / | |
| max | 8.2 | 8.4 | 8.4 | / | 8.2 | 8.4 | / | / | / | 8.2 | 8.4 | / | / | / | |
| EC (µS/cm at 25 °C) | min | 154 | 322 | 111 | / | 143 | 290 | / | / | / | 143 | 357 | / | / | / |
| mean | 182 | 391 | 156 | / | 175 | 387 | / | / | / | 162 | 393 | / | / | / | |
| sd | 25 | 39 | 32 | / | 24 | 40 | / | / | / | 31 | 40 | / | / | / | |
| max | 244 | 454 | 224 | / | 204 | 444 | / | / | / | 198 | 444 | / | / | / | |
| HCO3 (mg/L) | min | 73.2 | 207.5 | 47.0 | / | 76.3 | 195.0 | 142.0 | 142.0 | / | 75.1 | 140.3 | / | / | / |
| mean | 94.1 | 258.0 | 75.4 | / | 95.4 | 254.8 | 148.0 | 150.0 | / | 90.7 | 230.7 | / | / | / | |
| sd | 23.9 | 30.2 | 17.1 | / | 14.4 | 30.5 | 4.0 | 5.0 | / | 27.1 | 62.7 | / | / | / | |
| max | 140.3 | 294.7 | 103.7 | / | 114.0 | 289.0 | 154.0 | 159.0 | / | 122.0 | 273.4 | / | / | / | |
| Cl (mg/L) | min | 5.9 | 5.3 | 4.9 | / | 4.9 | 5.1 | 3.9 | 4.1 | / | 5.3 | 0.9 | / | / | / |
| mean | 6.9 | 5.8 | 5.6 | / | 5.9 | 5.4 | 4.4 | 4.7 | / | 5.8 | 5.4 | / | / | / | |
| sd | 1.0 | 0.6 | 0.6 | / | 0.9 | 0.2 | 0.5 | 0.3 | / | 0.7 | 3.1 | / | / | ||
| max | 8.6 | 7.2 | 6.4 | / | 7.6 | 5.6 | 5.1 | 5.0 | / | 6.5 | 7.6 | / | / | / | |
| SO4 (mg/L) | min | 4.0 | 5.0 | 3.1 | / | 4.2 | 4.9 | 1.0 | 1.0 | / | 4.8 | 1.7 | / | / | / |
| mean | 4.9 | 6.1 | 5.0 | / | 5.7 | 6.2 | 1.3 | 1.1 | / | 6.2 | 7.8 | / | / | / | |
| sd | 1.2 | 0.9 | 1.3 | / | 0.8 | 0.6 | 0.2 | 0.1 | / | 2.1 | 4.7 | / | / | / | |
| max | 7.4 | 7.6 | 7.0 | / | 6.5 | 7.1 | 1.6 | 1.3 | / | 8.7 | 12.9 | / | / | / | |
| NO3 (mg/L) | min | 0.6 | 0.4 | 0.1 | / | 2.0 | 1.0 | 2.2 | 3.7 | / | 1.2 | 1.2 | / | / | / |
| mean | 1.7 | 0.7 | 0.3 | / | 2.8 | 1.3 | 2.4 | 4.4 | / | 1.8 | 1.2 | / | / | / | |
| sd | 1.0 | 0.2 | 0.1 | / | 0.7 | 0.1 | 0.1 | 0.4 | / | 0.7 | 0 | / | / | / | |
| max | 3.5 | 0.9 | 0.4 | / | 3.9 | 1.4 | 2.5 | 4.8 | / | 2.6 | 1.2 | / | / | / | |
| Na (mg/L) | min | 3.3 | 3.1 | 2.7 | / | 3.2 | 3.4 | 2.7 | 3.2 | / | 3.5 | 0.8 | / | / | / |
| mean | 3.8 | 3.3 | 3.2 | / | 4.4 | 3.7 | 2.9 | 3.7 | / | 3.9 | 3.4 | / | / | / | |
| sd | 0.5 | 0.2 | 0.3 | / | 0.9 | 0.4 | 0.1 | 0.7 | / | 0.7 | 1.7 | / | / | / | |
| max | 4.6 | 3.6 | 3.5 | / | 5.8 | 4.6 | 3.0 | 5.6 | / | 4.7 | 4.5 | / | / | / | |
| K (mg/L) | min | 0.5 | 0.3 | 0.1 | / | 0.4 | 0.3 | 0.1 | 0.1 | / | 0.3 | 0.1 | / | / | / |
| mean | 1.1 | 0.7 | 0.2 | / | 0.9 | 0.4 | 0.1 | 0.1 | / | 0.4 | 0.3 | / | / | / | |
| sd | 0.4 | 0.6 | 0.0 | / | 0.4 | 0.1 | 0.0 | 0.0 | / | 0.1 | 0.1 | / | / | / | |
| max | 1.4 | 2.2 | 0.3 | / | 1.6 | 0.5 | 0.1 | 0.1 | / | 0.5 | 0.5 | / | / | / | |
| Ca (mg/L) | min | 16.0 | 29.0 | 11.6 | / | 16.8 | 22.8 | 25.7 | 24.6 | / | 16.1 | 29.1 | / | / | / |
| mean | 17.8 | 37.2 | 18.0 | / | 19.4 | 35.8 | 26.8 | 26.5 | / | 18.3 | 35.4 | / | / | / | |
| sd | 1.5 | 5.6 | 3.8 | / | 1.3 | 7.4 | 0.7 | 0.9 | / | 2.1 | 6.5 | / | / | / | |
| max | 20.4 | 43.9 | 22.5 | / | 20.7 | 43.5 | 27.6 | 27.5 | / | 20.1 | 43.2 | / | / | / | |
| Mg (mg/L) | min | 6.4 | 28.1 | 3.7 | / | 6.0 | 26.7 | 12.6 | 14.0 | / | 6 | 29.2 | / | / | / |
| mean | 9.3 | 30.2 | 4.9 | / | 9.0 | 30.8 | 13.6 | 14.6 | / | 8.4 | 31.6 | / | / | / | |
| sd | 3.1 | 1.2 | 0.9 | / | 2.3 | 2.4 | 0.7 | 0.5 | / | 3.7 | 2.9 | / | / | / | |
| max | 15.0 | 31.8 | 6.1 | / | 12.1 | 34.9 | 14.4 | 15.2 | / | 12.7 | 35 | / | / | / | |
| n | 13 | 17 | 10 | 17 | 7 | 9 | 5 | 9 | 7 | 3 | 4 | 2 | 2 | 2 | |
| δ¹⁸O (‰) | min | −8.21 | −6.01 | −35.95 | −9.68 | −6.85 | −6.65 | −6.49 | −6.63 | −6.67 | −7.11 | −6.29 | −6.46 | −6.26 | −6.72 |
| mean | −6.29 | −5.77 | −34.95 | −5.56 | −6.49 | −6.28 | −6.32 | −6.47 | −6.5 | −6.85 | −5.96 | −6.28 | −6.23 | −6.45 | |
| sd | 0.88 | 0.12 | 0.69 | 2.20 | 0.29 | 0.18 | 0.23 | 0.09 | 0.15 | 0.23 | 0.28 | 0.25 | 0.04 | 0.39 | |
| max | −5.03 | −5.55 | −34.00 | −1.75 | −6.08 | −6.08 | −5.94 | −6.32 | −6.32 | −6.70 | −5.63 | −5.94 | −6.20 | −6.17 | |
| δ²H (‰) | min | −50.1 | −36.0 | −52.6 | −62.9 | −43.7 | −41.0 | −41.8 | −41 | −41.3 | −46.2 | −40.9 | −40.0 | −34.3 | −41.8 |
| mean | −36.3 | −34.2 | −39.0 | −31.8 | −40.1 | −39.5 | −39.2 | −40.3 | −40.8 | −42.1 | −38.5 | −38.5 | −33.5 | −37.6 | |
| sd | 6.3 | 0.9 | 7.6 | 16.7 | 2.5 | 1.3 | 1.8 | 0.4 | 0.6 | 4.4 | 2.2 | 1.3 | 1.1 | 5.9 | |
| max | −27.5 | −32.7 | −29.5 | −1.8 | −37.0 | −37.0 | −37 | −40 | −40 | −37.5 | −36.3 | −37.0 | −32.7 | −33.5 | |
| d-excess (‰) | min | 12.2 | 10.0 | 13.4 | 8.9 | 10.5 | 9.6 | 10.1 | 10.6 | 9.3 | 10.7 | 8.7 | 10.5 | 15.8 | 12.0 |
| mean | 14.0 | 11.9 | 15.4 | 12.7 | 11.8 | 10.8 | 11.4 | 11.5 | 11.2 | 12.7 | 9.2 | 11.7 | 16.3 | 13.9 | |
| sd | 1.0 | 0.9 | 1.9 | 2.5 | 0.8 | 0.9 | 1.4 | 0.6 | 1.0 | 3.0 | 0.6 | 1.4 | 0.8 | 2.8 | |
| max | 15.6 | 13.7 | 19.8 | 16.7 | 12.6 | 12.2 | 13.7 | 12.4 | 12.2 | 16.1 | 10.0 | 13.7 | 16.9 | 15.9 | |
| 2020–2022 | 2015–2016 | 2009–2013 | |||||||||||||
|---|---|---|---|---|---|---|---|---|---|---|---|---|---|---|---|
| Parameter | Code | RL-SIF | RL-VAS | REG-1 | PLRL | RL-SIF | RL-VAS | RL1 | RL2 | RL3 | RL-SIF | RL-VAS | RL1 | RL2 | RL3 |
| n | 7 | 8 | 8 | / | 7 | 9 | 5 | 9 | / | 3 | 4 | / | / | / | |
| T (°C) | min | 10.2 | 10.8 | 3.9 | / | 9.2 | 11.4 | / | / | / | 9.2 | 11.4 | / | / | / |
| mean | 11.1 | 12.3 | 10.1 | / | 11.7 | 12.9 | / | / | / | 10.9 | 12.4 | / | / | / | |
| sd | 0.8 | 0.7 | 4.8 | / | 1.1 | 0.6 | / | / | / | 1.6 | 0.7 | / | / | / | |
| max | 12.4 | 13.2 | 19.9 | / | 13.3 | 13.5 | / | / | / | 12.3 | 12.9 | / | / | / | |
| pH | min | 7.9 | 8.1 | 7.6 | / | 7.6 | 7.9 | / | / | / | 8.1 | 8.3 | / | / | / |
| mean | 8.1 | 8.3 | 8.1 | / | 8.0 | 8.2 | / | / | / | 8.1 | 8.3 | / | / | / | |
| sd | 0.1 | 0.1 | 2.6 | / | 0.2 | 0.2 | / | / | / | 0 | 0 | / | / | / | |
| max | 8.2 | 8.4 | 8.4 | / | 8.2 | 8.4 | / | / | / | 8.2 | 8.4 | / | / | / | |
| EC (µS/cm at 25 °C) | min | 154 | 322 | 111 | / | 143 | 290 | / | / | / | 143 | 357 | / | / | / |
| mean | 182 | 391 | 156 | / | 175 | 387 | / | / | / | 162 | 393 | / | / | / | |
| sd | 25 | 39 | 32 | / | 24 | 40 | / | / | / | 31 | 40 | / | / | / | |
| max | 244 | 454 | 224 | / | 204 | 444 | / | / | / | 198 | 444 | / | / | / | |
| HCO3− hydrogencarbonate (mg/L) | min | 73.2 | 207.5 | 47.0 | / | 76.3 | 195.0 | 142.0 | 142.0 | / | 75.1 | 140.3 | / | / | / |
| mean | 94.1 | 258.0 | 75.4 | / | 95.4 | 254.8 | 148.0 | 150.0 | / | 90.7 | 230.7 | / | / | / | |
| sd | 23.9 | 30.2 | 17.1 | / | 14.4 | 30.5 | 4.0 | 5.0 | / | 27.1 | 62.7 | / | / | / | |
| max | 140.3 | 294.7 | 103.7 | / | 114.0 | 289.0 | 154.0 | 159.0 | / | 122.0 | 273.4 | / | / | / | |
| Cl− chloride (1-) (mg/L) | min | 5.9 | 5.3 | 4.9 | / | 4.9 | 5.1 | 3.9 | 4.1 | / | 5.3 | 0.9 | / | / | / |
| mean | 6.9 | 5.8 | 5.6 | / | 5.9 | 5.4 | 4.4 | 4.7 | / | 5.8 | 5.4 | / | / | / | |
| sd | 1.0 | 0.6 | 0.6 | / | 0.9 | 0.2 | 0.5 | 0.3 | / | 0.7 | 3.1 | / | / | ||
| max | 8.6 | 7.2 | 6.4 | / | 7.6 | 5.6 | 5.1 | 5.0 | / | 6.5 | 7.6 | / | / | / | |
| SO42− tetraoxidosulfate (2-) (mg/L) | min | 4.0 | 5.0 | 3.1 | / | 4.2 | 4.9 | 1.0 | 1.0 | / | 4.8 | 1.7 | / | / | / |
| mean | 4.9 | 6.1 | 5.0 | / | 5.7 | 6.2 | 1.3 | 1.1 | / | 6.2 | 7.8 | / | / | / | |
| sd | 1.2 | 0.9 | 1.3 | / | 0.8 | 0.6 | 0.2 | 0.1 | / | 2.1 | 4.7 | / | / | / | |
| max | 7.4 | 7.6 | 7.0 | / | 6.5 | 7.1 | 1.6 | 1.3 | / | 8.7 | 12.9 | / | / | / | |
| NO3− trioxidonitrate (1-) (mg/L) | min | 0.6 | 0.4 | 0.1 | / | 2.0 | 1.0 | 2.2 | 3.7 | / | 1.2 | 1.2 | / | / | / |
| mean | 1.7 | 0.7 | 0.3 | / | 2.8 | 1.3 | 2.4 | 4.4 | / | 1.8 | 1.2 | / | / | / | |
| sd | 1.0 | 0.2 | 0.1 | / | 0.7 | 0.1 | 0.1 | 0.4 | / | 0.7 | 0 | / | / | / | |
| max | 3.5 | 0.9 | 0.4 | / | 3.9 | 1.4 | 2.5 | 4.8 | / | 2.6 | 1.2 | / | / | / | |
| Na+ sodium (1+) (mg/L) | min | 3.3 | 3.1 | 2.7 | / | 3.2 | 3.4 | 2.7 | 3.2 | / | 3.5 | 0.8 | / | / | / |
| mean | 3.8 | 3.3 | 3.2 | / | 4.4 | 3.7 | 2.9 | 3.7 | / | 3.9 | 3.4 | / | / | / | |
| sd | 0.5 | 0.2 | 0.3 | / | 0.9 | 0.4 | 0.1 | 0.7 | / | 0.7 | 1.7 | / | / | / | |
| max | 4.6 | 3.6 | 3.5 | / | 5.8 | 4.6 | 3.0 | 5.6 | / | 4.7 | 4.5 | / | / | / | |
| K+ potassium (1+) (mg/L) | min | 0.5 | 0.3 | 0.1 | / | 0.4 | 0.3 | 0.1 | 0.1 | / | 0.3 | 0.1 | / | / | / |
| mean | 1.1 | 0.7 | 0.2 | / | 0.9 | 0.4 | 0.1 | 0.1 | / | 0.4 | 0.3 | / | / | / | |
| sd | 0.4 | 0.6 | 0.0 | / | 0.4 | 0.1 | 0.0 | 0.0 | / | 0.1 | 0.1 | / | / | / | |
| max | 1.4 | 2.2 | 0.3 | / | 1.6 | 0.5 | 0.1 | 0.1 | / | 0.5 | 0.5 | / | / | / | |
| Ca2+ calcium (2+) (mg/L) | min | 16.0 | 29.0 | 11.6 | / | 16.8 | 22.8 | 25.7 | 24.6 | / | 16.1 | 29.1 | / | / | / |
| mean | 17.8 | 37.2 | 18.0 | / | 19.4 | 35.8 | 26.8 | 26.5 | / | 18.3 | 35.4 | / | / | / | |
| sd | 1.5 | 5.6 | 3.8 | / | 1.3 | 7.4 | 0.7 | 0.9 | / | 2.1 | 6.5 | / | / | / | |
| max | 20.4 | 43.9 | 22.5 | / | 20.7 | 43.5 | 27.6 | 27.5 | / | 20.1 | 43.2 | / | / | / | |
| Mg2+ magnesium (2+) (mg/L) | min | 6.4 | 28.1 | 3.7 | / | 6.0 | 26.7 | 12.6 | 14.0 | / | 6 | 29.2 | / | / | / |
| mean | 9.3 | 30.2 | 4.9 | / | 9.0 | 30.8 | 13.6 | 14.6 | / | 8.4 | 31.6 | / | / | / | |
| sd | 3.1 | 1.2 | 0.9 | / | 2.3 | 2.4 | 0.7 | 0.5 | / | 3.7 | 2.9 | / | / | / | |
| max | 15.0 | 31.8 | 6.1 | / | 12.1 | 34.9 | 14.4 | 15.2 | / | 12.7 | 35 | / | / | / | |
| n | 13 | 17 | 10 | 17 | 7 | 9 | 5 | 9 | 7 | 3 | 4 | 2 | 2 | 2 | |
| δ¹⁸O oxygen-18 (‰) | min | −8.21 | −6.01 | −35.95 | −9.68 | −6.85 | −6.65 | −6.49 | −6.63 | −6.67 | −7.11 | −6.29 | −6.46 | −6.26 | −6.72 |
| mean | −6.29 | −5.77 | −34.95 | −5.56 | −6.49 | −6.28 | −6.32 | −6.47 | −6.5 | −6.85 | −5.96 | −6.28 | −6.23 | −6.45 | |
| sd | 0.88 | 0.12 | 0.69 | 2.20 | 0.29 | 0.18 | 0.23 | 0.09 | 0.15 | 0.23 | 0.28 | 0.25 | 0.04 | 0.39 | |
| max | −5.03 | −5.55 | −34.00 | −1.75 | −6.08 | −6.08 | −5.94 | −6.32 | −6.32 | −6.70 | −5.63 | −5.94 | −6.20 | −6.17 | |
| δ²H deuterium (‰) | min | −50.1 | −36.0 | −52.6 | −62.9 | −43.7 | −41.0 | −41.8 | −41 | −41.3 | −46.2 | −40.9 | −40.0 | −34.3 | −41.8 |
| mean | −36.3 | −34.2 | −39.0 | −31.8 | −40.1 | −39.5 | −39.2 | −40.3 | −40.8 | −42.1 | −38.5 | −38.5 | −33.5 | −37.6 | |
| sd | 6.3 | 0.9 | 7.6 | 16.7 | 2.5 | 1.3 | 1.8 | 0.4 | 0.6 | 4.4 | 2.2 | 1.3 | 1.1 | 5.9 | |
| max | −27.5 | −32.7 | −29.5 | −1.8 | −37.0 | −37.0 | −37 | −40 | −40 | −37.5 | −36.3 | −37.0 | −32.7 | −33.5 | |
| d-excess (‰) | min | 12.2 | 10.0 | 13.4 | 8.9 | 10.5 | 9.6 | 10.1 | 10.6 | 9.3 | 10.7 | 8.7 | 10.5 | 15.8 | 12.0 |
| mean | 14.0 | 11.9 | 15.4 | 12.7 | 11.8 | 10.8 | 11.4 | 11.5 | 11.2 | 12.7 | 9.2 | 11.7 | 16.3 | 13.9 | |
| sd | 1.0 | 0.9 | 1.9 | 2.5 | 0.8 | 0.9 | 1.4 | 0.6 | 1.0 | 3.0 | 0.6 | 1.4 | 0.8 | 2.8 | |
| max | 15.6 | 13.7 | 19.8 | 16.7 | 12.6 | 12.2 | 13.7 | 12.4 | 12.2 | 16.1 | 10.0 | 13.7 | 16.9 | 15.9 | |
Disclaimer/Publisher’s Note: The statements, opinions and data contained in all publications are solely those of the individual author(s) and contributor(s) and not of MDPI and/or the editor(s). MDPI and/or the editor(s) disclaim responsibility for any injury to people or property resulting from any ideas, methods, instructions or products referred to in the content. |
© 2023 by the authors. Licensee MDPI, Basel, Switzerland. This article is an open access article distributed under the terms and conditions of the Creative Commons Attribution (CC BY) license (https://creativecommons.org/licenses/by/4.0/).
Share and Cite
Chimenti, M.; Natali, S.; Giannecchini, R.; Zanchetta, G.; Baneschi, I.; Doveri, M.; Isola, I.; Piccini, L. Hydrogeochemistry and Isotopic Composition of Waters in the Renella Cave (Central Italy): New Insights into Groundwater Dynamics. Water 2023, 15, 1764. https://doi.org/10.3390/w15091764
Chimenti M, Natali S, Giannecchini R, Zanchetta G, Baneschi I, Doveri M, Isola I, Piccini L. Hydrogeochemistry and Isotopic Composition of Waters in the Renella Cave (Central Italy): New Insights into Groundwater Dynamics. Water. 2023; 15(9):1764. https://doi.org/10.3390/w15091764
Chicago/Turabian StyleChimenti, Marco, Stefano Natali, Roberto Giannecchini, Giovanni Zanchetta, Ilaria Baneschi, Marco Doveri, Ilaria Isola, and Leonardo Piccini. 2023. "Hydrogeochemistry and Isotopic Composition of Waters in the Renella Cave (Central Italy): New Insights into Groundwater Dynamics" Water 15, no. 9: 1764. https://doi.org/10.3390/w15091764