

Quantifying the Impact of Coal Mining on Underground Water in Arid and Semi-Arid Area: A Case Study of the New Shanghai No. 1 Coal Mine, Ordos Basin, China
 , ,
, ,
Abstract
:1. Introduction
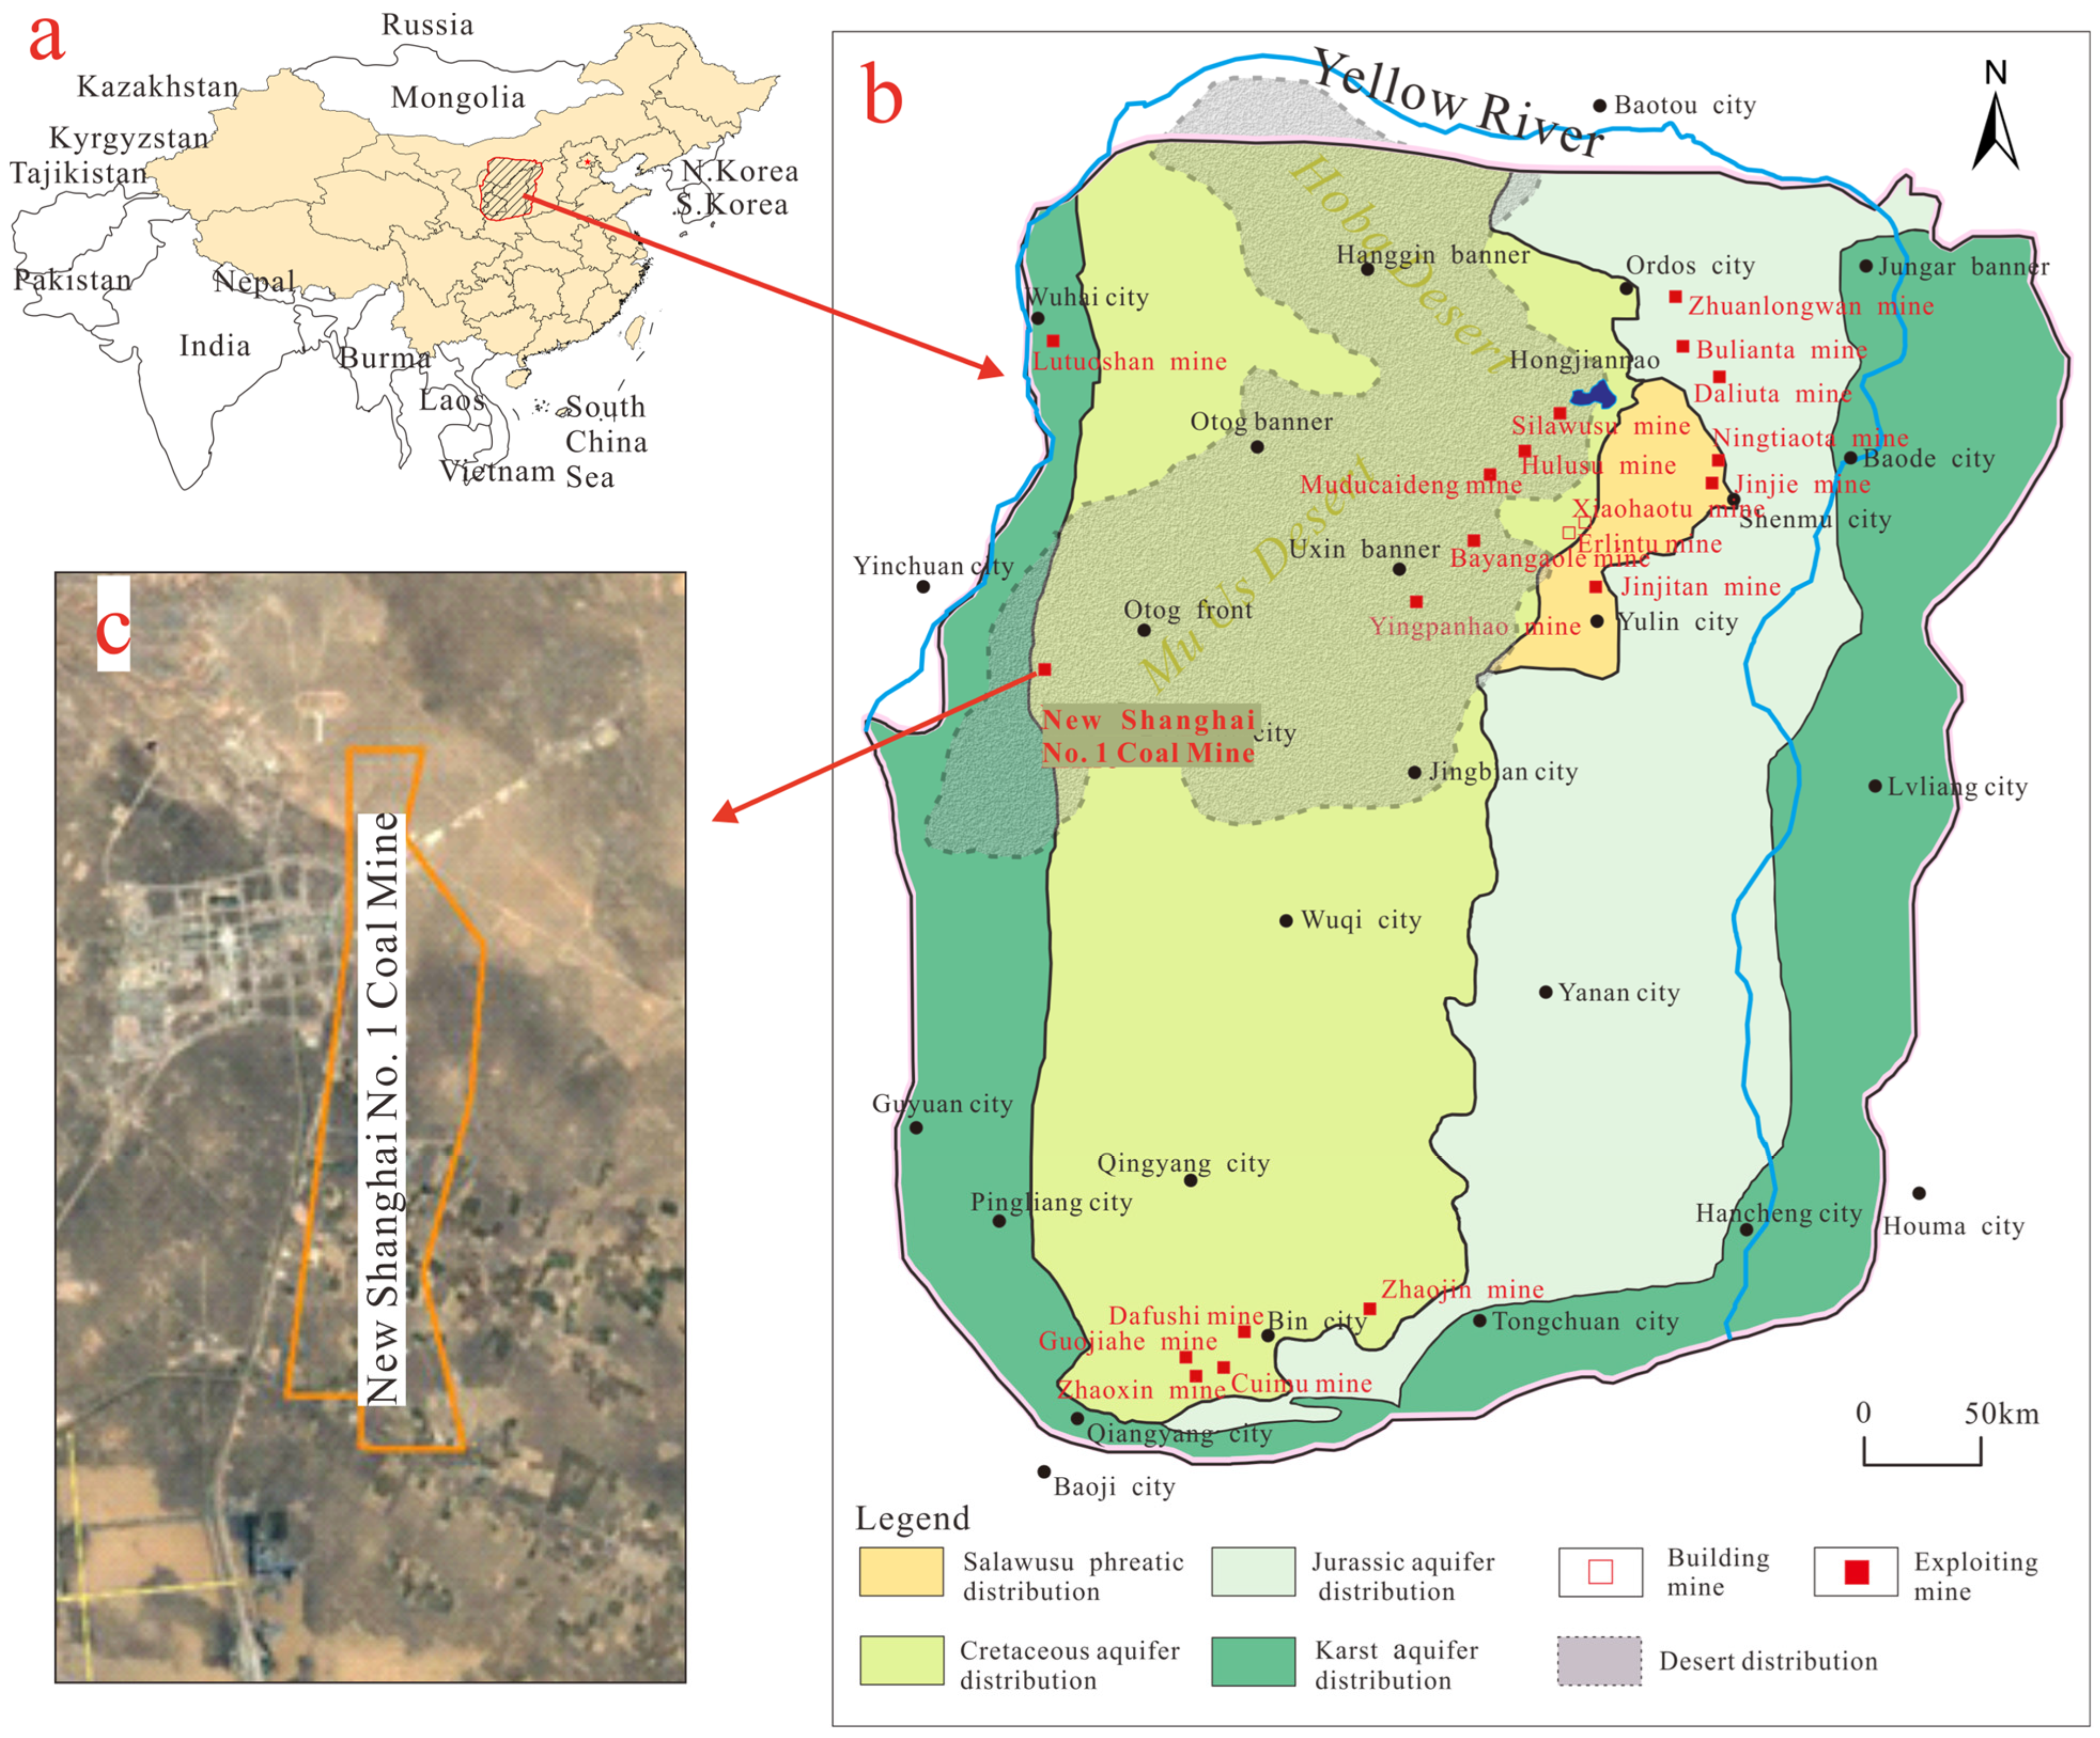
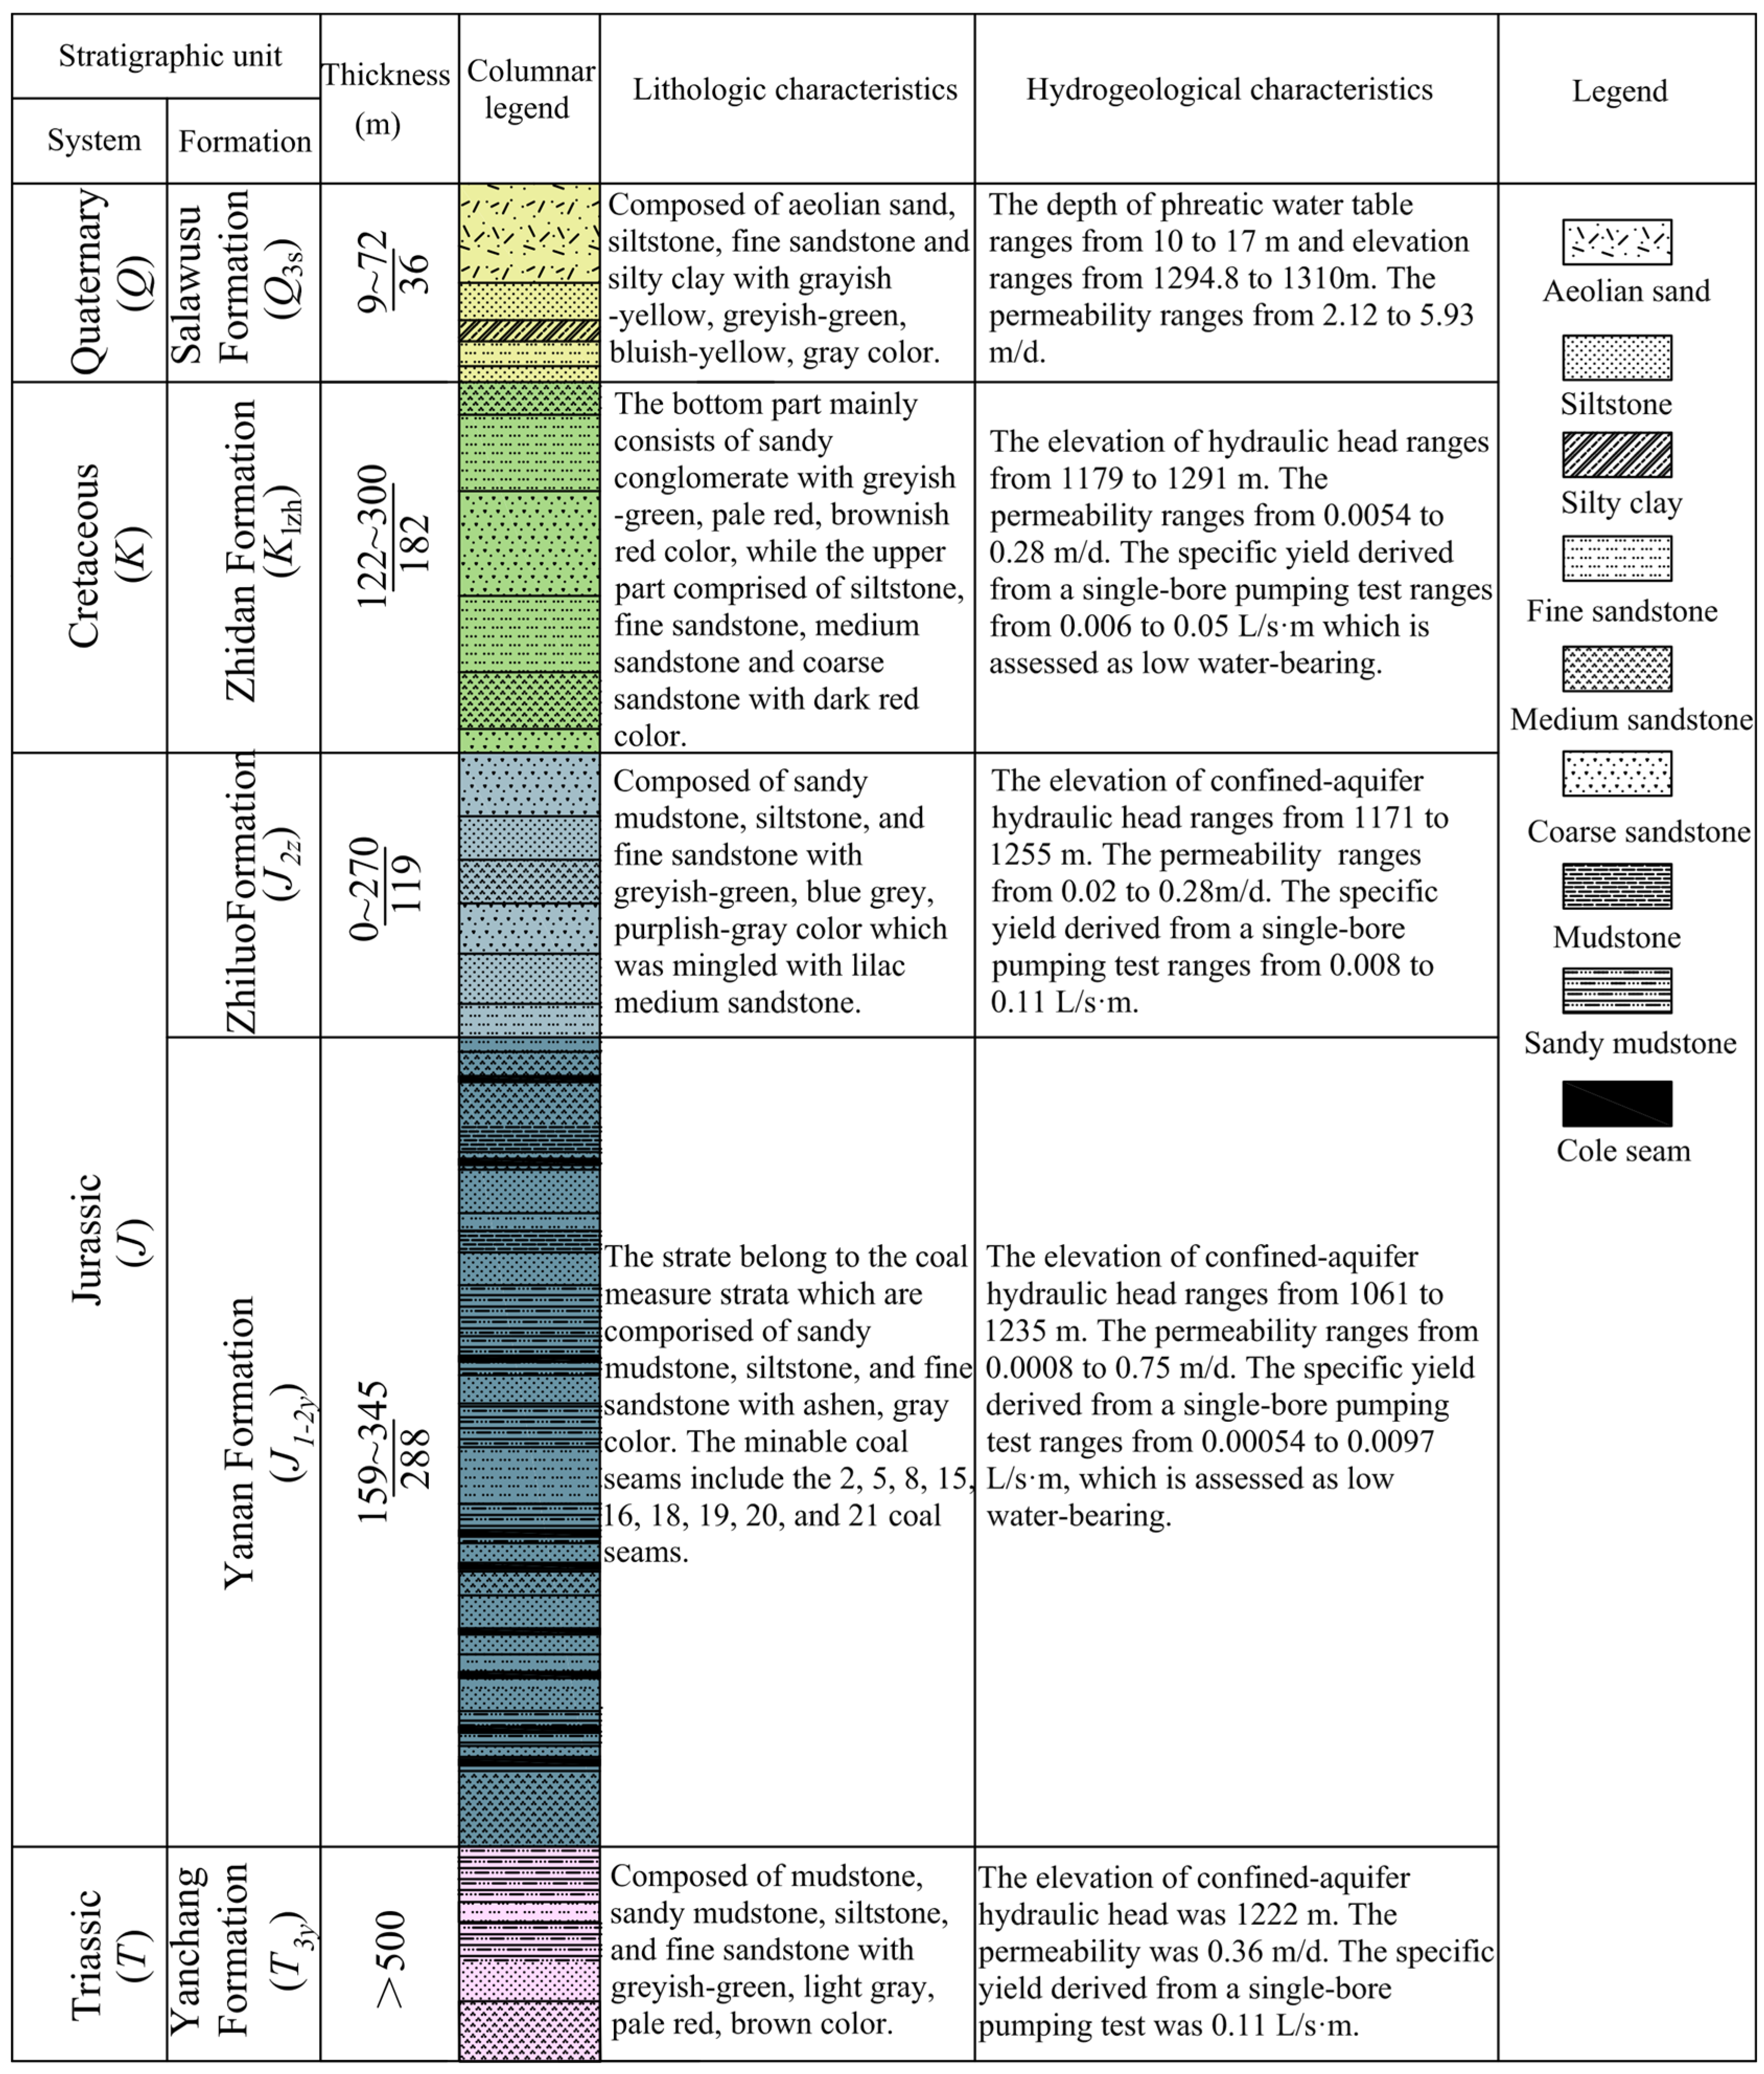
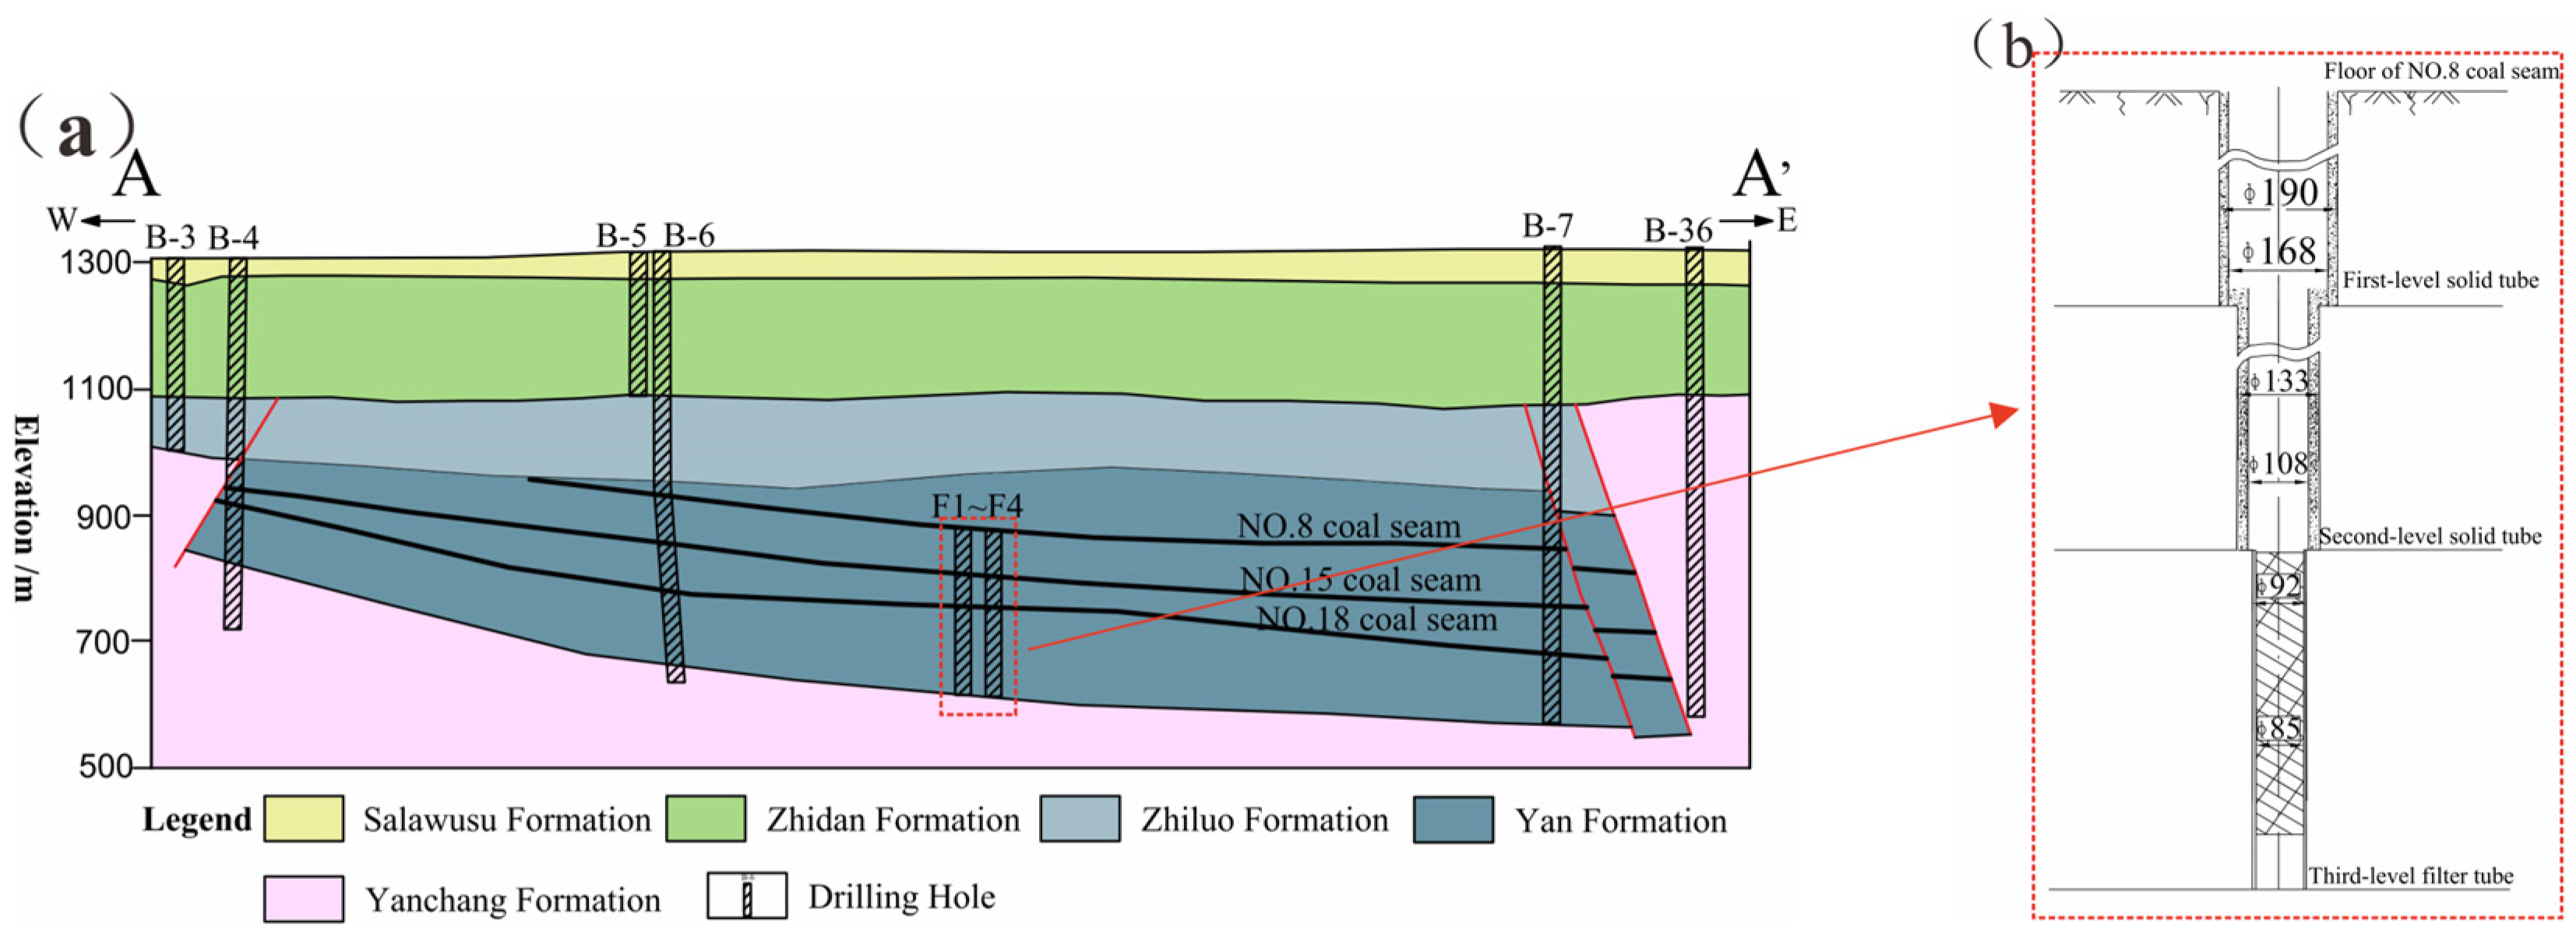
2. Study Area
3. Methodology
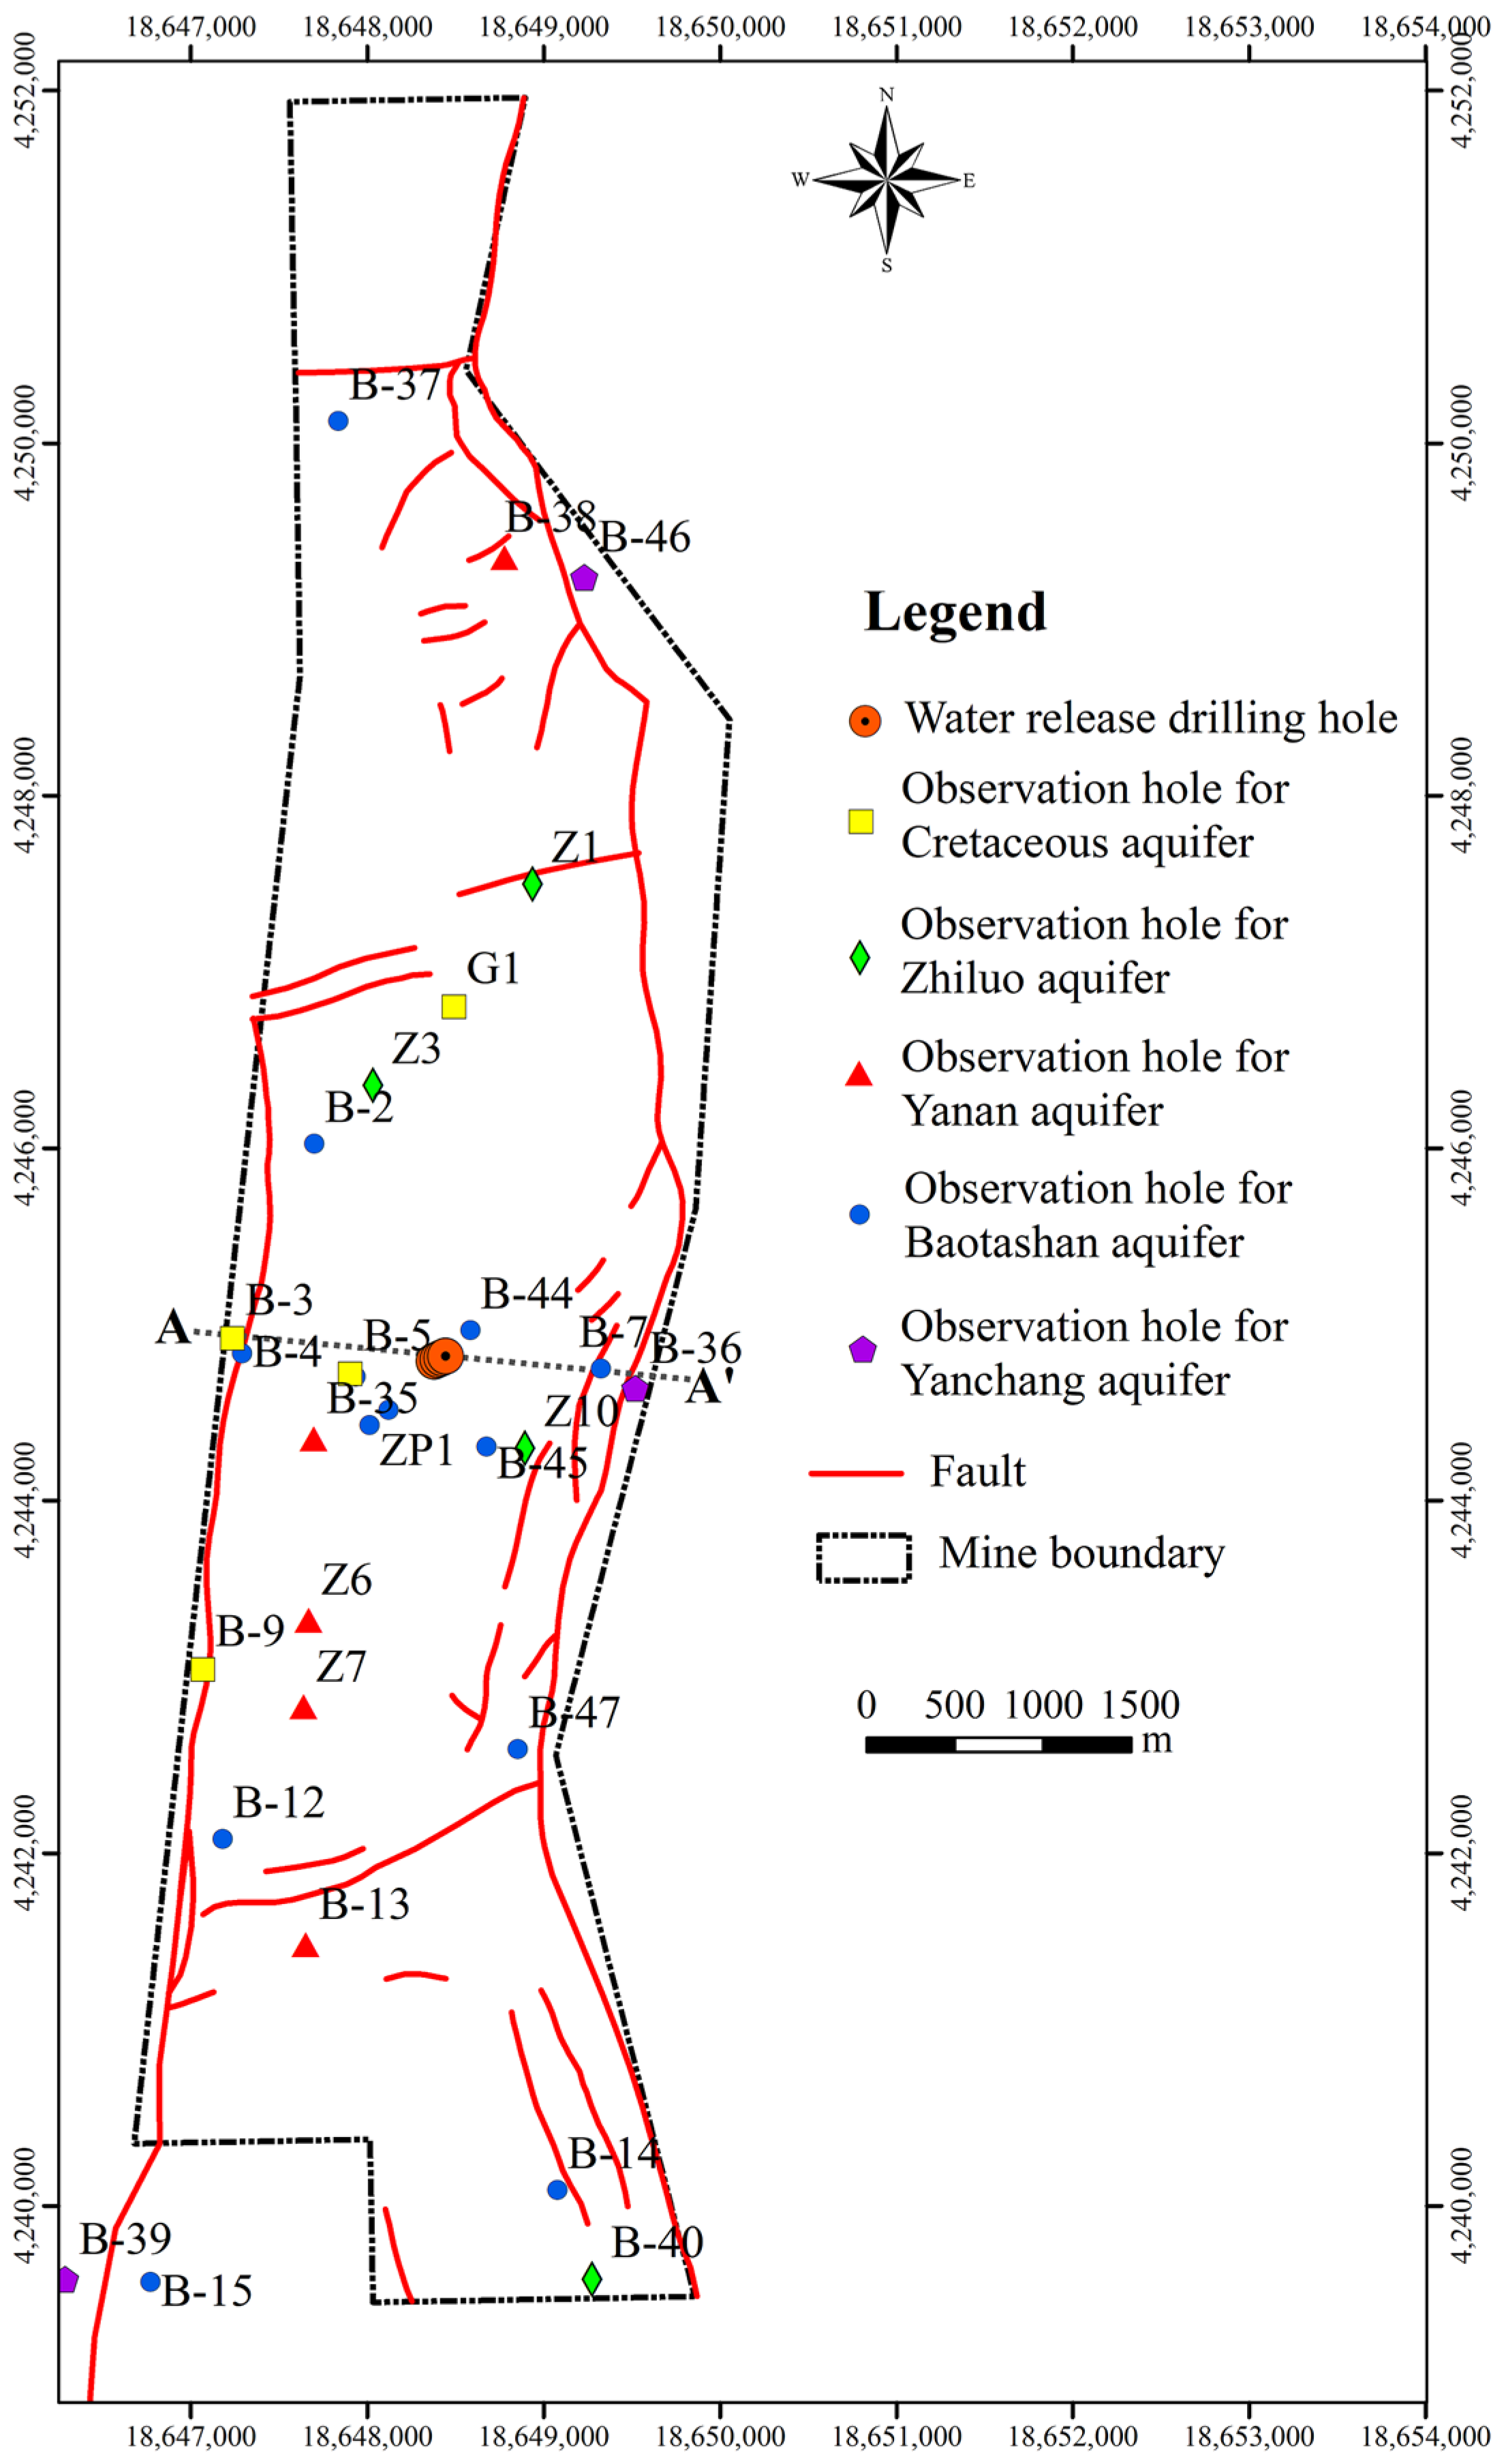
3.1. Water Release Test of Multiple Holes
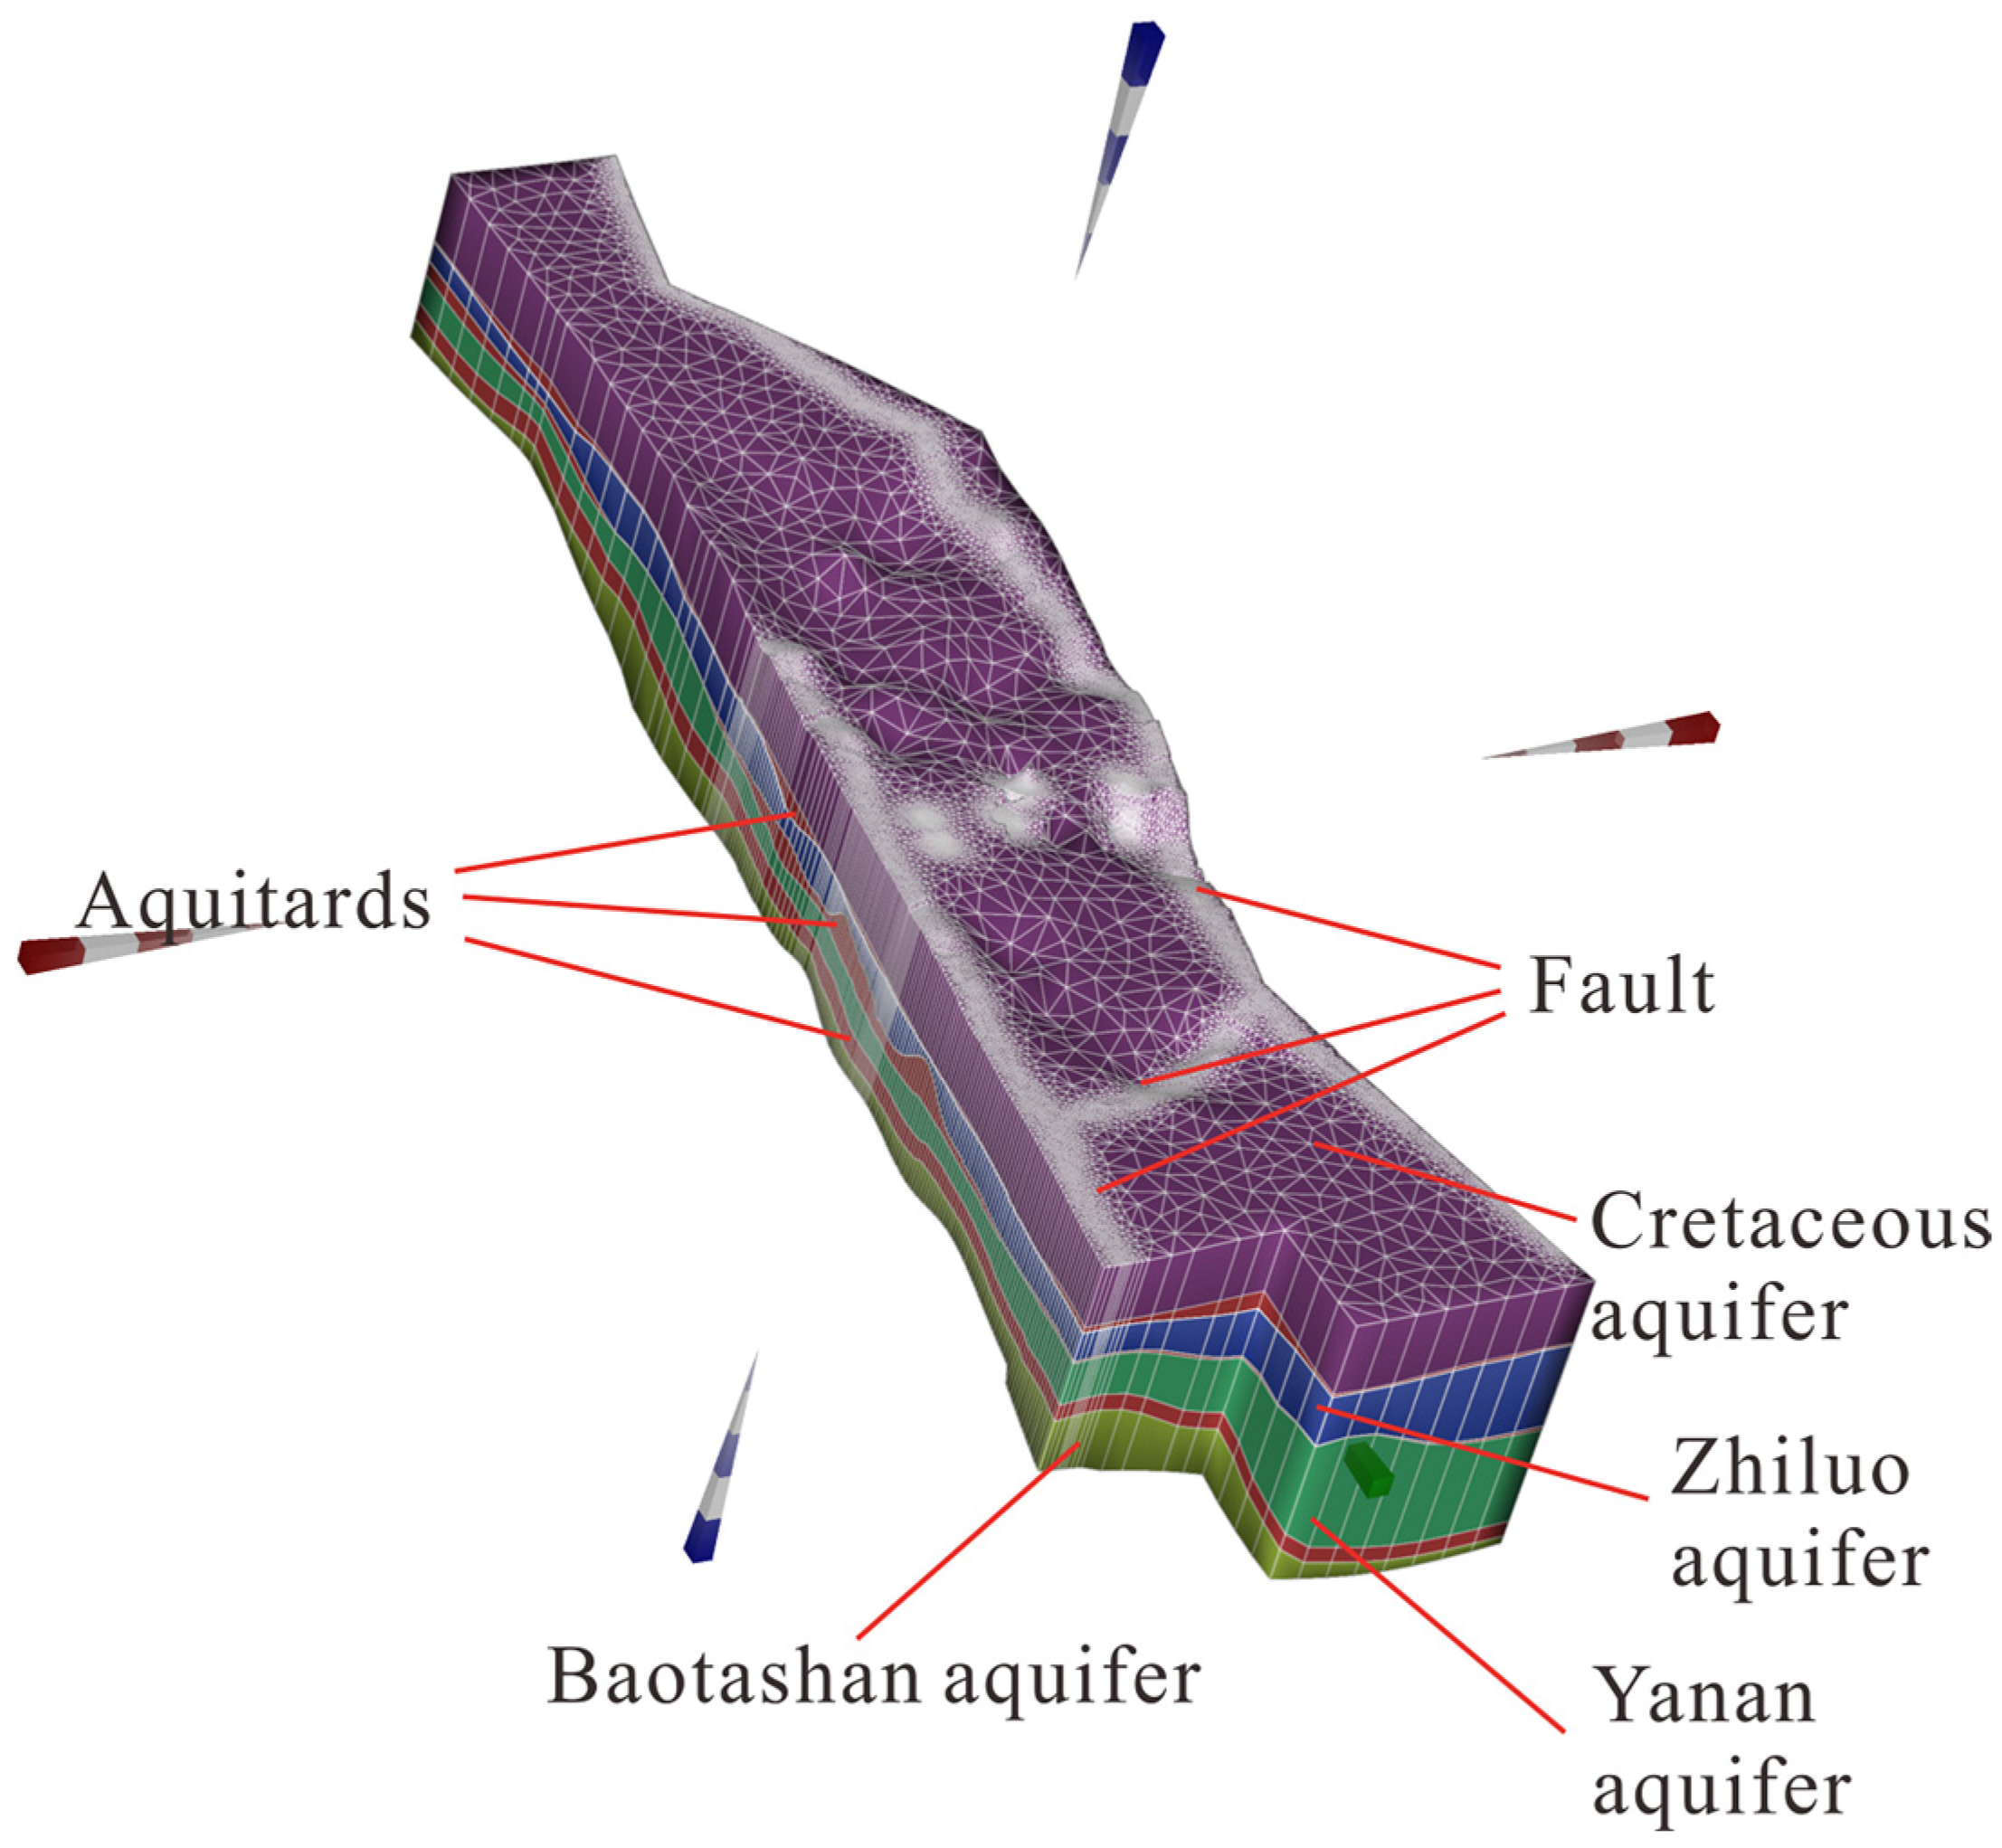
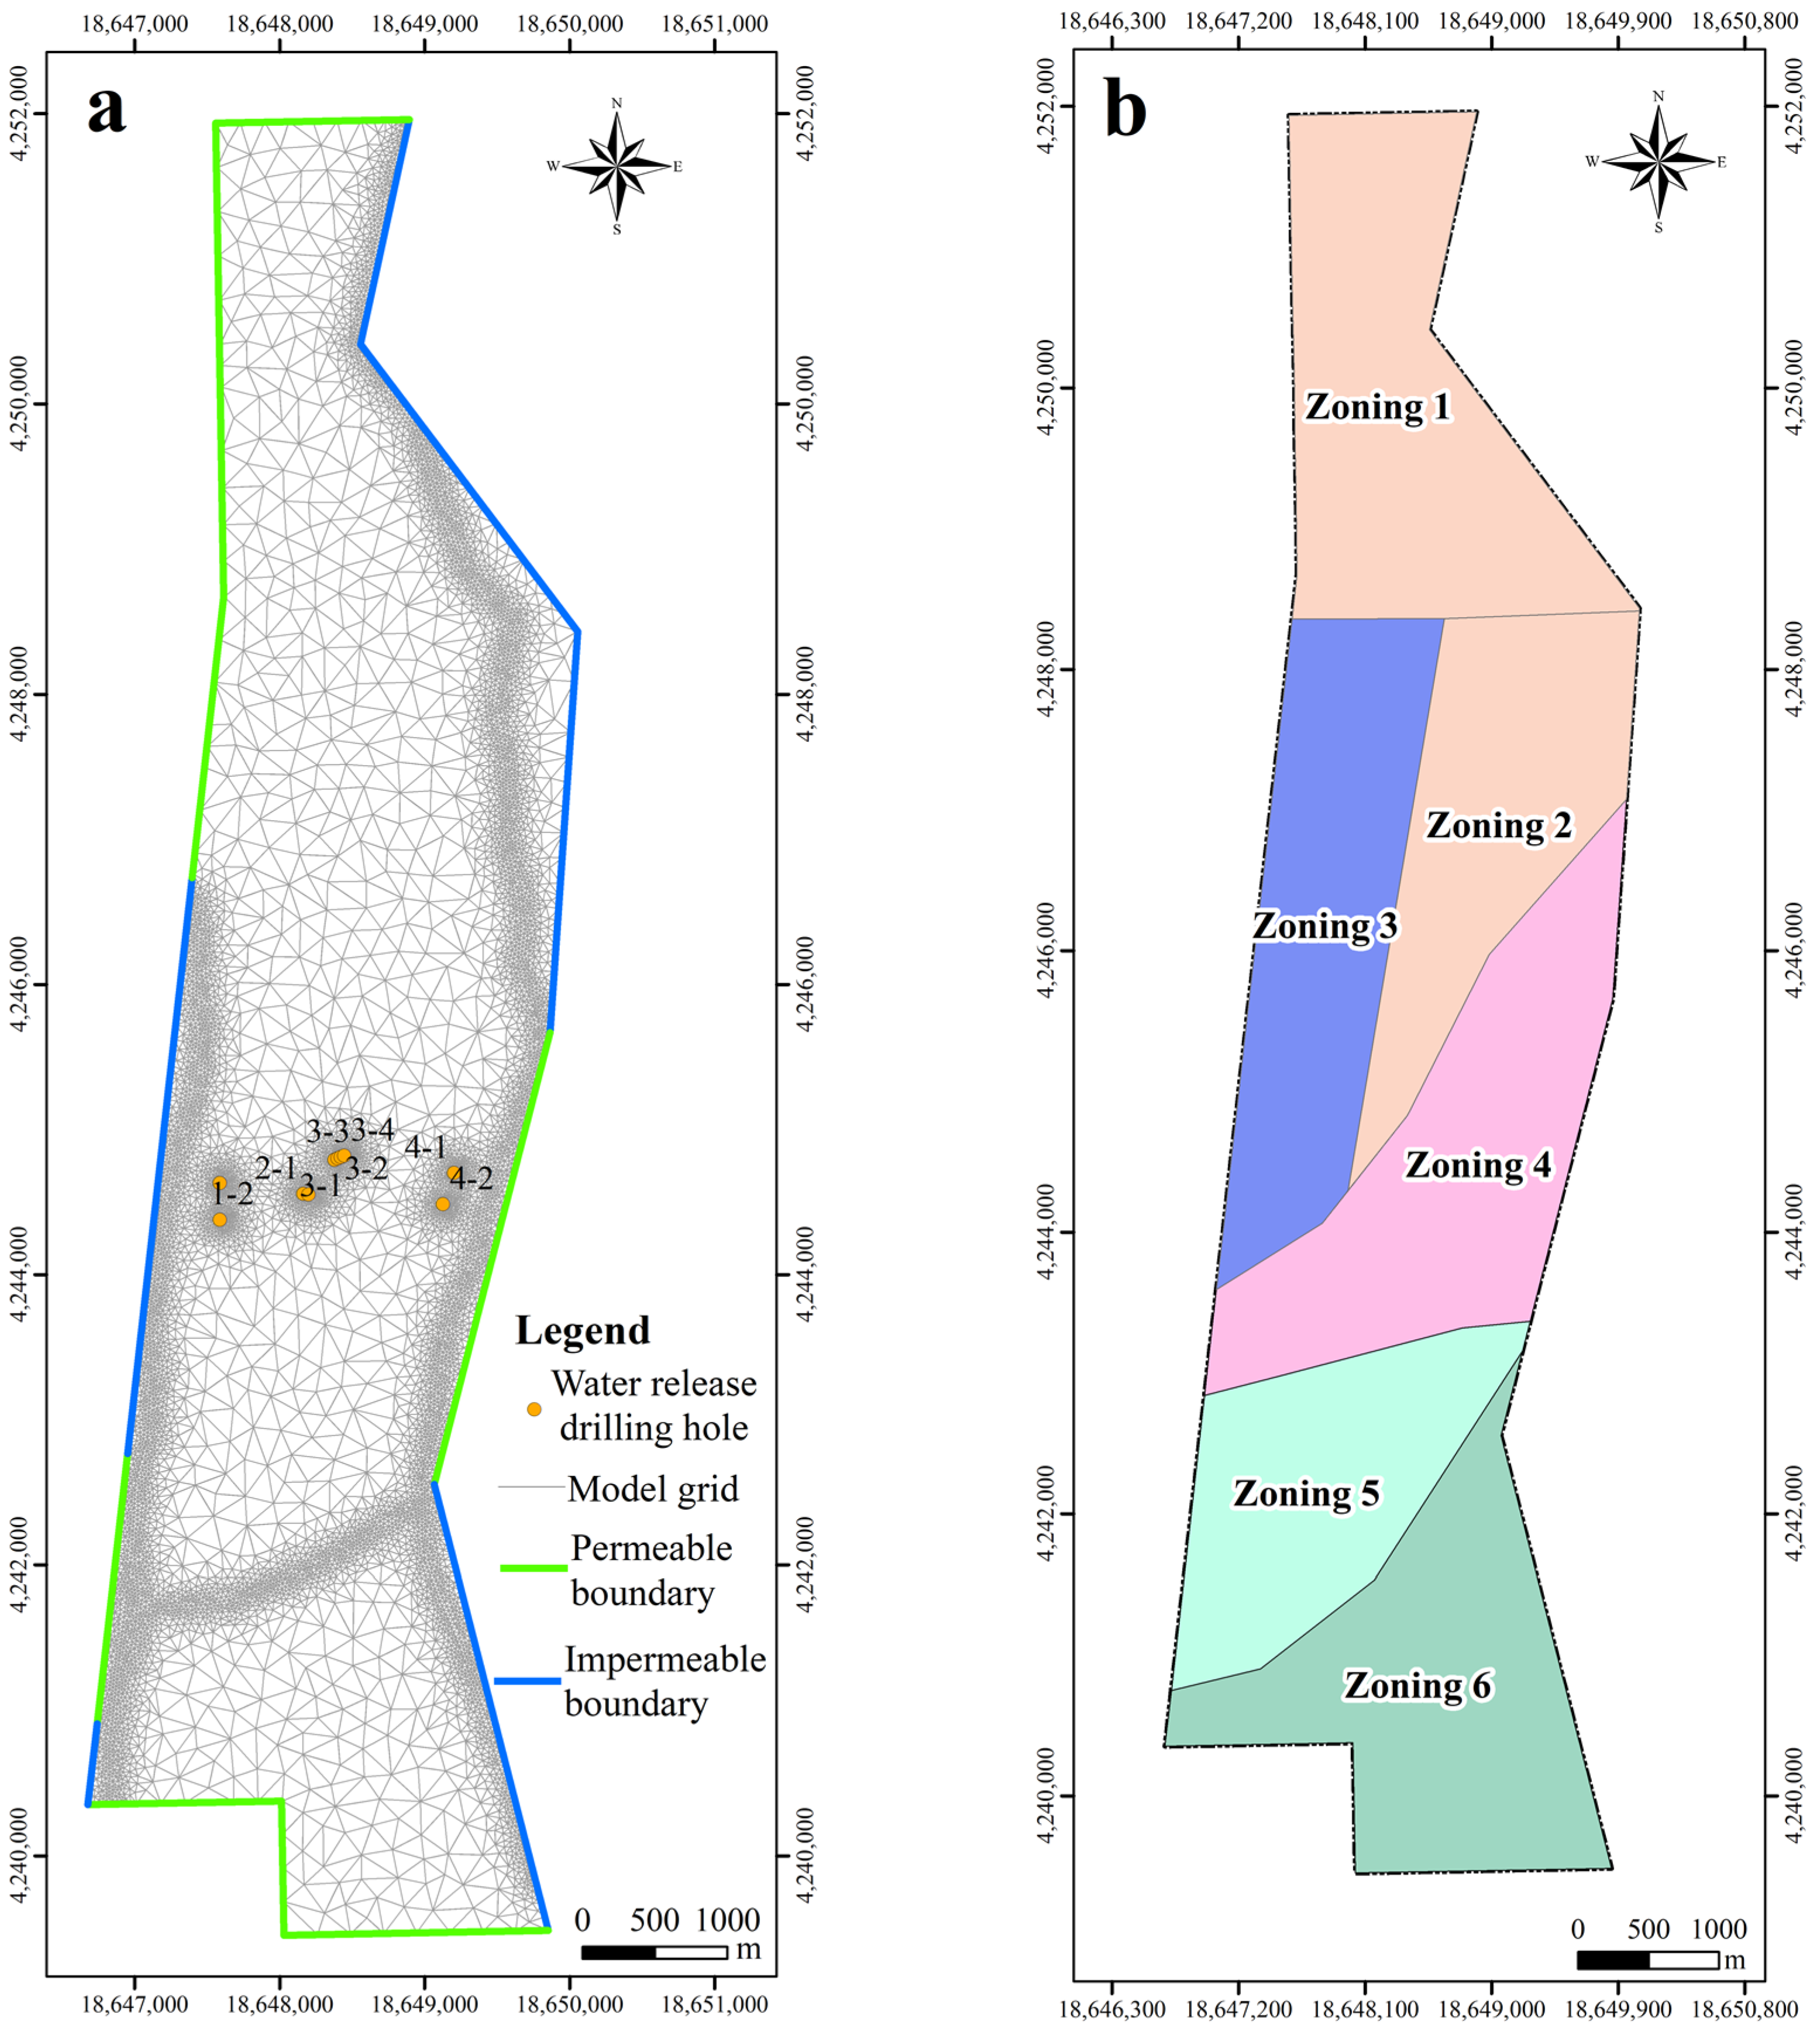
3.2. Numerical Simulation
4. Results
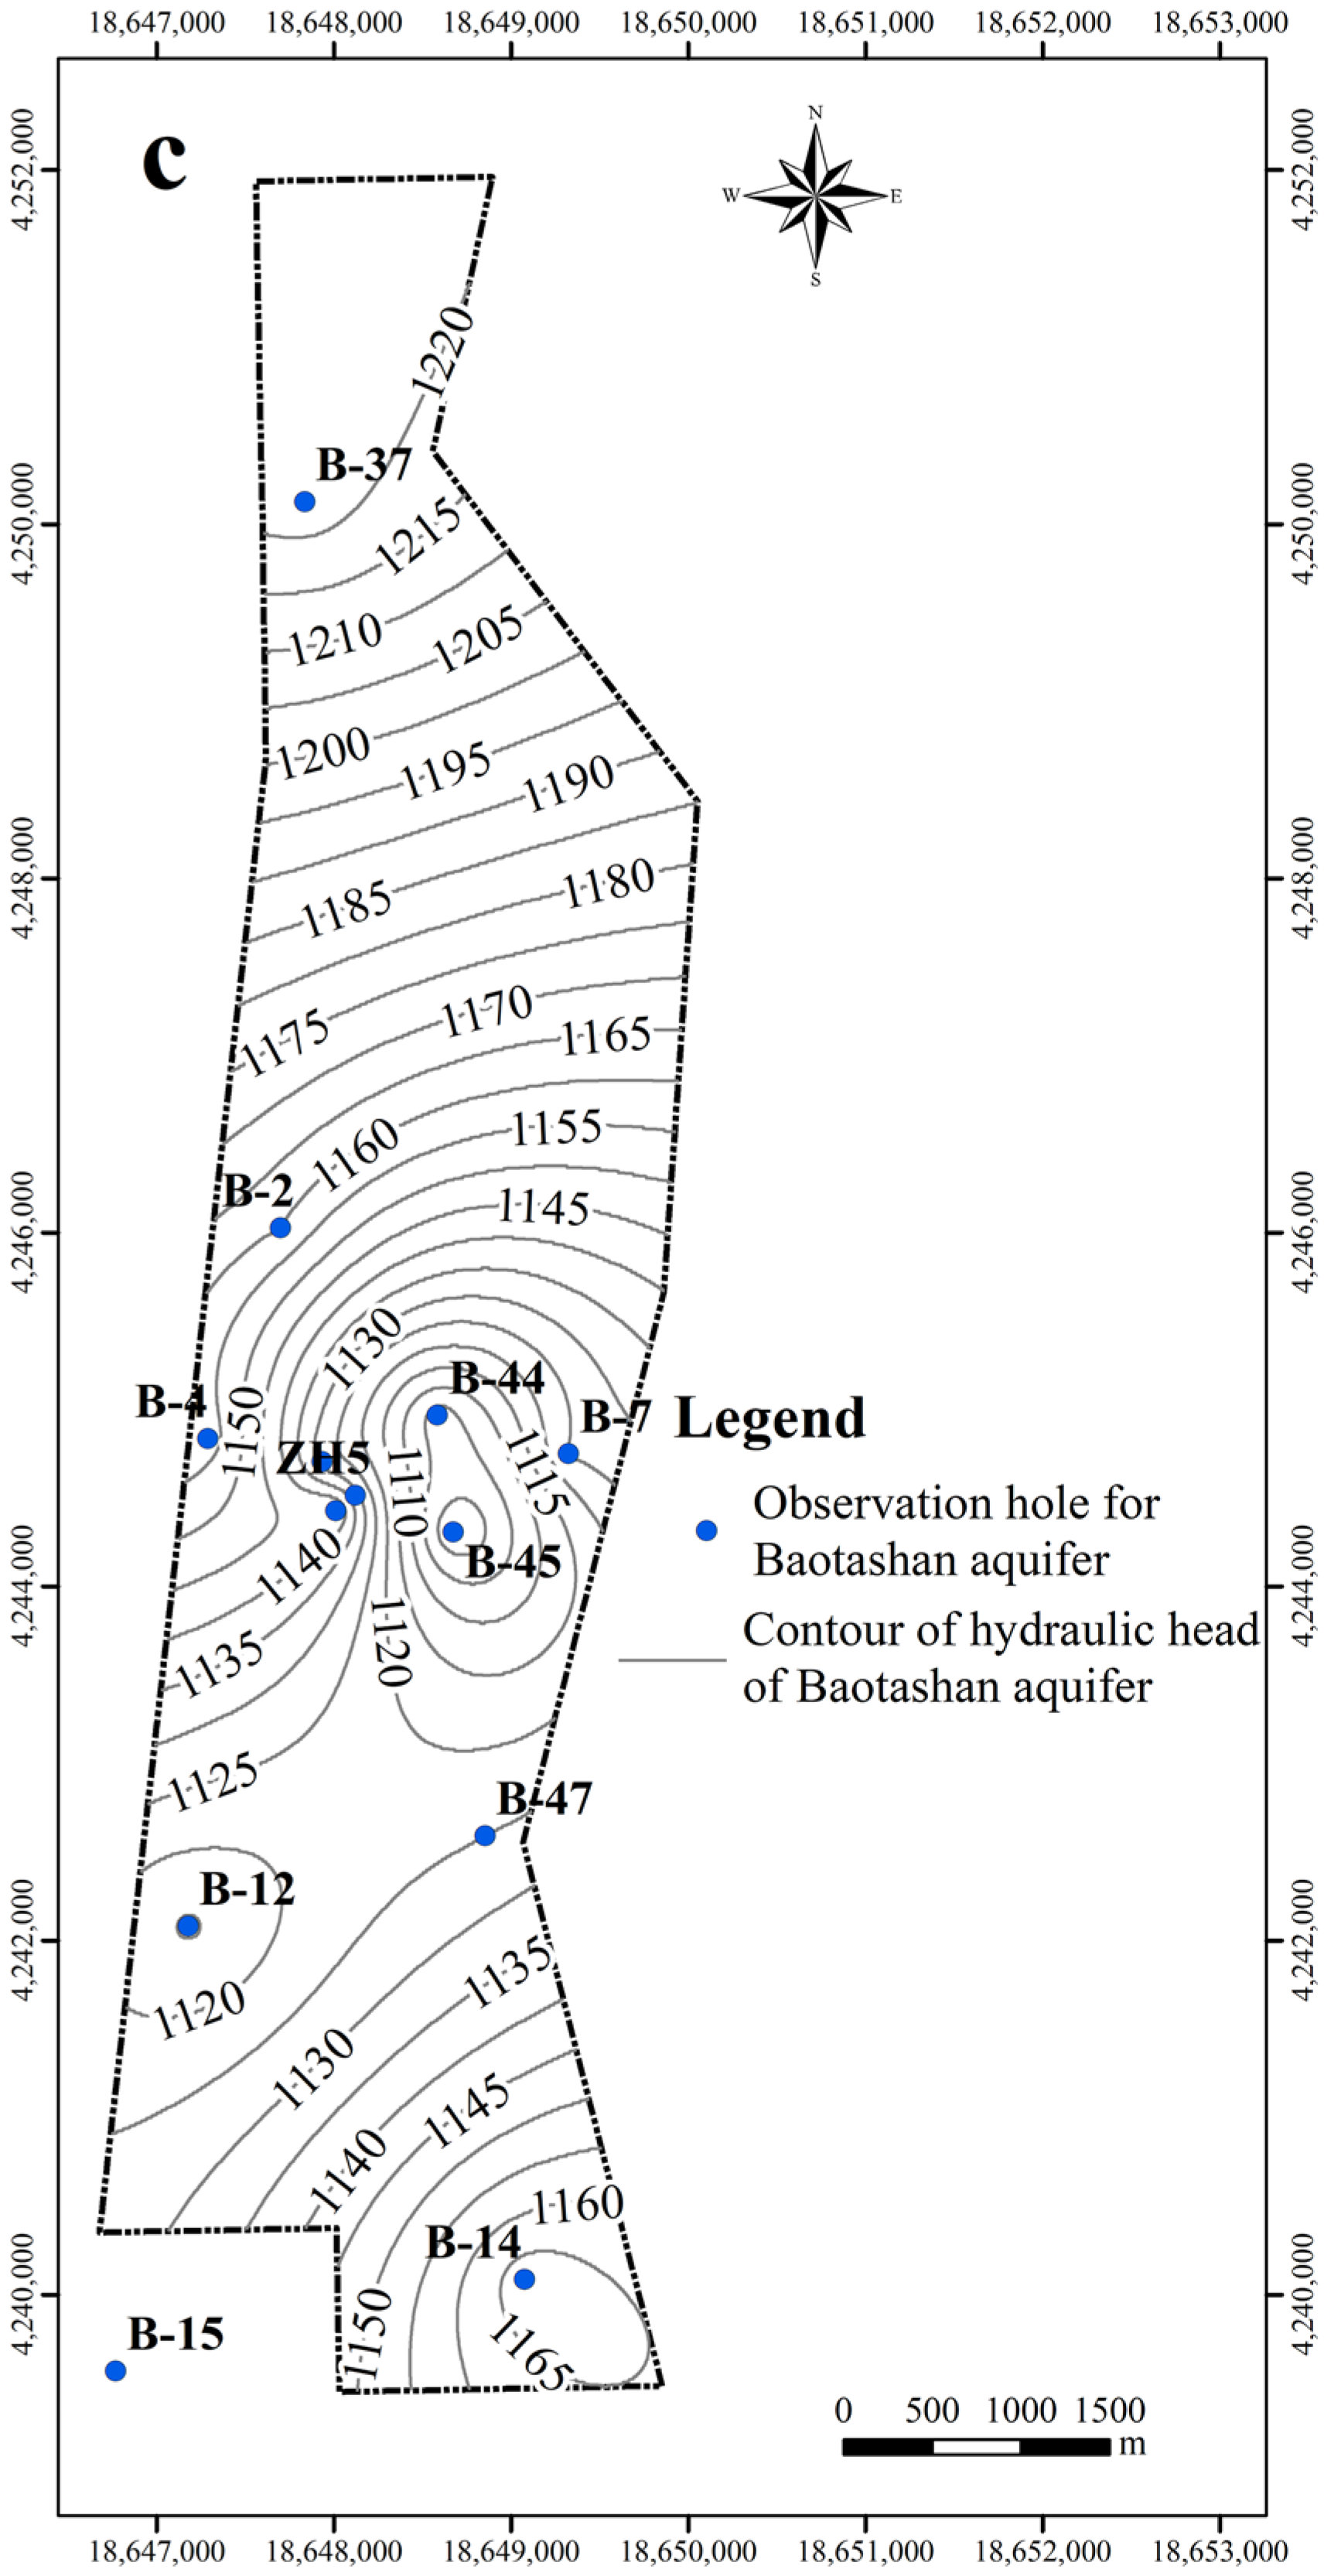
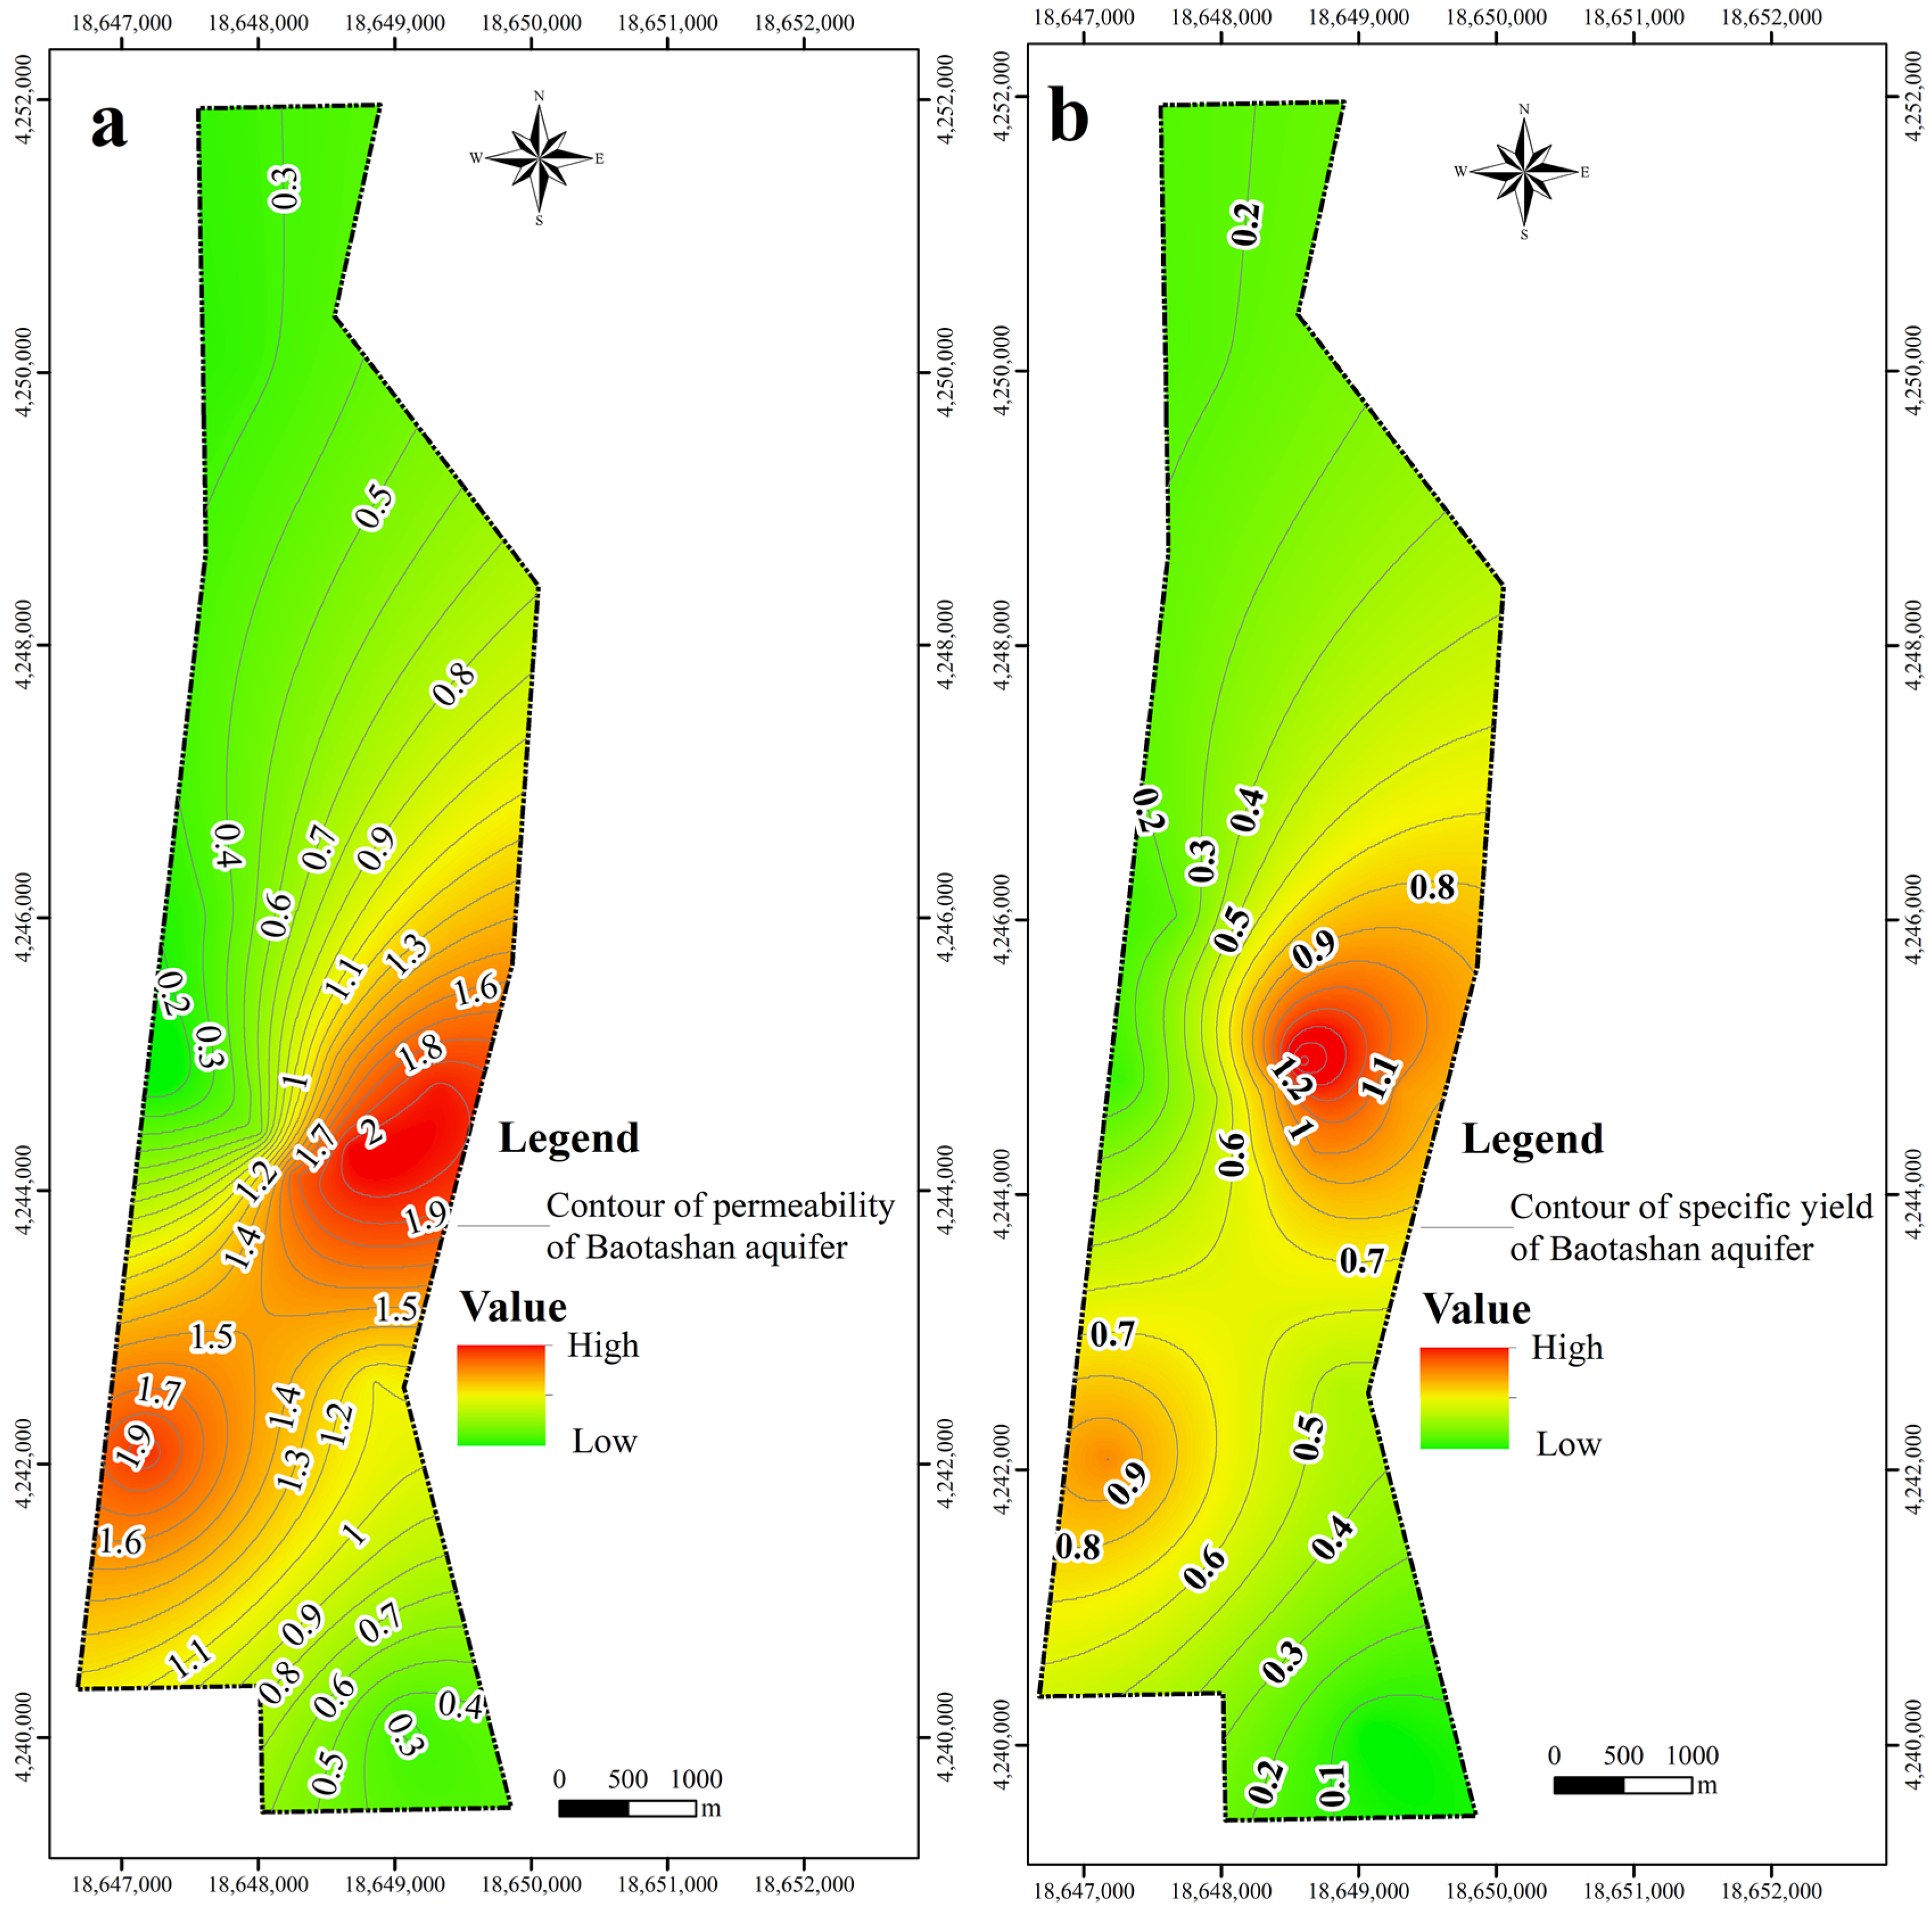
4.1. Hydrogeological Characteristics of the Baotashan Aquifer
4.2. Influence on Water Resources of Baotashan Aquifer
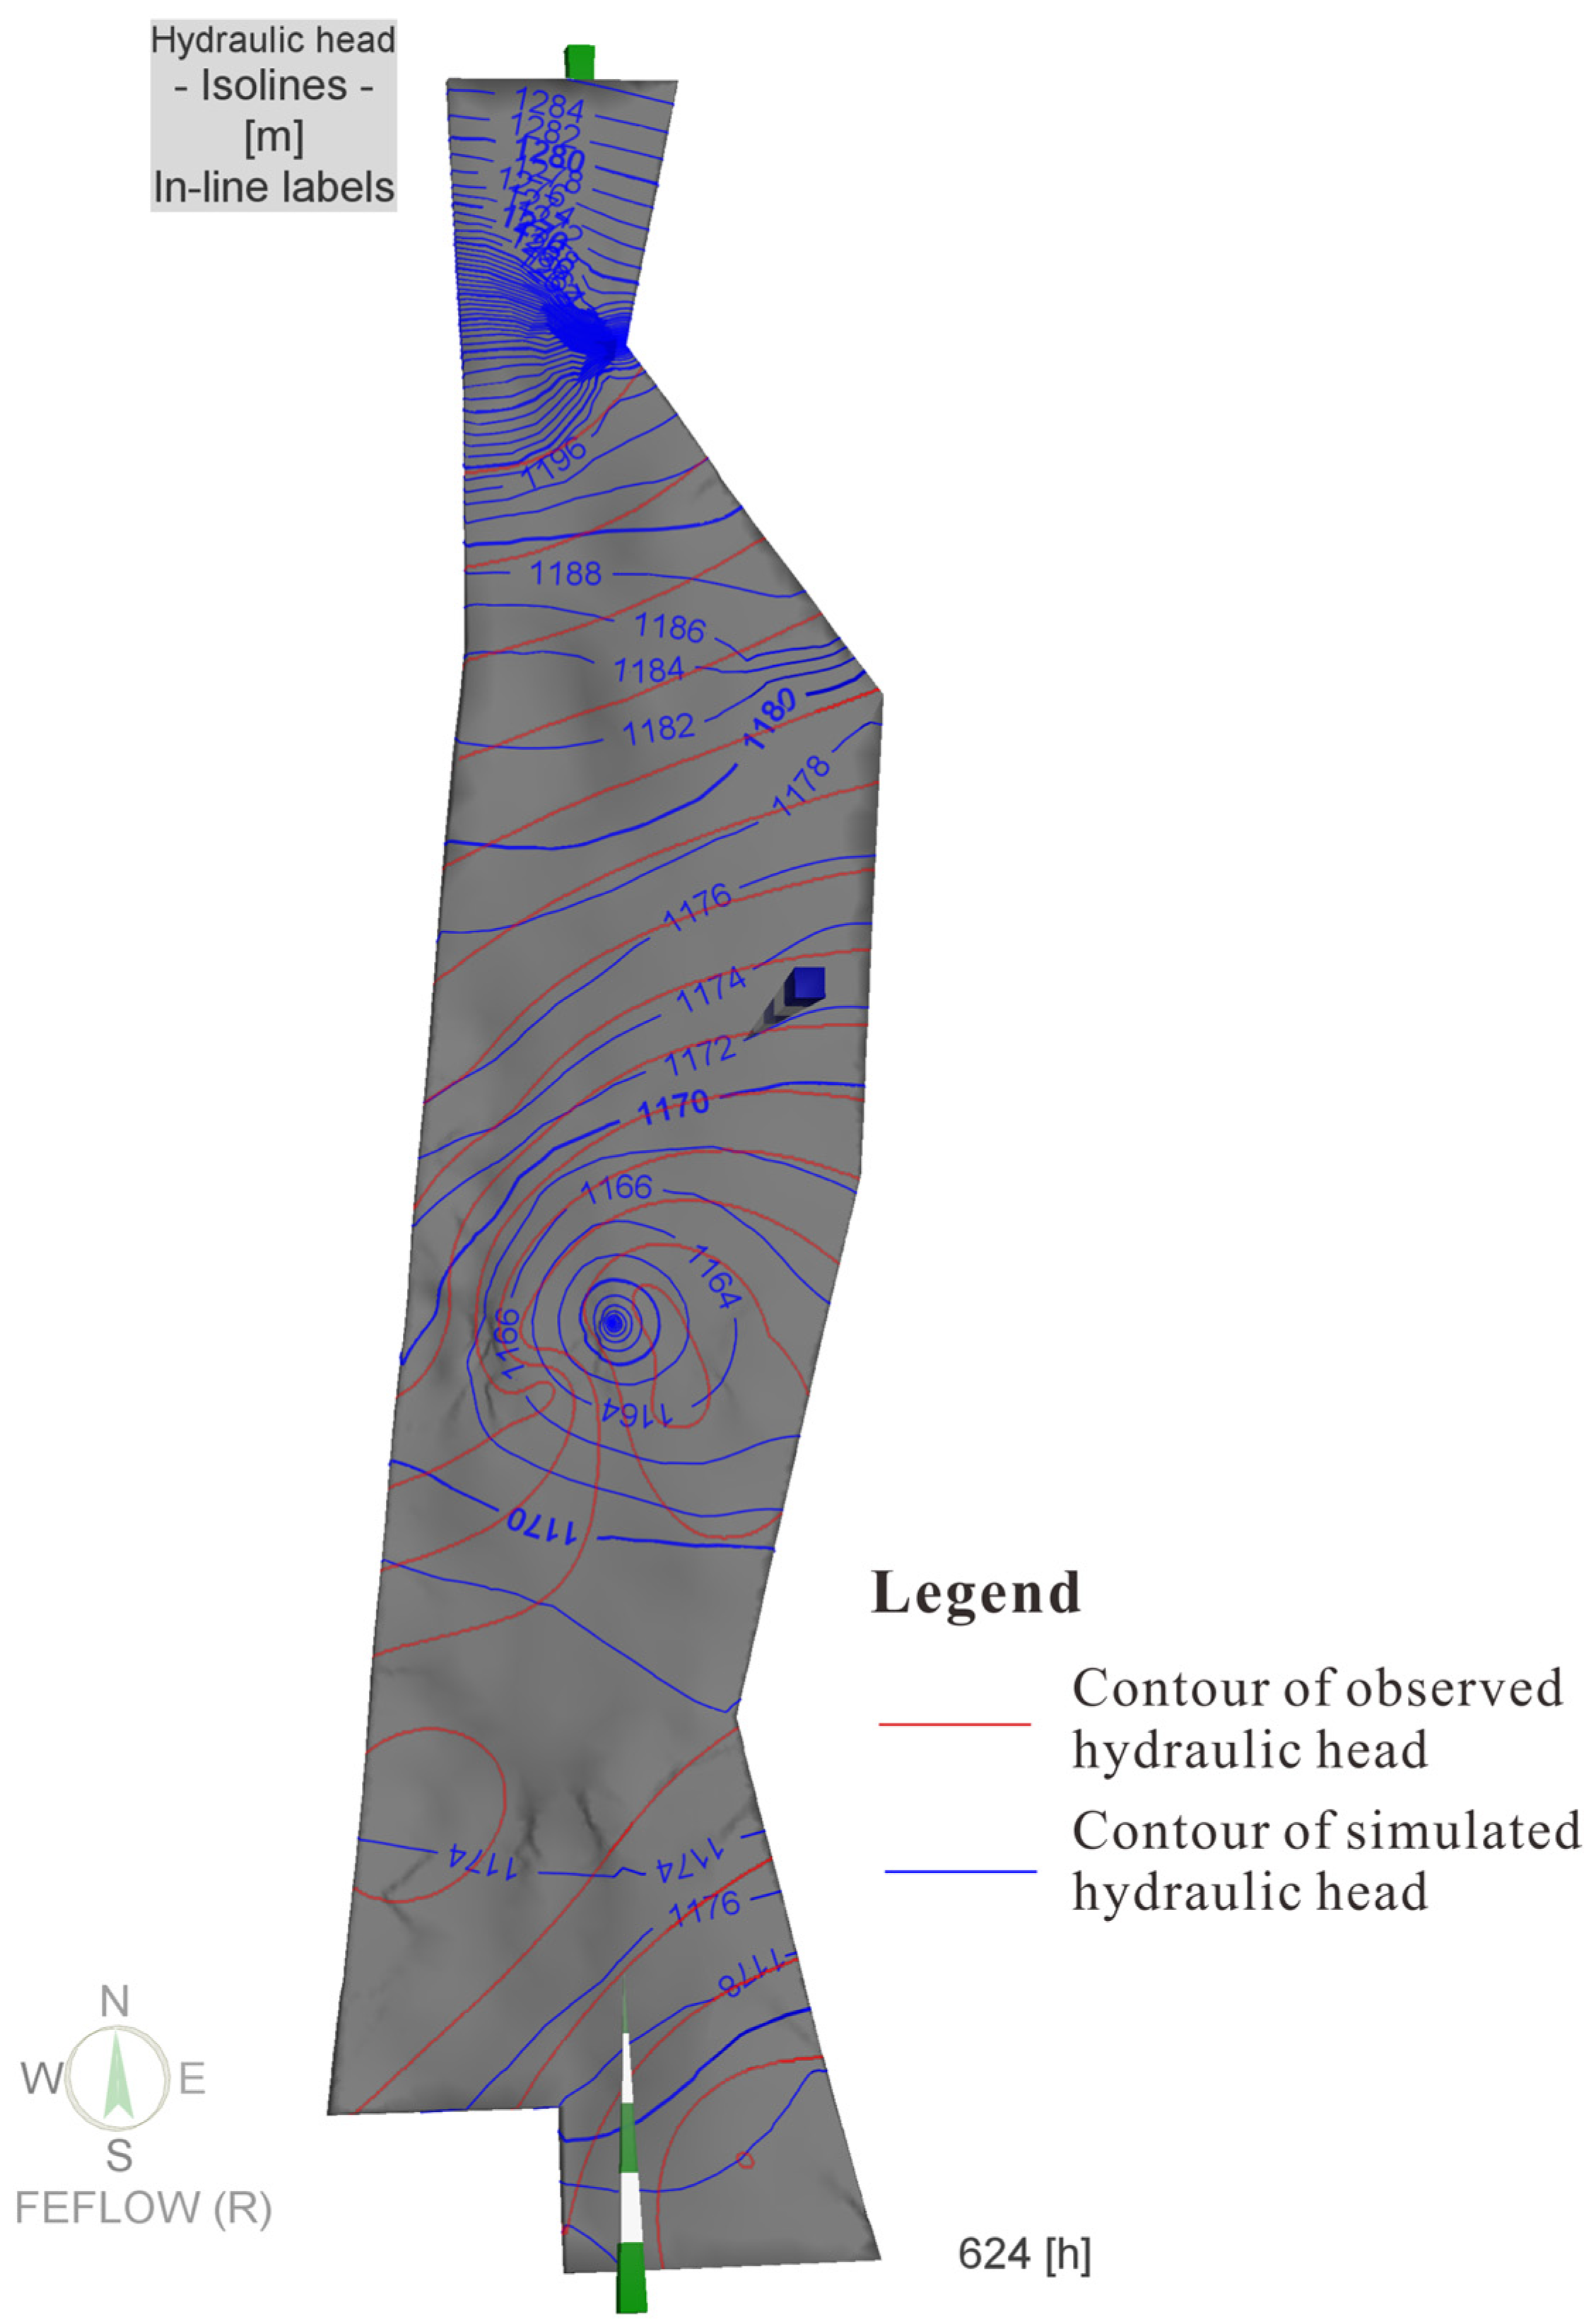
4.2.1. Simulation Model Fitting
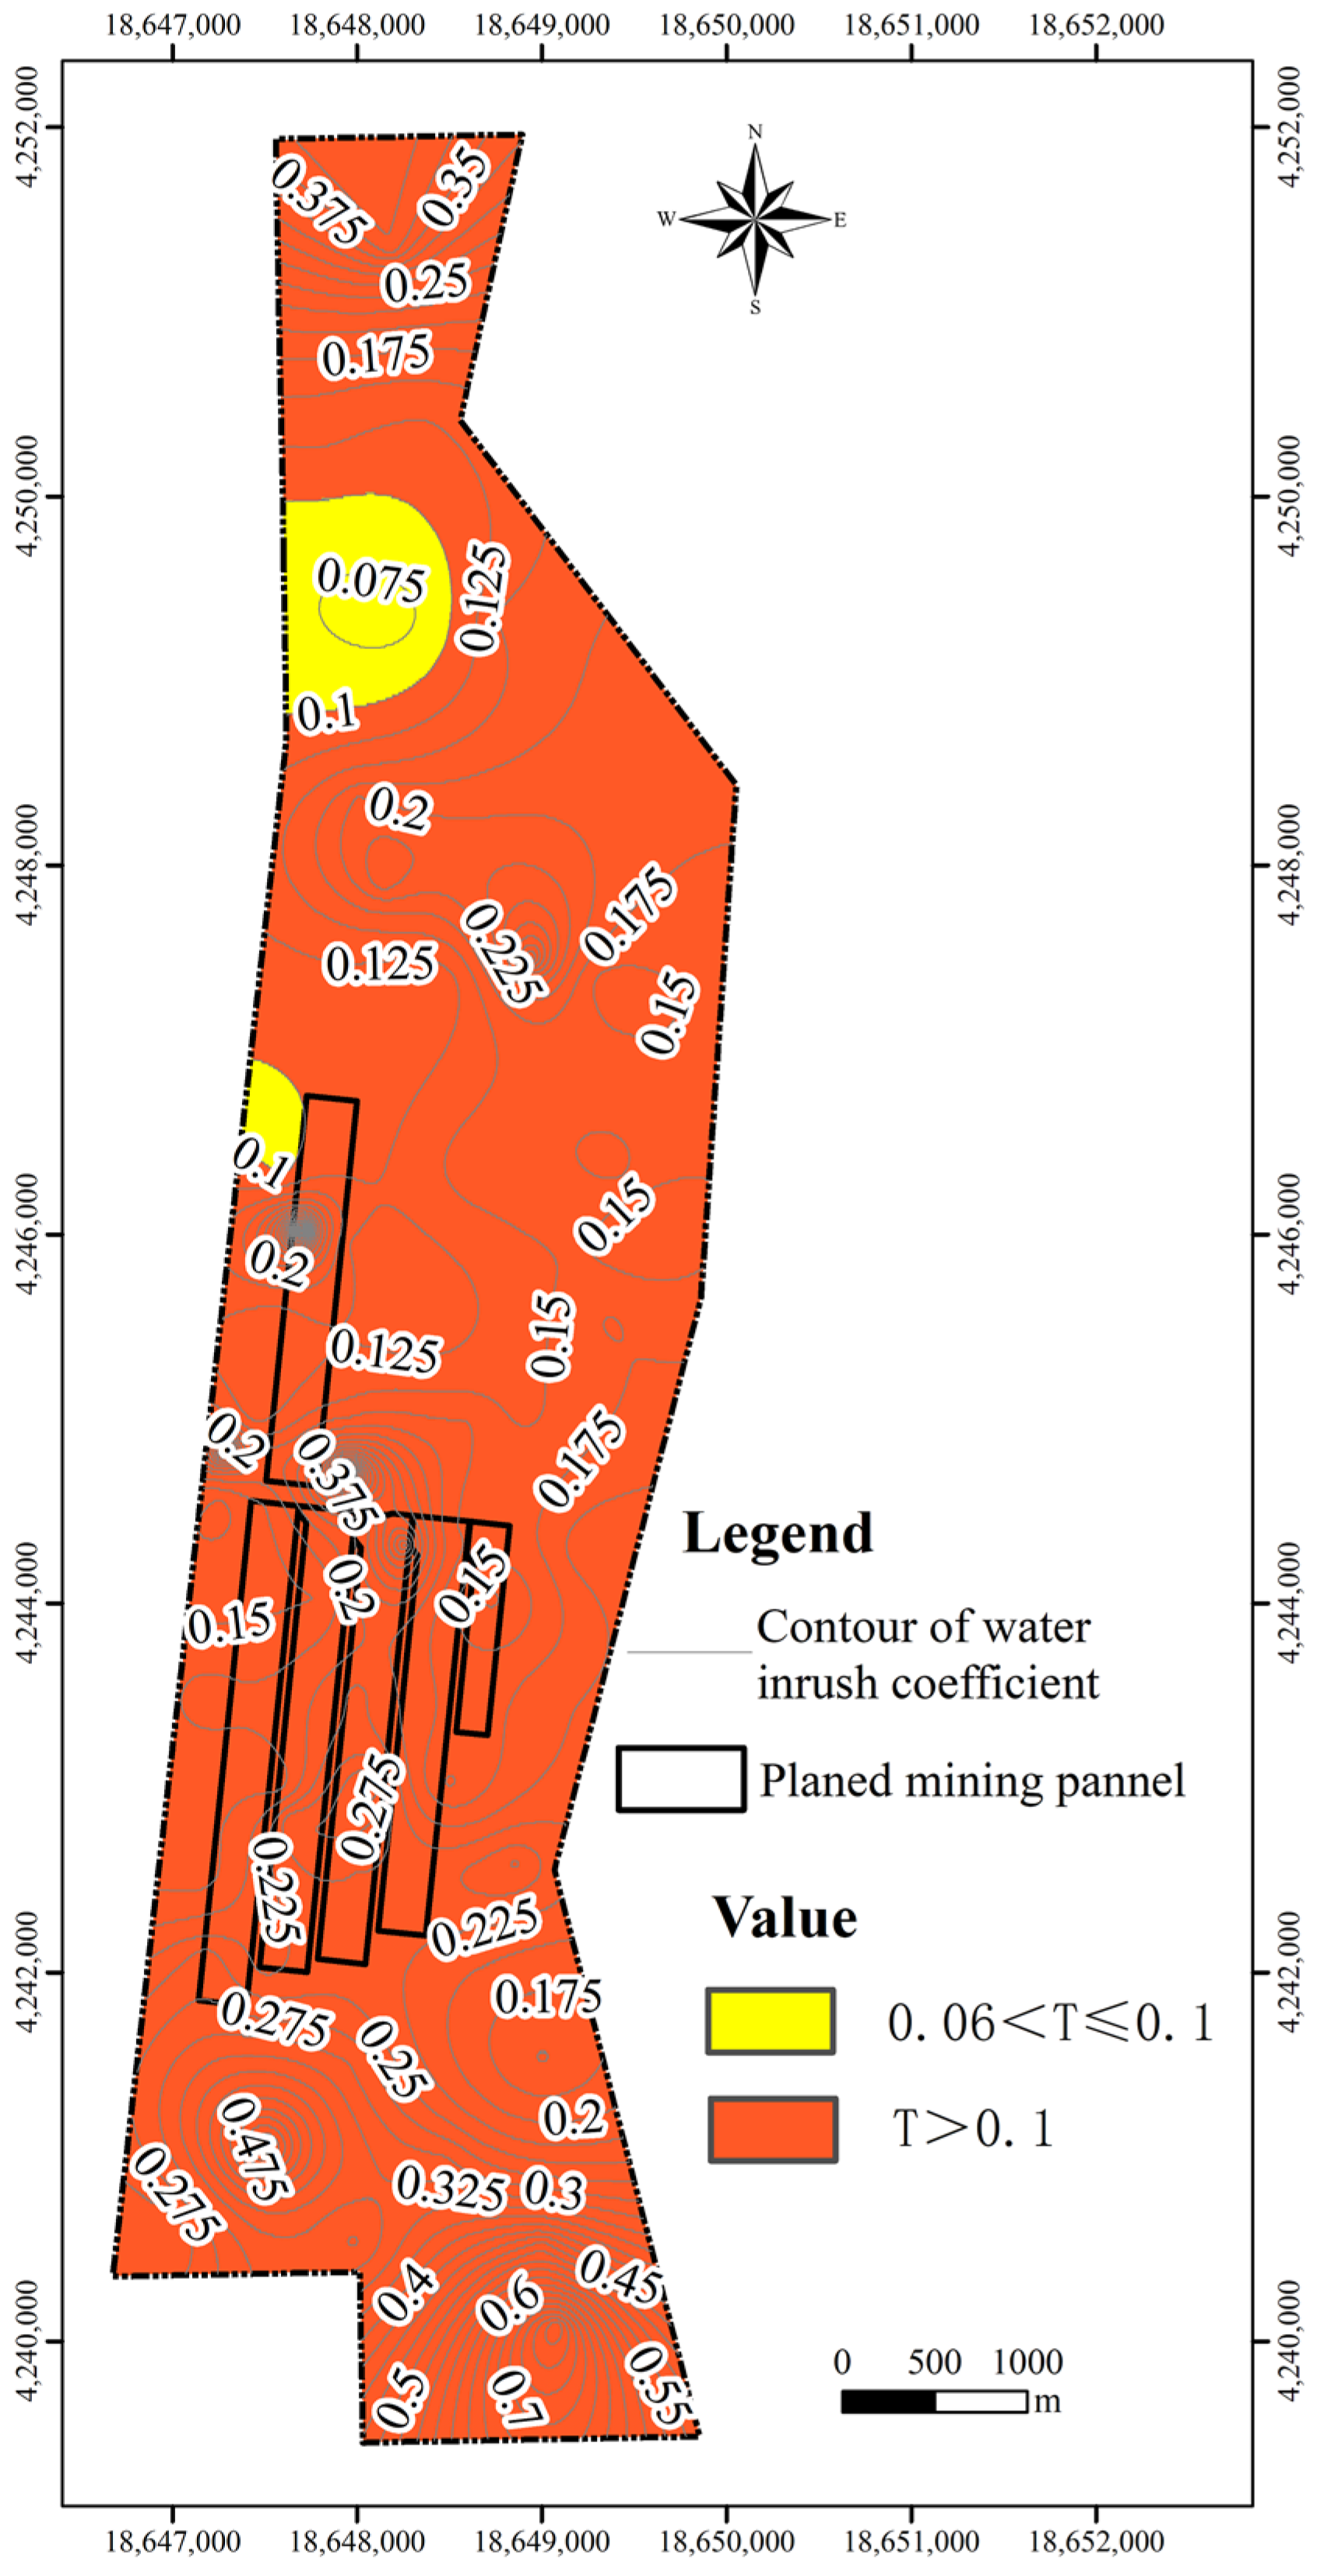
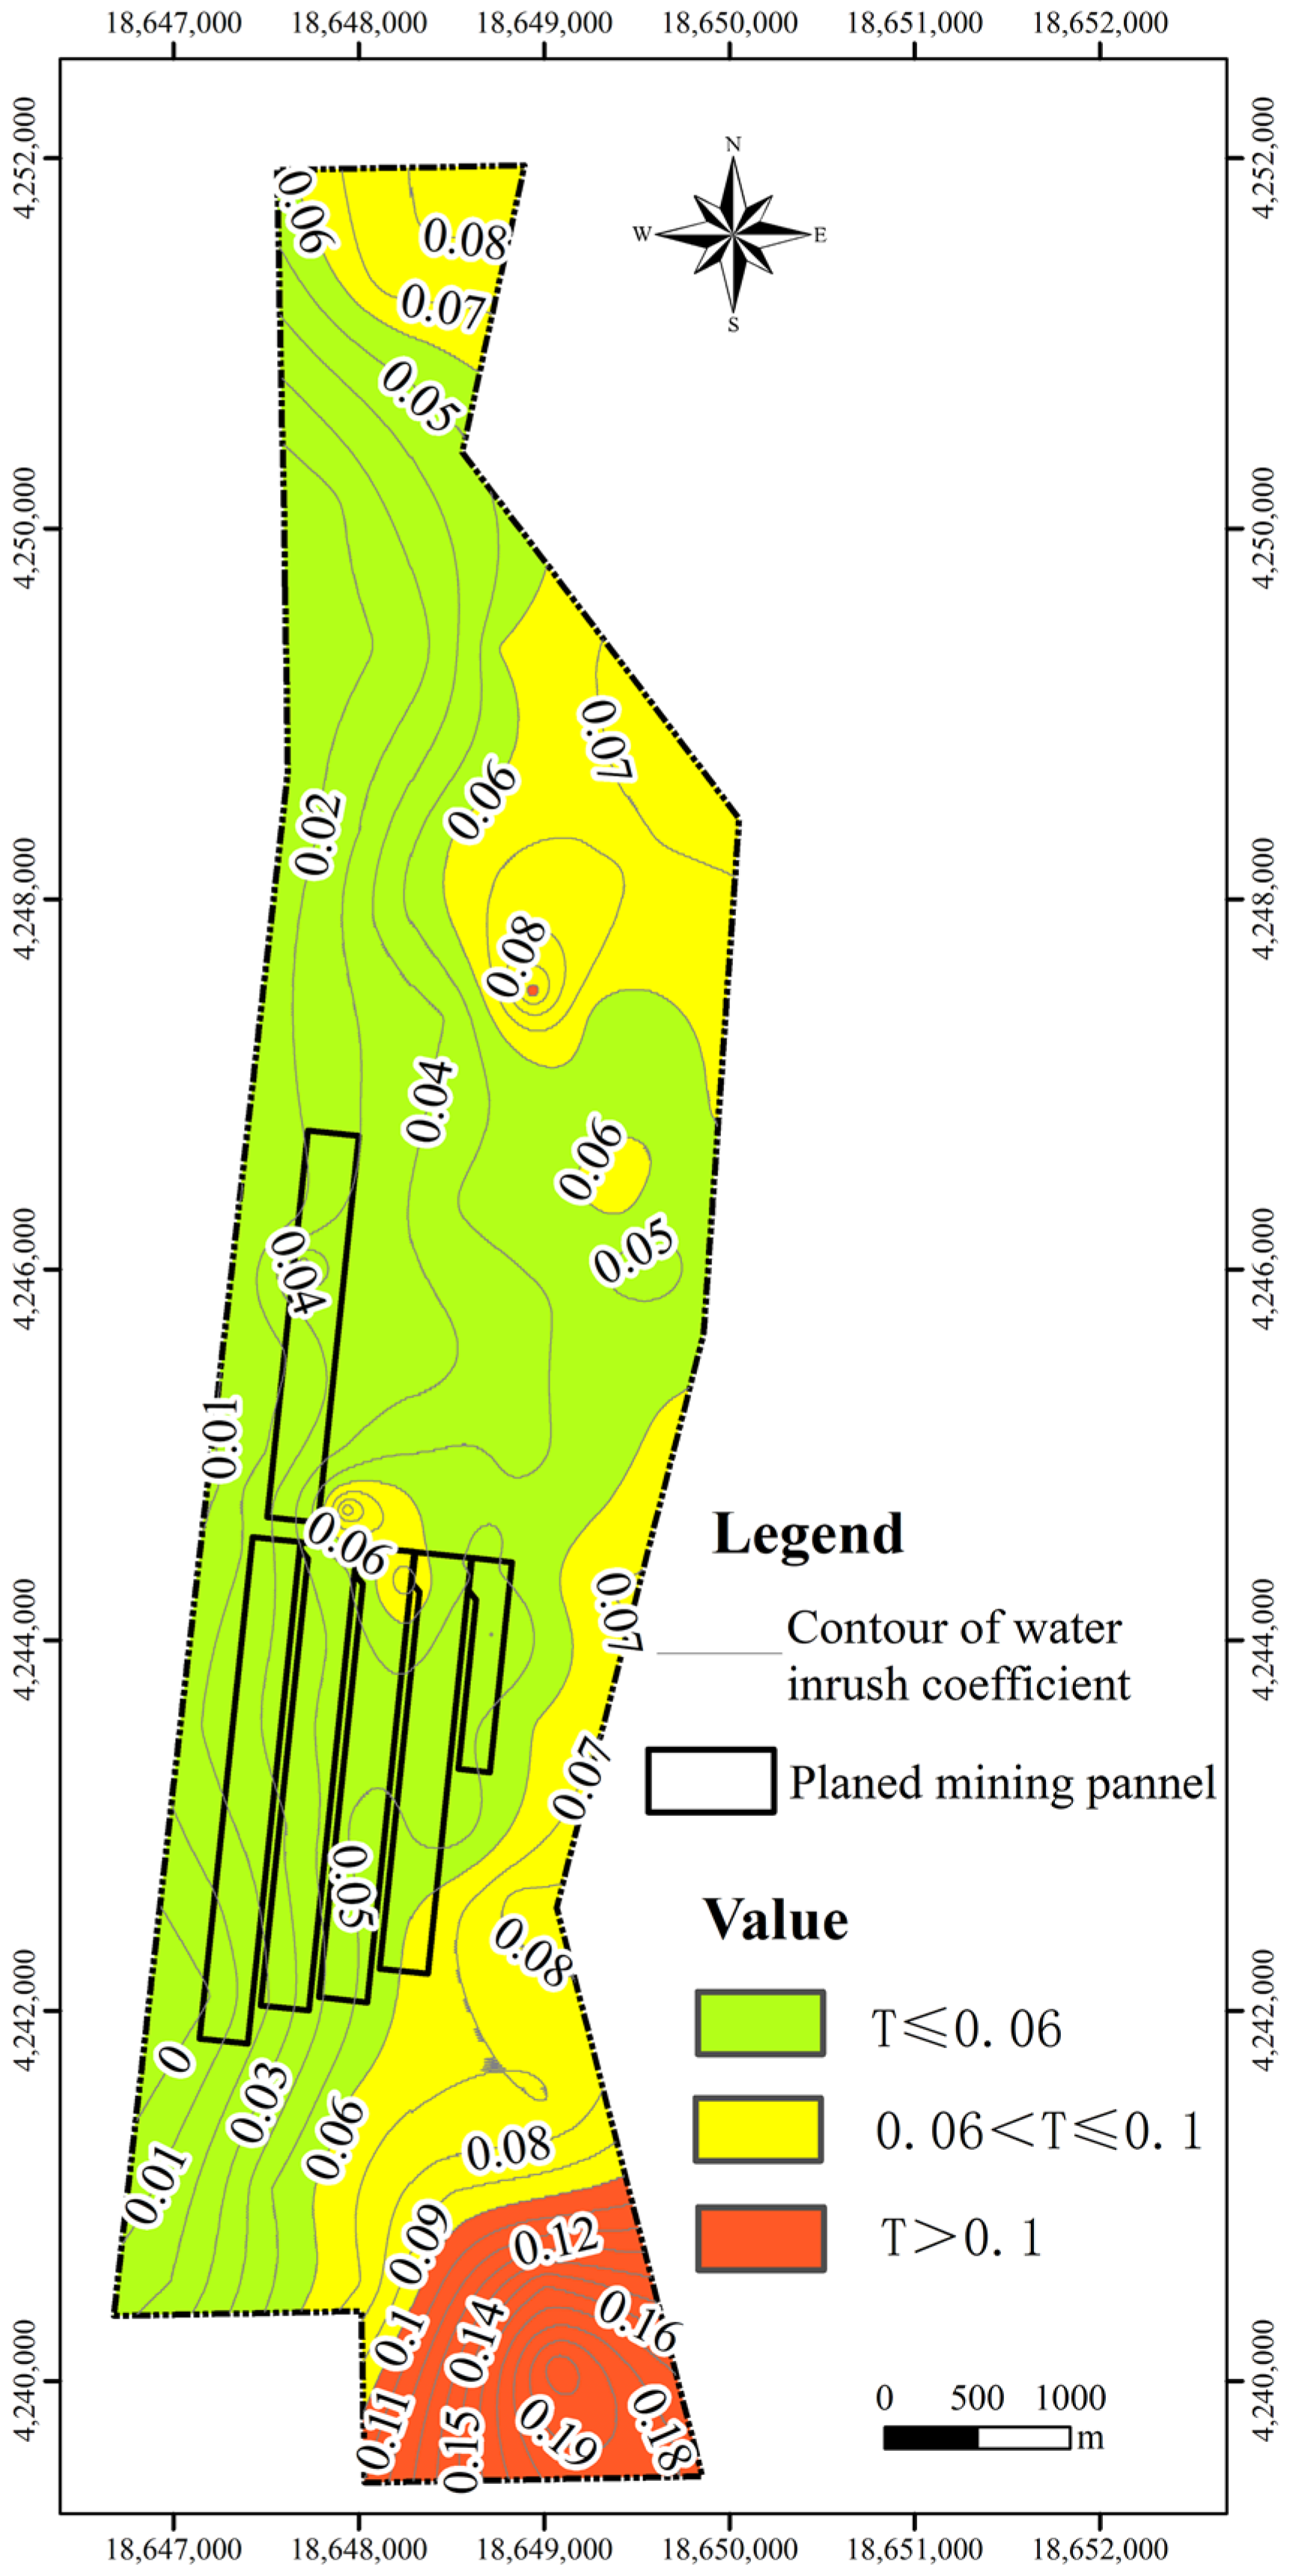
4.2.2. Safe Mining Condition
4.2.3. Scheme of Water Drainage
5. Discussion
6. Conclusions
Author Contributions
Funding
Institutional Review Board Statement
Informed Consent Statement
Data Availability Statement
Conflicts of Interest
References
- Afzal, M.; Battilani, A.; Solimando, D.; Ragab, R. Improving water resources management using different irrigation strategies and water qualities: Field and modelling study. Agr. Water Manag. 2016, 176, 40–54. [Google Scholar] [CrossRef]
- Islam, M.B.; Firoz, A.B.M.; Foglia, L.; Marandi, A.; Khan, A.R.; Schüth, C.; Ribbe, L. A regional groundwater-flow model for sustainable groundwater-resource management in the south Asian megacity of Dhaka, Bangladesh. Hydrogeol. J. 2017, 25, 617–637. [Google Scholar] [CrossRef]
- Kotir, J.H.; Smith, C.; Brown, G.; Marshall, N.; Johnstone, R. A system dynamics simulation model for sustainable water resources management and agricultural development in the Volta River Basin, Ghana. Sci. Total Environ. 2016, 573, 444–457. [Google Scholar] [CrossRef] [PubMed]
- Liu, S.L.; Li, W.P.; Qiao, W.; Wang, Q.Q.; Hu, Y.B.; Wang, Z.K. Effect of natural conditions and mining activities on vegetation variations in arid and semiarid mining regions. Ecol. Indic. 2019, 103, 331–345. [Google Scholar] [CrossRef]
- Zhang, D.S.; Li, W.P.; Lai, X.P.; Fan, G.W.; Liu, W.Q. Development on basic theory of water protection during coal mining in northwest of China. J. China Coal Soc. 2016, 42, 36–43. (In Chinese) [Google Scholar]
- Wang, S.M. Coal Accumulating and Coal Resource Evaluation of Ordos Basin; China Coal Industry Publication House: Beijing, China, 1996. (In Chinese) [Google Scholar]
- Qiao, W.; Li, W.P.; Li, T.; Chang, J.Y.; Wang, Q.Q. Effects of coal mining on shallow water resources in semiarid regions: A case study in the Shennan mining area, Shaanxi, China. Mine Water Environ. 2017, 36, 104–113. [Google Scholar] [CrossRef]
- China National Energy Administration. Available online: http://www.nea.gov.cn (accessed on 6 March 2023).
- Wang, J.H.; Kang, H.P.; Liu, J.Z.; Chen, P.P.; Fan, Z.Z.; Yuan, W.M.; Liu, Y.P. Layout strategic research of green coal resource development in China. J. China Univ. Min. Technol. 2018, 47, 15–20. (In Chinese) [Google Scholar]
- Yuan, L.; Zhang, N.; Kan, J.G.; Wang, Y. The concept, model and reserve forecast of green coal resources in China. J. China Univ. Min. Technol. 2018, 47, 1–8. (In Chinese) [Google Scholar]
- Booth, C.J.; Spande, E.D.; Pattee, C.T.; Miller, J.D.; Bertsch, L.P. Positive and negative impacts of longwall mine subsidence on a sandstone aquifer. Environ. Geol. 1997, 34, 223–233. [Google Scholar] [CrossRef]
- Bruns, D.A. Macroinvertebrate response to land cover, habitat, and water chemistry in a mining-impacted river ecosystem: A GIS watershed analysis. Aquati. Sci. 2005, 67, 403–423. [Google Scholar] [CrossRef]
- Candeias, C.; Ávila, P.F.; Ferreira, S.E.; Paulo, J.T. Integrated approach to assess the environmental impact of mining activities: Estimation of the spatial distribution of soil contamination (Panasqueira mining area, central Portugal). Environ. Monit. Assess. 2015, 187, 135–158. [Google Scholar] [CrossRef] [PubMed]
- Chiew, F.H.S.; Fu, G.B.; Post, D.A.; Zhang, Y.Q.; Wang, B.; Viney, N.R. Impact of coal resource development on streamflow characteristics: Influence of climate variability and climate change. Water 2018, 10, 1161. [Google Scholar] [CrossRef]
- Koch, H.; Kaltofen, M.; Grünewald, U. Scenarios of water resources management in the Lower Lusatian mining district, Germany. Ecol. Eng. 2005, 24, 49–57. [Google Scholar] [CrossRef]
- Raghavendra, N.S.; Deka, P.C. Sustainable development and management of ground water resources in mining affected area: A review. Procedia Earth Planet. Sci. 2015, 11, 598–604. [Google Scholar] [CrossRef]
- Sosa1, M.; Zwarteveen, M. The institutional regulation of the sustainability of water resources within mining contexts: Accountability and plurality. Curr. Opin. Environ. Sustain. 2014, 11, 19–25. [Google Scholar] [CrossRef]
- Yue, H.; Liu, Y. Water balance and influence mechanism analysis: A case study of Hongjiannao Lake, China. Environ. Monit. Assess. 2021, 193, 219–228. [Google Scholar] [CrossRef] [PubMed]
- Guo, Q.L.; Han, Y.Y.; Yang, Y.S.; Fu, G.B.; Li, J.L. Quantifying the Impacts of Climate Change, Coal Mining and Soil and Water Conservation on Streamflow in a Coal Mining Concentrated Watershed on the Loess Plateau, China. Water 2019, 11, 1054. [Google Scholar] [CrossRef]
- Cooper, D.J.; Sanderson, J.S.; Stannard, D.I.; Groeneveld, D.P. Effects of long-term water table drawdown on evapotranspiration and vegetation in an arid region phreatophyte community. J. Hydrol. 2006, 325, 21–34. [Google Scholar] [CrossRef]
- Newman, C.; Agioutantis, Z.; Leon, G. Assessment of potential impacts to surface and subsurface water bodies due to longwall mining. Int. J. Min. Sci. Technol. 2017, 27, 57–64. [Google Scholar] [CrossRef]
- Adhikary, D.P.; Guo, H. Modelling of longwall mining-induced strata permeability change. Rock Mech. Rock Eng. 2015, 48, 345–359. [Google Scholar] [CrossRef]
- Tammetta, P. Estimation of the change in hydraulic conductivity above mined longwall panels. Ground Water 2015, 53, 122–129. [Google Scholar] [CrossRef] [PubMed]
- Booth, C.J. The effects of longwall coal mining on overlying aquifers. Geol. Soc. Spec. Publ. 2002, 198, 17–45. [Google Scholar] [CrossRef]
- Chen, W.C.; Li, W.P.; He, J.H.; Qiao, W.; Wang, Q.Q.; Yang, R.Y. Impact of mining-induced bed separation space on Cretaceous aquifer: A case study of Yingpanhao coal mine, Ordos Basin, China. Hydrogeo. J. 2022, 30, 691–706. [Google Scholar] [CrossRef]
- Fan, K.F.; He, J.H.; Li, W.P.; Chen, W.C. Dynamic evolution and identification of bed separation in overburden during coal mining. Rock Mech. Rock Eng. 2022, 55, 4015–4030. [Google Scholar] [CrossRef]
- Hu, Y.B.; Li, W.P.; Wang, Q.Q.; Liu, S.L.; Wang, Z.K. Evaluation of water inrush risk from coal seam floors with an AHP-EWM algorithm and GIS. Environ. Earth Sci. 2019, 78, 290–305. [Google Scholar] [CrossRef]
- Li, W.P.; Liu, Y.; Qiao, W.; Zhao, C.X.; Yang, D.D.; Guo, Q.C. An improved vulnerability assessment model for floor water bursting from a confined aquifer based on the water inrush coefficient method. Mine Water Environ. 2018, 37, 196–204. [Google Scholar] [CrossRef]
- Wu, Q.; Zhao, D.K.; Wang, Y.; Shen, J.J.; Liu, H.L. Method for assessing coal-floor water-inrush risk based on the variable weight model and unascertained measure theory. Hydrogeol. J. 2017, 25, 2089–2104. [Google Scholar] [CrossRef]
- Singh, R.; Venkatesh, A.S.; Syed, T.H.; Reddy, A.G.S.; Kumar, M.; Kurakalva, R.M. Assessment of potentially toxic trace elements contamination in groundwater resources of the coal mining area of the Korba coalfield, central India. Environ. Earth Sci. 2017, 76, 566–573. [Google Scholar] [CrossRef]
- Wessman, H.; Salmi, O.; Kohl, J.; Kinnunen, P.; Saarivuori, E.; Mroueh, U. Water and society: Mutual challenges for eco-efficient and socially acceptable mining in Finland. J. Clean Prod. 2014, 84, 289–298. [Google Scholar] [CrossRef]
- Zipper, C.E.; Donovan, P.F.; Jones, J.W.; Li, J.; Price, J.E.; Stewart, R.E. Spatial and temporal relationships among watershed mining, water quality, and freshwater mussel status in an eastern USA river. Sci. Total. Environ. 2016, 541, 603–615. [Google Scholar] [CrossRef]
- Howladar, M.F.; Deb, P.K.; Muzemder, A.S.H. Monitoring the underground roadway water quantity and quality for irrigation use around the Barapukuria Coal Mining Industry, Dinajpur, Bangladesh. Groundw. Sustain Dev. 2017, 4, 23–34. [Google Scholar] [CrossRef]
- Guo, W.; Li, P.; Du, Q.; Zhou, Y.; Xu, D.; Zhang, Z. Hydrogeochemical Processes Regulating the Groundwater Geochemistry and Human Health Risk of Groundwater in the Rural Areas of the Wei River Basin, China. Expo. Health 2023, 4, 1–16. [Google Scholar] [CrossRef]
- Yang, Y.; Li, P.; Elumalai, V.; Ning, J.; Xu, F.; Mu, D. Groundwater Quality Assessment Using EWQI With Updated Water Quality Classification Criteria: A Case Study in and Around Zhouzhi County, Guanzhong Basin (China). Expo. Health 2022, 8, 1–16. [Google Scholar] [CrossRef]
- Sun, W.; Zhou, W.; Jiao, J. Hydrogeological classification and water inrush accidents in China’s coal mines. Mine Water Environ. 2016, 35, 214–220. [Google Scholar] [CrossRef]
- Yin, S.X.; Zhang, J.; Liu, D. A study of mine water inrushes by measurements of in situ stress and rock failures. Nat. Hazards. 2015, 79, 1961–1979. [Google Scholar] [CrossRef]
- Chen, W.C.; Li, W.P.; Qiao, W.; Li, L.F. Beneficial Use of Deep Ordovician Limestone Water from Mine Safety Dewatering at the Xinglongzhuang Coal Mine, North China. Mine Water Environ. 2020, 39, 42–56. [Google Scholar] [CrossRef]
- Zhao, B.F.; Lv, Y.G. Research on characteristics and prevention and control technology of sandstone water disaster in coal seam floor in Jurassic coalfield. China Coal. 2021, 47, 56–63. (In Chinese) [Google Scholar]


| Borehole | Aquifer Thickness (m) | Water Level (m) | Permeability (m/d) | Unit Inflow (L/(s·m)) |
|---|---|---|---|---|
| B-2 | 62.10 | 1200.03 | 0.3299 | 0.2048 |
| B-4 | 127.10 | 1195.83 | 0.1057 | 0.1233 |
| B-6 | 79.70 | 1183.862 | 0.4839 | 0.4669 |
| B-7 | 53.50 | 1180.87 | 2.0247 | 0.9483 |
| B-8 | 53.55 | 1187.241 | 1.7726 | 0.6783 |
| B-12 | 56.85 | 1185.63 | 1.9688 | 1.0026 |
| B-14 | 14.21 | 1184.609 | 0.288 | 0.0372 |
| B37 | 56.35 | 1233.792 | 0.2541 | 0.1803 |
| B44 | 81.00 | 1198.322 | 1.4290 | 1.5380 |
| B45 | 58.98 | 1193.871 | 2.0603 | 0.9978 |
| B47 | 42.18 | 1171.521 | 1.0955 | 0.4553 |
| Zone | Kx (m/d) | Ky (m/d) | Kz (m/d) | Ss (1/m) |
|---|---|---|---|---|
| Zone 1 | 1.25 | 1.25 | 0.12 | 2.1 × 10⁻⁷ |
| Zone 2 | 2.3 | 2.3 | 0.23 | 3.7 × 10⁻⁷ |
| Zone 3 | 0.67 | 0.67 | 0.06 | 1.5 × 10⁻⁷ |
| Zone 4 | 3.4 | 3.4 | 0.34 | 1.3 × 10⁻⁶ |
| Zone 5 | 2.9 | 2.9 | 0.29 | 7.8 × 10⁻⁶ |
| Zone 6 | 1.05 | 1.05 | 0.1 | 2.7 × 10⁻⁷ |
| Stage | Draining Amount (m3/d) | Time (d) | Static Storage (m3/d) | Boundary Recharge (m3/d) |
|---|---|---|---|---|
| First stage | 26,000 | 73 | 2991 (11.5%) | 23,009 (88.5%) |
| Second stage | 20,000 | 50 | 1822 (9.12%) | 18,177 (90.88%) |
| Third stage | 12,000 | 118 | 495 (4.12) | 11,505 (95.88%) |
| Total | 431.4 × 10⁴ m3 | 241 | 36.76 × 10⁴ m3 | 394.61 × 10⁴ m3 |
| Grouting Effect of Fault (m/d) | Stage 1 (d) | Stage 2 (d) | Stage 3 (d) | Discharge Water (×104 m3) | Static Reserves of Model (×104 m3) | Boundary Supply (×104 m3) |
|---|---|---|---|---|---|---|
| No grouting | 73 | 50 | 118 | 431.4 | 36.76 | 394.61 |
| 2 × 10⁻² | 70 | 44 | 110 | 402 | 38.53 | 363.47 |
| 2 × 10⁻⁴ | 68 | 41 | 106 | 386 | 41.32 | 344.68 |
| 2 × 10⁻⁶ | 63 | 35 | 97 | 350.2 | 45.19 | 305.01 |
| 2 × 10⁻⁸ | 63 | 35 | 95 | 347.8 | 45.57 | 302.23 |
Disclaimer/Publisher’s Note: The statements, opinions and data contained in all publications are solely those of the individual author(s) and contributor(s) and not of MDPI and/or the editor(s). MDPI and/or the editor(s) disclaim responsibility for any injury to people or property resulting from any ideas, methods, instructions or products referred to in the content. |
© 2023 by the authors. Licensee MDPI, Basel, Switzerland. This article is an open access article distributed under the terms and conditions of the Creative Commons Attribution (CC BY) license (https://creativecommons.org/licenses/by/4.0/).
Share and Cite
Lyv, Y.; Qiao, W.; Chen, W.; Cheng, X.; Liu, M.; Liu, Y. Quantifying the Impact of Coal Mining on Underground Water in Arid and Semi-Arid Area: A Case Study of the New Shanghai No. 1 Coal Mine, Ordos Basin, China. Water 2023, 15, 1765. https://doi.org/10.3390/w15091765
Lyv Y, Qiao W, Chen W, Cheng X, Liu M, Liu Y. Quantifying the Impact of Coal Mining on Underground Water in Arid and Semi-Arid Area: A Case Study of the New Shanghai No. 1 Coal Mine, Ordos Basin, China. Water. 2023; 15(9):1765. https://doi.org/10.3390/w15091765
Chicago/Turabian StyleLyv, Yuguang, Wei Qiao, Weichi Chen, Xianggang Cheng, Mengnan Liu, and Yingjie Liu. 2023. "Quantifying the Impact of Coal Mining on Underground Water in Arid and Semi-Arid Area: A Case Study of the New Shanghai No. 1 Coal Mine, Ordos Basin, China" Water 15, no. 9: 1765. https://doi.org/10.3390/w15091765