Article

Assessment and Management of the Water Quality and Heavy-Metal Pollution of a Protected Hypersaline Wetland in the United Arab Emirates

1
Department of Biology, Chemistry and Environmental Sciences, American University of Sharjah, Sharjah P.O. Box 26666, United Arab Emirates
2
Hefaiyah Mountain Conservation Centre (Scientific Research Department), Environment and Protected Areas Authority, Sharjah, United Arab Emirates
3
Sharjah Desert Park (Scientific Research Department), Environment and Protected Areas Authority, Sharjah P.O. Box 26666, United Arab Emirates
4
Wasit Wetland Center (Scientific Research Department), Environment and Protected Areas Authority, Sharjah P.O. Box 26666, United Arab Emirates
5
Materials Science and Engineering Program, College of Arts and Sciences, American University of Sharjah, Sharjah, P.O. Box 26666, United Arab Emirates
6
Engineering Systems Management Program, College of Engineering, American University of Sharjah, Sharjah P.O. Box 26666, United Arab Emirates
*
Author to whom correspondence should be addressed.
Water 2023, 15(9), 1766; https://doi.org/10.3390/w15091766
Submission received: 19 March 2023 / Revised: 24 April 2023 / Accepted: 26 April 2023 / Published: 4 May 2023
(This article belongs to the Special Issue Wetland Processes, Monitoring and Modeling for Design and Management)

Abstract

:
A hypersaline protected wetland in the UAE was assessed from February to April of 2021 for parameters such as temperature, pH, COD, total dissolved solids, ORP, electrical conductivity, total and E. coli, salinity, turbidity, chloride, ammonia, nitrate, total nitrogen, phosphorus, and heavy metals to assess its current status. Wasit Nature Reserve’s salinity values ranged between 17.1 and 64.78 psu, while D.O values ranged between 6.3 and 8.41 ppm. The values for nitrate were between 50.70 and 57.6 ppm, while the values for chloride were between 12,642.0 and 37,244.0 ppm. Results for heavy metals showed that Iron and Aluminum were the highest concentrations in sediments, with an average of 5599.3 mg/kg and 3171.1 mg/kg, respectively. Mercury and arsenic reported the lowest concentrations, with an average of 0.0 mg/kg and 2.4 mg/kg, respectively. Hazard quotient values were 2239.72 mg/kg for iron, 0 mg/kg for mercury, and 0.05 mg/kg for arsenic, indicating that iron levels are considered hazardous and water-quality indicators concluded high pollution levels. The results indicate that the hypersaline nature of the wetland contributes to the deviation from the permissible limits, as demonstrated by the calculated “poor“water-quality index and “highly polluted” water-pollution index. Due to their ecological relevance, wetlands in the region could serve as indicators of ecological well-being, highlighting the need for regular monitoring and evaluation.

1. Introduction

Wetlands are extremely dynamic ecosystems that cover about 7% of the Earth’s surface and can exist as natural, artificial, stagnant, flowing, brackish or even salty depending on their geomorphic setting, water source, and hydrodynamics [1]. A wetland is an area of land saturated with water standing above a soil surface [2]. At low tide, a typical wetland consists of marshes, streams, or swamps with a depth of less than six meters [3]. Due to regional and local variations in soils, topography, climate, hydrology, water chemistry, vegetation, and human disturbance, wetlands vary significantly from one location to another [4]. The amount of water in a wetland varies from permanently flooded to seasonally flooded, but wetlands still hold saturated soils for most of the time when not flooded [5]. The water level variation in wetlands enables increased species richness by through variation of niches. Wetland habitats are among the planet’s most active natural areas, supporting more life than many tropical forests [3]. In arid regions, wetlands are particularly significant for the survival of vertebrate and invertebrate species, where resident and migratory birds provide a conspicuous reference of the accessibility of feeding and breeding resources of these habitats [3,6,7]. Migratory birds require high amounts of energy and a safe environment to travel, forage and reproduce. In locations with greater resource abundance this may allow for wider ranging options; however, harsh arid regions, they depend on wetlands to survive. Wetlands play an integral role in maintaining dynamic ecological equilibrium by regulating water regimes and providing essential sources of food, raw materials, medicine, energy, and a variety of other valuable qualities for humans and other organisms, making them beneficial for economics, science, culture, and leisure [8,9,10].
In the context of global climate change, wetlands defend coastal ecosystems against the acute impacts of rising sea levels and extreme weather conditions [11]. Additionally, they play a critical role in flood regulation, erosion control, coastline protection, and water purification and act as shields that absorb pollutants and reduce the severity of sudden environmental hazards [10,12]. Hence, wetland protection from degradation is ecologically critical. Unfortunately, the world’s most economically valuable ecosystems and essential climate regulators are disappearing at an accelerating rate of reportedly three times faster than tropical and temperate rainforests [9,13]. Moreover, nearly 50% of the world’s wetlands have already been lost and degraded or are currently threatened by unsustainable human activities that result in contamination, soil erosion, or landscape transformation [14,15]. Megatrends such as climate change, population growth, urbanization, and overconsumption of resources have all contributed to these irreversible losses worldwide [16]. Effectively managing the limited water resources and quality is the basis for the protection and conservation of wetlands [17]. For the past century, humans have characterized wetland ecosystems as carriers of disease and sources of death due to water contamination and poor sanitation, which are directly linked to transmission of diseases that lead to severe health effects and for approximately 3.1% of annual deaths globally [18,19]. Hepatitis, Typhoid, and Giardiasis are only some of the most common diseases carried and transmitted by the contamination of water [20]. In terms of pollution, water can carry and dissolve materials easily due to its chemical properties. Inland wetlands are close to urban areas, making them prone to pollution from industrial run-off and toxins leaching from septic systems, landfills, and many other industrial and domestic activities [21,22].
In the United Arab Emirates (UAE), Sharjah’s Wasit Nature Reserve is one of the more ecologically diverse conservation sites. Surrounded by residential and industrial areas, the protected seasonally hypersaline habitat is home to many permanent and migratory bird species small mammals, reptiles, and insects. The Wasit Nature Reserve is a protected area for both captive and wild birds, including wading bird species, such as the Black-winged Stilt (Himantopus himantopus), Kentish Plover (Charadrius alexandrines) and the Greater Flamingo (Phoenicopterus roseus) [23,24,25]. Wetlands in the region are at risk from increasing temperatures, humidity, rising sea levels, construction-related dewatering and land reclamation [26]. Additionally, surface water quality is under constant pressure from both natural processes and anthropogenic influences [15]. Despite the importance of the UAE wetlands for both environmental and economic reasons, their current ecological status remains uncertain due to the lack of reported studies. A previous study reported on the status of surface water in wetlands in the, UAE discussing the levels of nitrate, phosphate, and total organic carbon in the Al Wathba Wetland Reserve in Abu Dhabi, UAE [27]. Moreover, due to the underground flows of water from residential areas predominantly using septic systems, Samara et al. (2016) investigated the water quality of the Wasit Nature Reserve in Sharjah, UAE, and their study showed groundwater with minimal fecal contamination, while surface water had fecal contamination [28]. The climate of a region affects the structure of saline wetlands and other water lakes due to the interaction between the atmosphere and the water. Specifically, it is reported that the variability of abiotic factors in hypersaline lakes adds extreme conditions for organisms, making them unique habitats [29]. Water-quality monitoring in hypersaline wetlands is challenging due to the lack of standardized methods to assess potential risk risks due to metals and other anthropogenic stressors [30]. To assess the current status of such ecosystems it is imperative to understantheir natural patterns through daily and seasonal changes and changes in temperature [31]. Hence, attention should be given towards establishing databases and baseline data to understand future changes in water quality and other factors that will enable management decision-making [32]. Water-quality monitoring in the United Arab Emirates is particularly important in urban areas where contamination is anticipated from many sources. Domestic and industrial waste contamination must be taken into consideration to analyze the water quality and its constituents in a specific aquatic ecosystem. The hypersaline nature, remediated landfill history [23,24], and now urbanized location of Wasit Nature Reserve make it an especially important wetland.
This paper aims to assess the current environmental status of the Wasit Nature Reserve by monitoring the water quality, sediments, heavy-metal pollution, and historical changes. The results highlighted the importance of monitoring protected areas and raising awareness among governments and the general public about the significance of wetland ecosystem conservation in the United Arab Emirates.

2. Materials and Methods
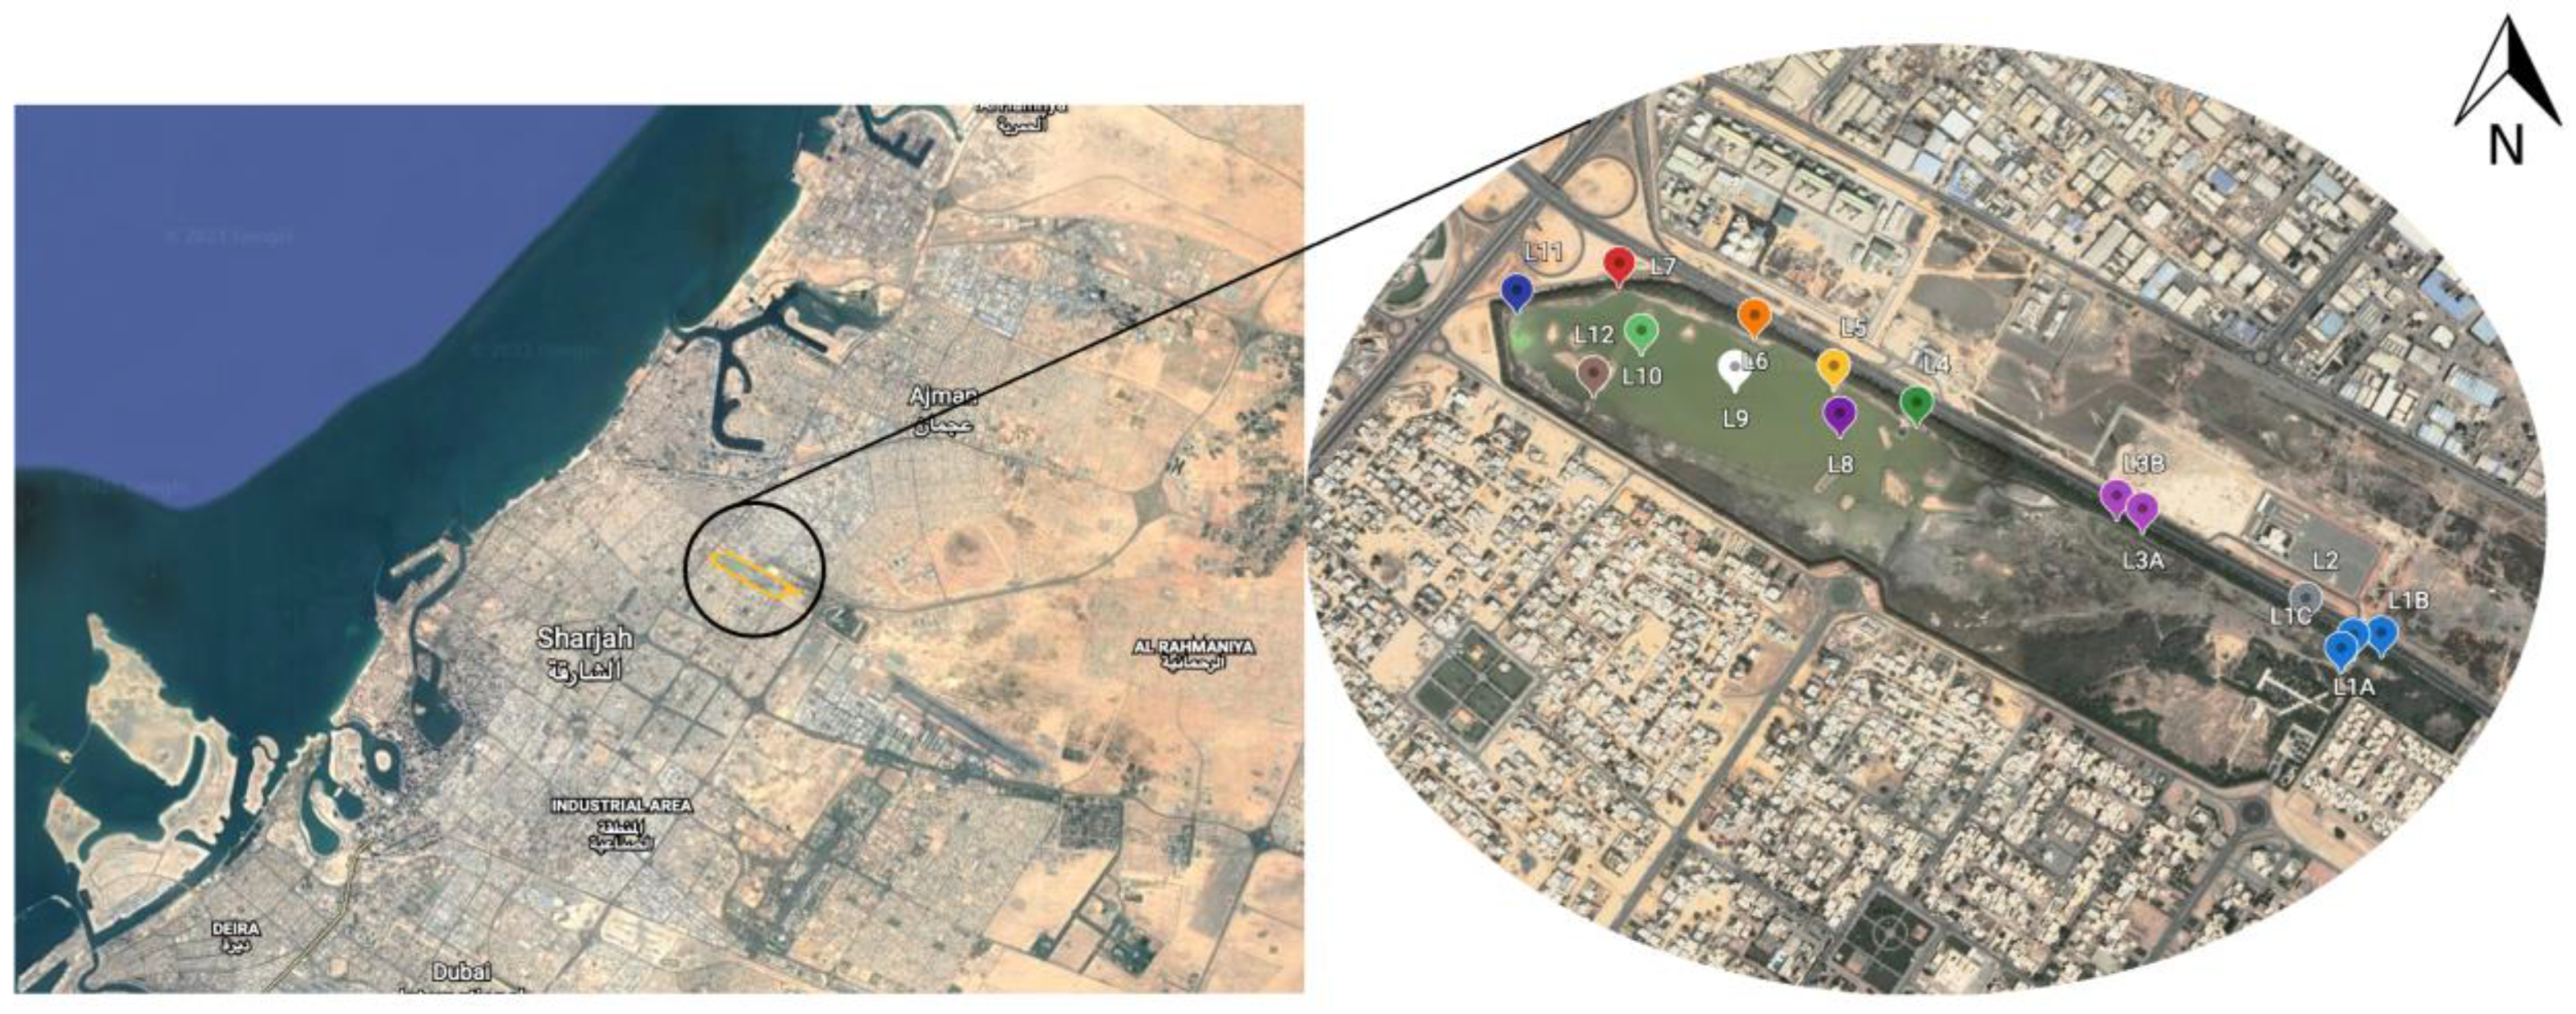
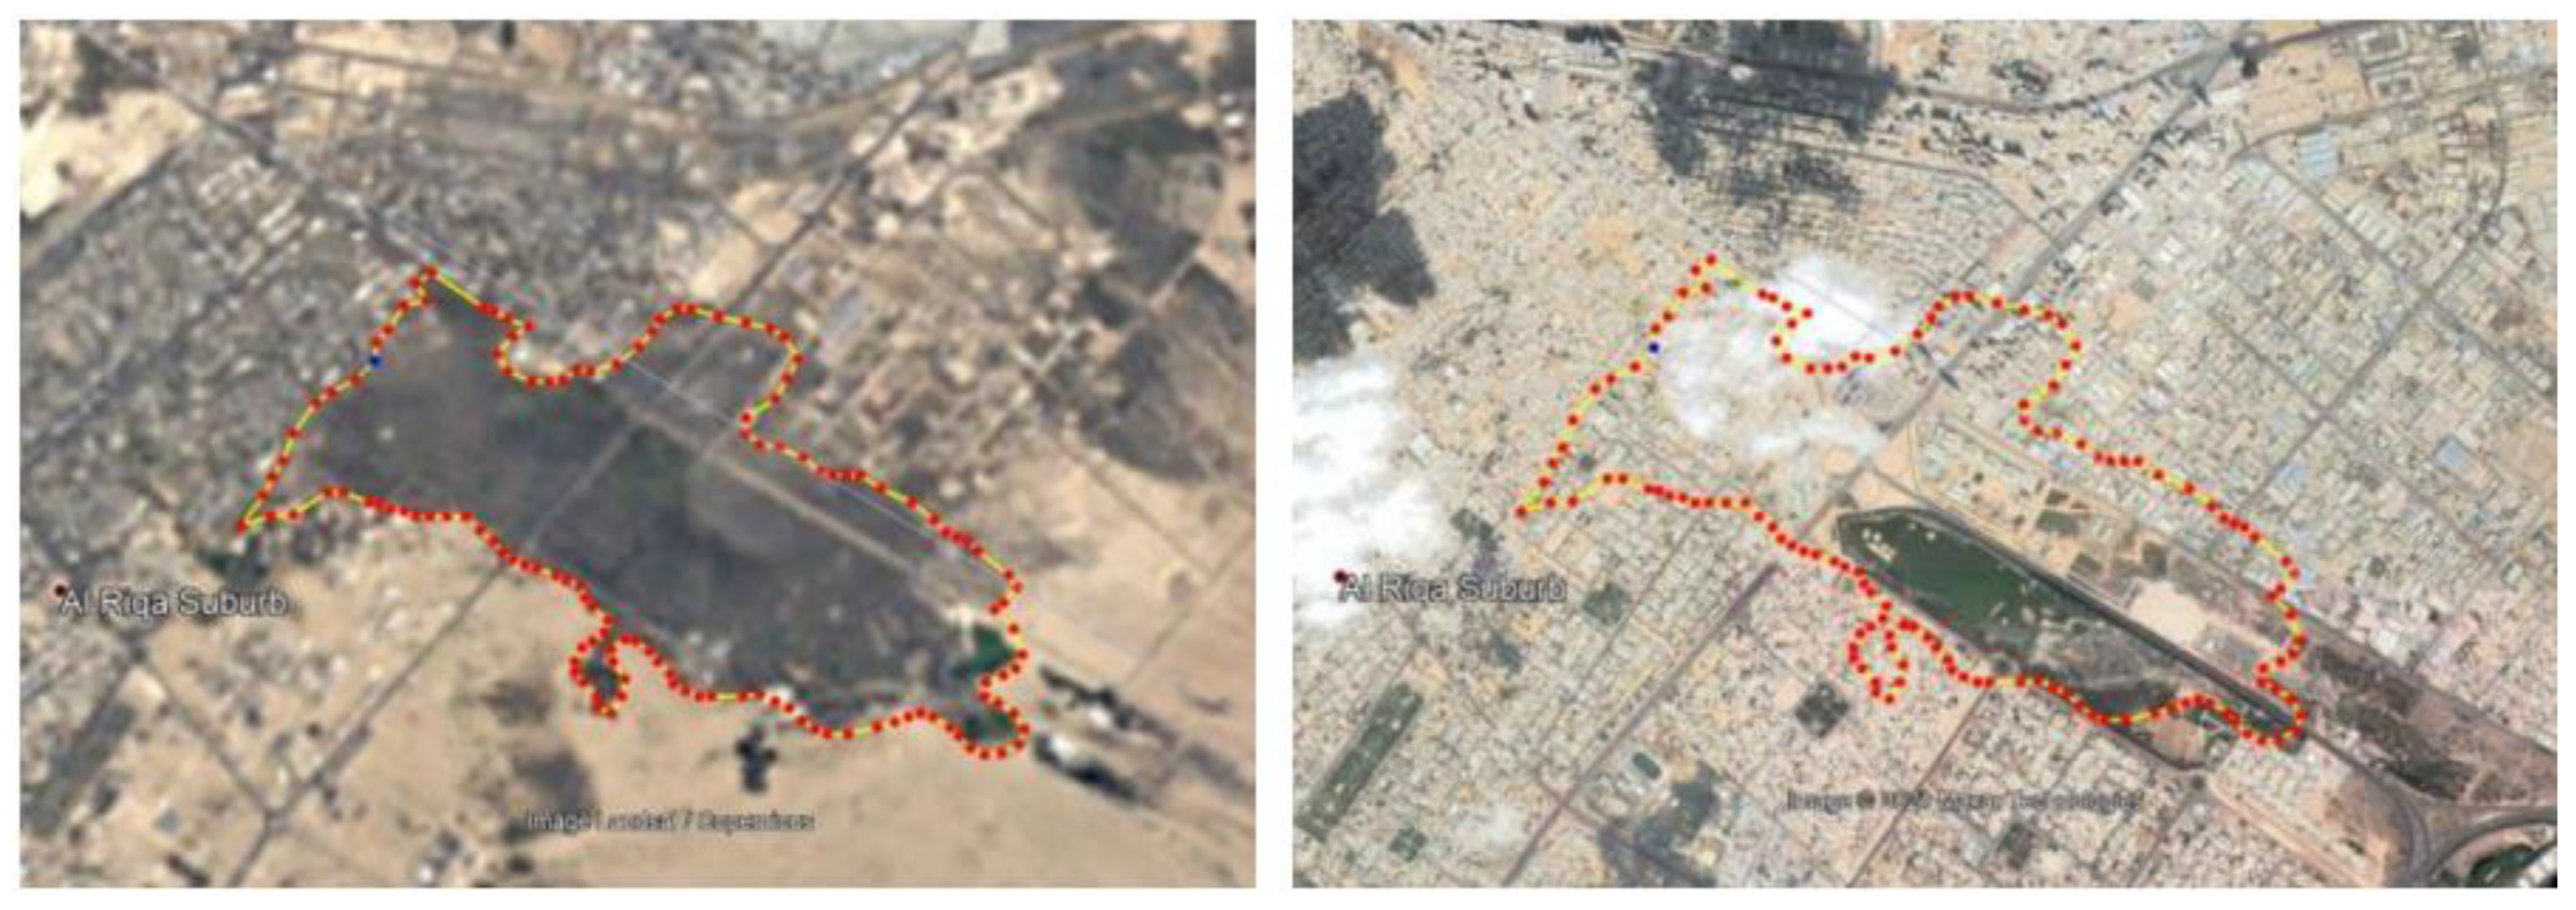
2.1. Site of Study

The Wasit Nature Reserve (Wasit) is an ecologically diverse conservation site in the United Arab Emirates, covering an area of approximately 2.22 km × 0.48 km located in the northern Sharjah suburb, UAE [33] (Figure 1). The reserve is a protected area for both captive and wild birds, estimated to cover 86 hectares (210 acres) of protected habitat and includes approximately 198 different bird species, small mammals, reptiles, and insects. Previously, the site was used as a dump site for municipal and industrial wastes before its rehabilitation in the late 1990s. At that point, it was known as Al Ramtha Lagoon, which was categorized as a saltmarsh (sabkha), leading to the occurrence of a hyper-saline wetland due to a combination of reasons, including the rainy season in the winter months with a maximum of 8.5 mm per rainfall and between 80 and 100 mm, annually; high temperatures leading to high evaporation rates; and inflow of water into the area being limited to underground flows [23,24]. The wetland is currently managed by the Environment and Protected Areas Authority of Sharjah Government [34]. The Wasit wetlands consist of a series of interconnected pools through above and below ground water flows, with groundwater flowing from outside residential and industrial areas to a small shallow upper pond at the eastern side of the reserve through a series of above- and below-ground flows between vegetated areas through middle ponds to one big pond divided partway through with a berm [23,24]. More recently, an outflow infrastructure was placed towards the western shore of the large pond to minimize flooding. In the management of the Nature Reserve, water was shown to be sensitive to decreases in levels due to dewatering measures for local construction projects.

Sample Collection and On-Site Water-Quality Monitoring

Biological and chemical parameters of surface water quality were monitored at Wasit over two months. Fifteen surface water samples were collected from Wasit surface waters between 1:00 PM and 4:00 PM in 2021 on 21 February, 7 March, 21 March, 4 April, and 18 April. Throughout the manuscript, the dates will be referred to as week 0 for 21 February to week 8 for 18 April samplings. Samples were collected in three main pond areas, as shown in Figure 1, including areas that were accessible from the shoreline and deeper areas were accessed using an extended sampling pole or a kayak for areas that were farther from the shore. Location 1 was a small shallow upper pond, with no surface inflows or outflows, on the north-eastern corner of the reserve. Locations 2 and 3 were flowing vegetated ponds, with a seasonal overflow between the two. Locations 4, 5, 6, 7, 11, and 12 were locations around the shoreline of the Big Pond. Locations 8, 9, and 10 were in the pond’s center, accessed by kayak. Categories are shown in Table 1. On-site water-quality analysis was conducted using a HI 9829 multiparameter (Hanna Instruments, Singapore) to measure temperature, pH, salinity, turbidity, Chemical Oxygen Demand (COD), Total Dissolved Solids (TDS), Oxidation-Reduction Potential (ORP), and Electrical Conductivity (EC) at the various locations. At each location, surface water samples were collected in Nalgene or polypropylene bottles, except for bacterial analysis, where autoclaved glass bottles were used. All collected water samples were placed in a cooler and transported to the laboratory for further analysis. Additionally, the air temperature for each sampling date was recorded from an online weather log website, World Weather Online (WWO, UK) [35]. Duplicate samples were taken at sites one and three to ensure quality control during each visit.

2.2. Physical Water-Quality Parameters

Water samples were assessed using Ion Selective Electrodes (ISEs) for ammonia (HI 4101 (Hanna Instruments, Singapore)), nitrate (HI 4113 (Hanna Instruments, Singapore)), and chloride (HI 4107 (Hanna Instruments, Singapore)). Chloride samples were diluted due to their high salt content. Total nitrogen was measured using the Hanna TN (total nitrogen) Analysis System (Hanna Instruments, Singapore) on a HI 83,399 multiparameter photometer (Hanna Instruments, Singapore). Before the analysis, water samples were digested using HI 9376767B (box 1) total nitrogen high-range digestion vials for 0 to 150 mg/L range in a HI 839,800 test tube heater (Hanna Instruments, Singapore) at 105 °C. Subsequently, 2.0 mL of the digested samples and blank was added to the HI 93766V (box 2) second reagent vials (Hanna Instruments, Singapore) for analysis. Phosphorus was tested by HI 83,399 multiparameter photometer (Hanna Instruments, Singapore). Prior to the analysis, the HI 839,800 test tube heater, was preheated to 150 °C. The HI 93758V phosphorus reagent vials (0.0 to 32.6 mg/L) were used for sample analysis (Hanna Instruments, Singapore). Then, 2.0 mL of HI 93758C total phosphorus reagent C was added to each vial, followed by 0.5 mL of HI93763B-0 total phosphorous high range reagent B (Hanna Instruments, Singapore). Chemical Oxygen Demand (COD) was tested using a HI 83,399 multiparameter photometer (Hanna Instruments, Singapore). COD samples were tested using HI 93754C-25 HR (Hanna Instruments, Singapore) high-range COD vials (0 to 15,000 mg/L) on a COD reactor and HI 839,800 test tube heater (Hanna Instruments, Singapore) preheated to 150 °C.

2.3. Bacterial Analysis—Total Coliform and Escherichia coli (E. coli) E. coli Analysis (IDEXX)

Samples collected for bacterial analysis were immediately analyzed using the IDEXX Colilert®-18 system (IDEXX, Westbrook, ME, USA). The Colilert®-18 simultaneously detects both total coliforms and Escherichia coli in water within 18 h and dilution factors were modified based on initial sampling, including ratios of 1:100, 1:10 and 1:20. Dilution water blanks for the IDEXX were made for each sampling period and showed no contamination from the dilution water.

2.4. Water Quality Index and Assessment of Hazard

To estimate the water quality, we applied the water quality index (CCME) developed by the British Columbia Ministry of Environment, Lands and Parks and later modified by Alberta Environment [36]. Although no guidelines are available for hypersaline wetlands in the UAE, values were compared with relevant regional marine water-quality guidelines provided by the United Arab Emirates Ministry of Climate Change and Environment [37] and Dubai Municipality standards [38]. Where neither values were available, global parameters obtained from the Environmental Protection Agency (EPA) standards [39] were used. Index scores were determined for 15 parameters: temperature, pH, EC, Turbidity, DO, Chloride, Nitrates, Ammonia, COD, Total nitrogen, Total Phosphorus, Total Coliforms, and E. coli Coliforms. The WQI equation is calculated using three factors:
  • Calculate F1 which represents the number of variables whose objectives are not met
    F 1 = N u m b e r   o f   f a i l e d   v a r i a b l e s T o t a l   n u m b e r   o f   v a r i a b l e s   × 100
  • Calculate F2 which represents the frequency by which the objectives are not met
    F 2 = N u m b e r   o f   f a i l e d   t e s t s T o t a l   n u m b e r   o f   t e s t s   × 100
  • Calculate F3 representing the amount by which the objectives are not met
    E x c u r s i o n = F a i l e d   t e s t   v a l u e G u i d e l i n e   v a l u e   × 1 n s e = excursion   T o t a l   n u m b e r   o f   t e s t s     F 3 = n s e 0.01 n s e + 0.01    
    Finally, all values are used for the equation
    C C M E   W Q I = 100   F 1 2 + F 2 2 + F 3 2   1.732    
The index generated ranges between 1 and 100. A CCME WQI value of 95–100 means excellent water quality protected by the absence of threats, values of 80–94 is good water quality with only a minor degree of threat, 65–79 is fair water quality but occasionally threatened, a value of 45–64 is marginal water quality with conditions that often depart from natural or desirable levels, and, finally, 0–44 represents poor water quality or water that is almost always threatened [40,41].
Additionally, the Water Pollution Index (WPI) was calculated for comparison purposes using a method previously applied by Hossain and Patra, (2020) [42]. This method was applied in the following steps:
  • The calculation of pollution load (PL)
    P L = 1 + C S S
    where C is the observed concentration of the specific parameter and S represents the standard or highest permissible limit.
  • The calculation of the water pollution index (WPI)
    W P I = 1 n   P L
The summation of all the pollution loads was calculated for each parameter and then divided by the number of parameters or variables, in this case 13, including temperature, pH, EC, Turbidity, DO, Chloride, Nitrates, Ammonia, COD, Total nitrogen, Total Phosphorus, Total Coliforms, and E. coli Coliforms.
The index generated ranges between 0 and 1. A WPI value below 0.5 means excellent, values of 0.5–0.75 is good water quality, 0.75–1 is moderately polluted water, and, finally, values higher than 1 represent highly polluted water [42,43].

2.5. Heavy Metal Analysis of Sediments

In total, 12 sediment samples were collected on all sampling sites and sent to Al Futtaim Element Materials Technology Dubai for heavy-metals analysis (Cd, Al, As, Cr, Cu, Fe, Pb, Ni, Zn, Hg). The sample preparation and digestion procedure were based on ISO 11466:1995, Soil Quality—Extraction of Trace Elements Soluble in Aqua Regia [44]. Briefly, a sample was homogenized, and a subsample was dried, crushed, and sieved. Then, 1 g of the sample was digested in an aqua regia acid mixture (2.5 mL HNO3 + 7.5 mL HCl) in a hot block at 110 °C for 1.5 h. A quality control sample was analyzed along with a batch of samples. The digested solution was allowed to cool, diluted to 50 mL volume and filtered prior to analysis. The quantification of metal concentration was performed using an Agilent 5110 SVDV ICP OES (Inductively Coupled Plasma—Optical Emission Spectrometry) and PSA Mercury Analyser. The metals were analyzed on the ICP OES based on APHA 3120B method at a range of 1 mg/kg to 5000 mg/kg. The mercury analysis was completed in the PS Analytical Millenium Mercury analyzer at a detection range of 0.01 mg/kg to 0.05 mg/kg. Quantification was achieved by comparison of the emission signal for each element with calibration standards prepared from ISO Guide 17,034 certified standards. The samples were spiked with Yttrium internal standard to correct for physical interferences. The mercury analysis on the PSA Mercury analyzer used a Cold Vapor Atomic Fluorescence Spectrometry technique based on EPA 245.7 [45]. A quality control assessment is completed before reporting results, including assessment of calibration linearity, analysis of independent calibration check standards, and method blanks. The spike recovery on the digested QC sample must fall between predetermined limits on a control chart. Results are reported against the validated limits of detection.
The Hazard quotient (HQ) was used as an indication of the harm that a pollutant could present to the aquatic environment. The HQ is calculated using environmental quality standards (EQS) for comparison purposes. The HQ was calculated using the concentration of metals in sediments (CS) as follows:
H Q = C s E Q S    
The calculated HQ for sediments is analyzed based on a value of HQ > 1, indicates an ecological hazard, HQ < 1 unpolluted site, 1 < HQ < 2 low pollutant loads with no acute danger for organisms; 2 < HQ < 10 intermediate pollution leading to fatal effects to sensitive organisms and a value HQ > 10 indicates high pollution which could reduce the diversity of benthic organisms [46,47].
As mentioned above, regional marine water quality guidelines provided by the United Arab Emirates Ministry of Climate Change and Environment [37] and Dubai Municipality standards [38]. In the case where neither value were available global parameters obtained from Environmental Protection Agency (EPA) standards [48] were used.

3. Results

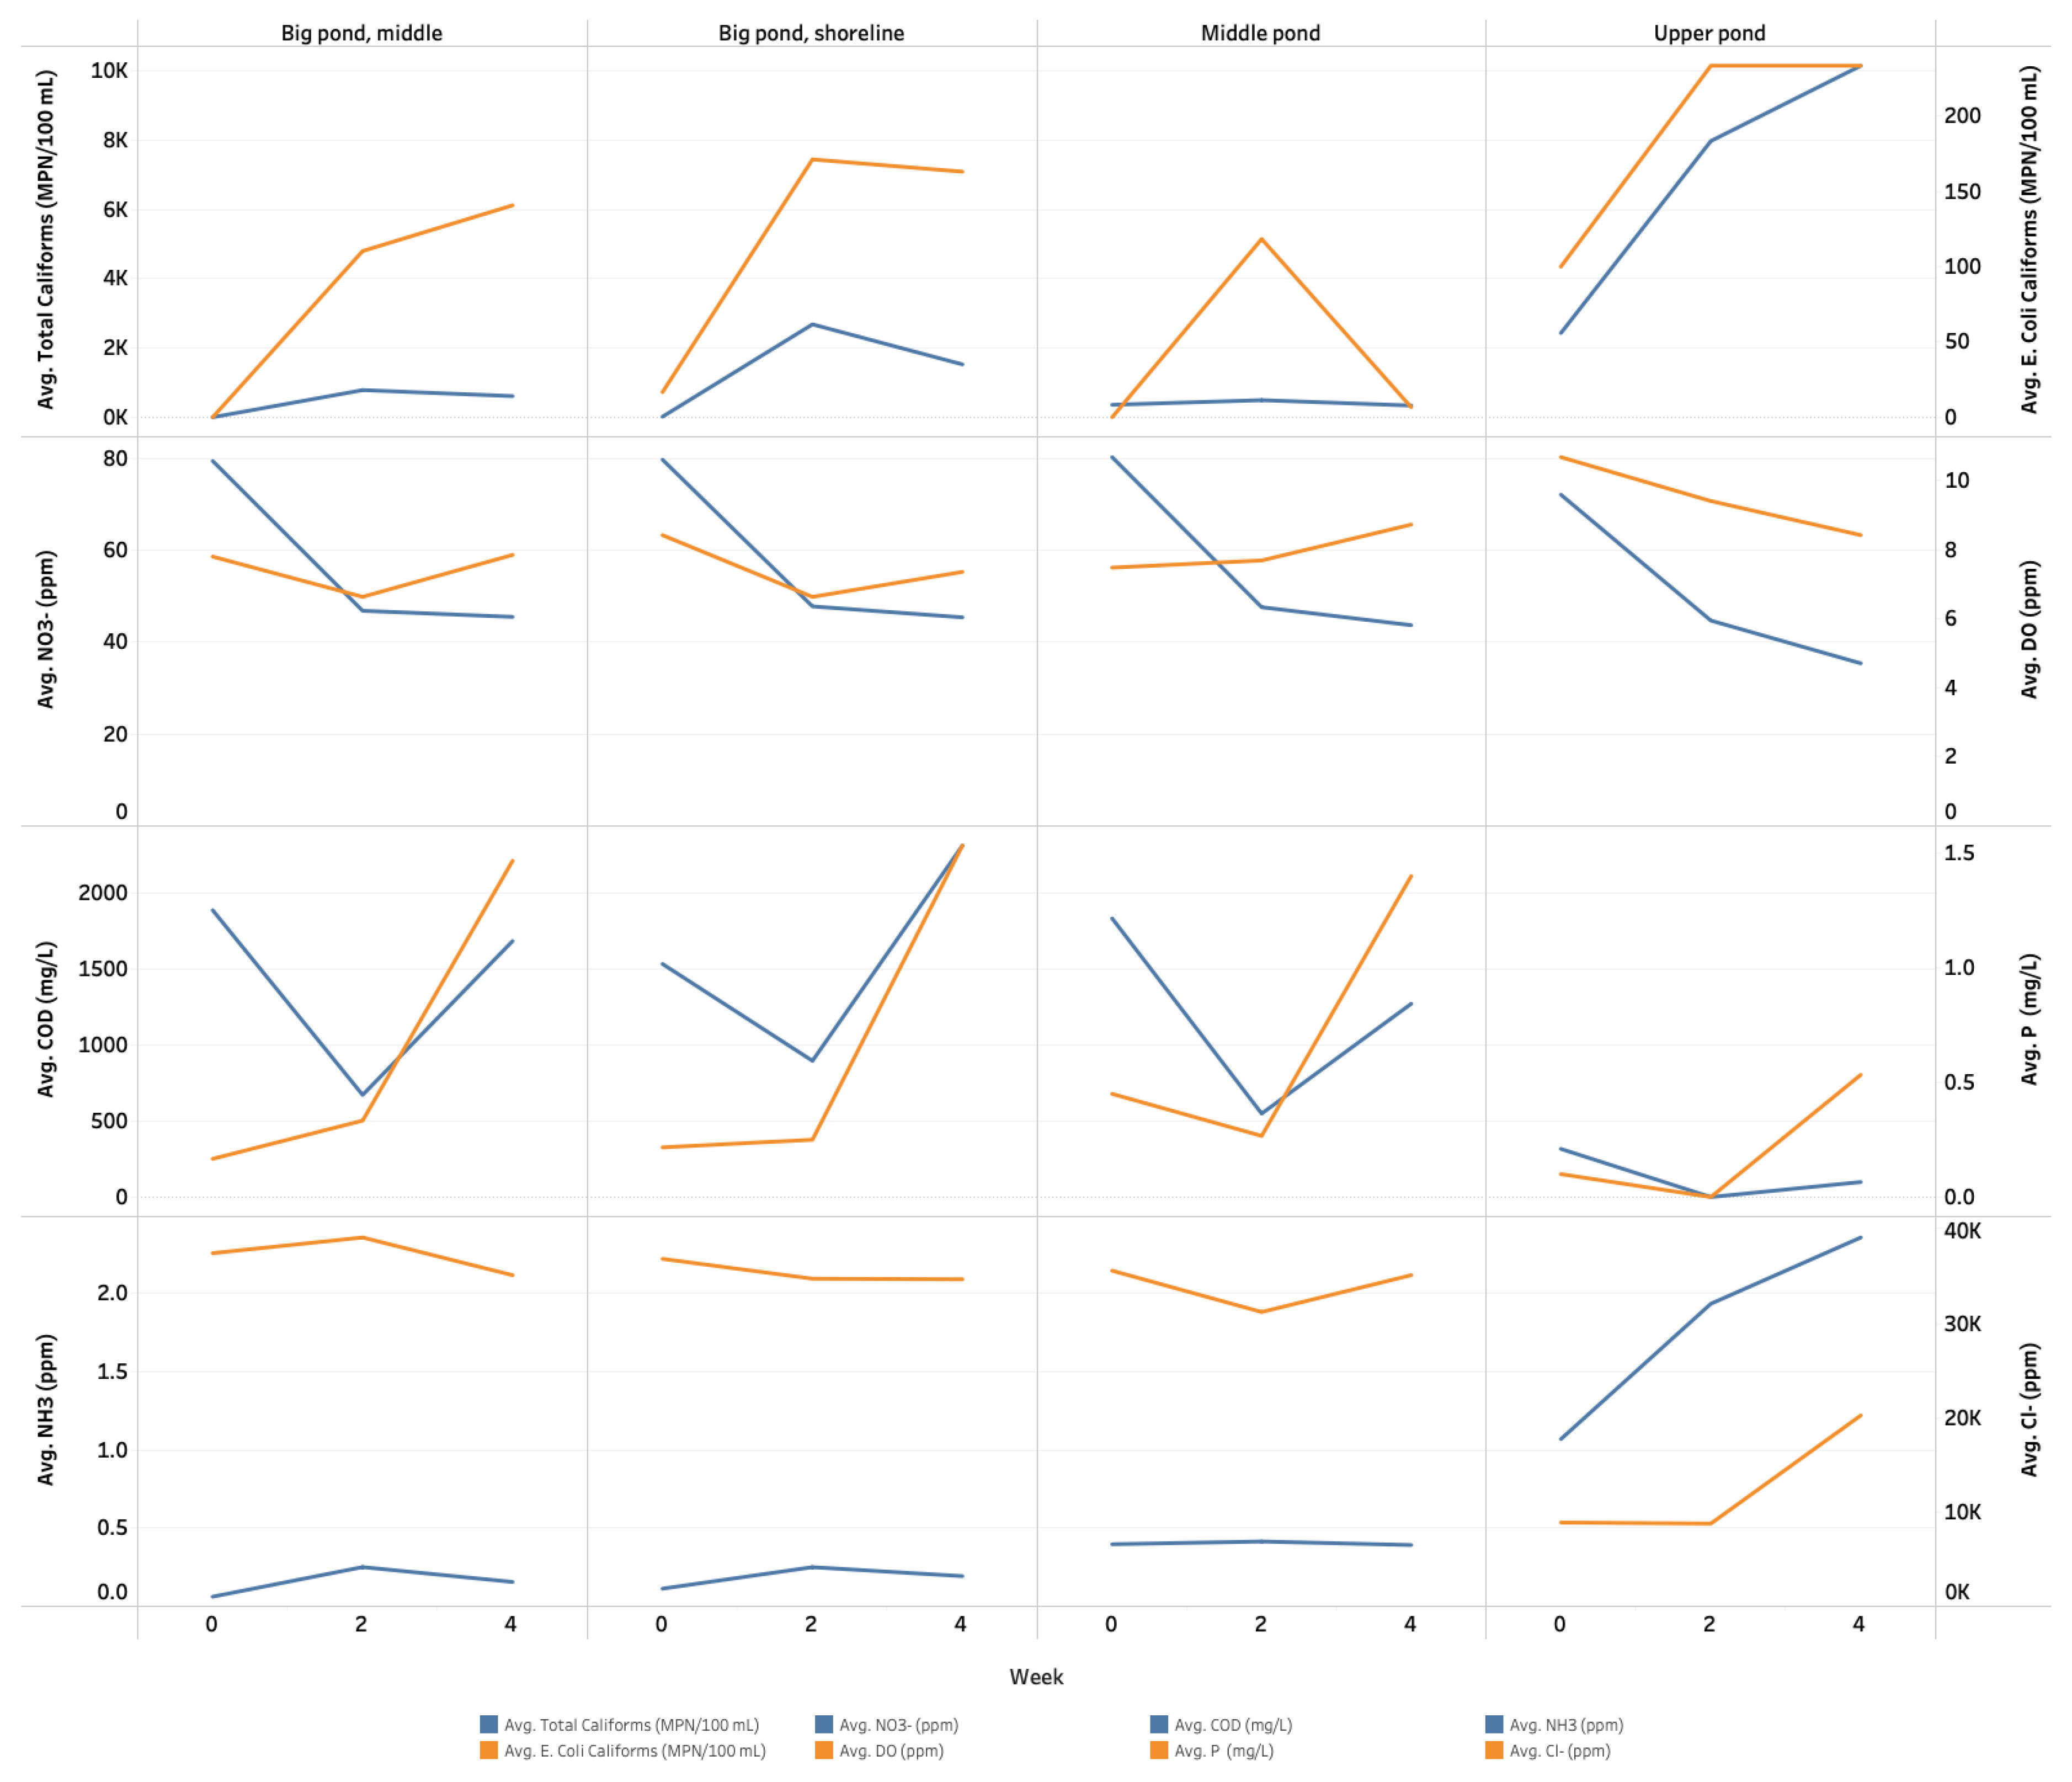
3.1. Water Quality Parameters

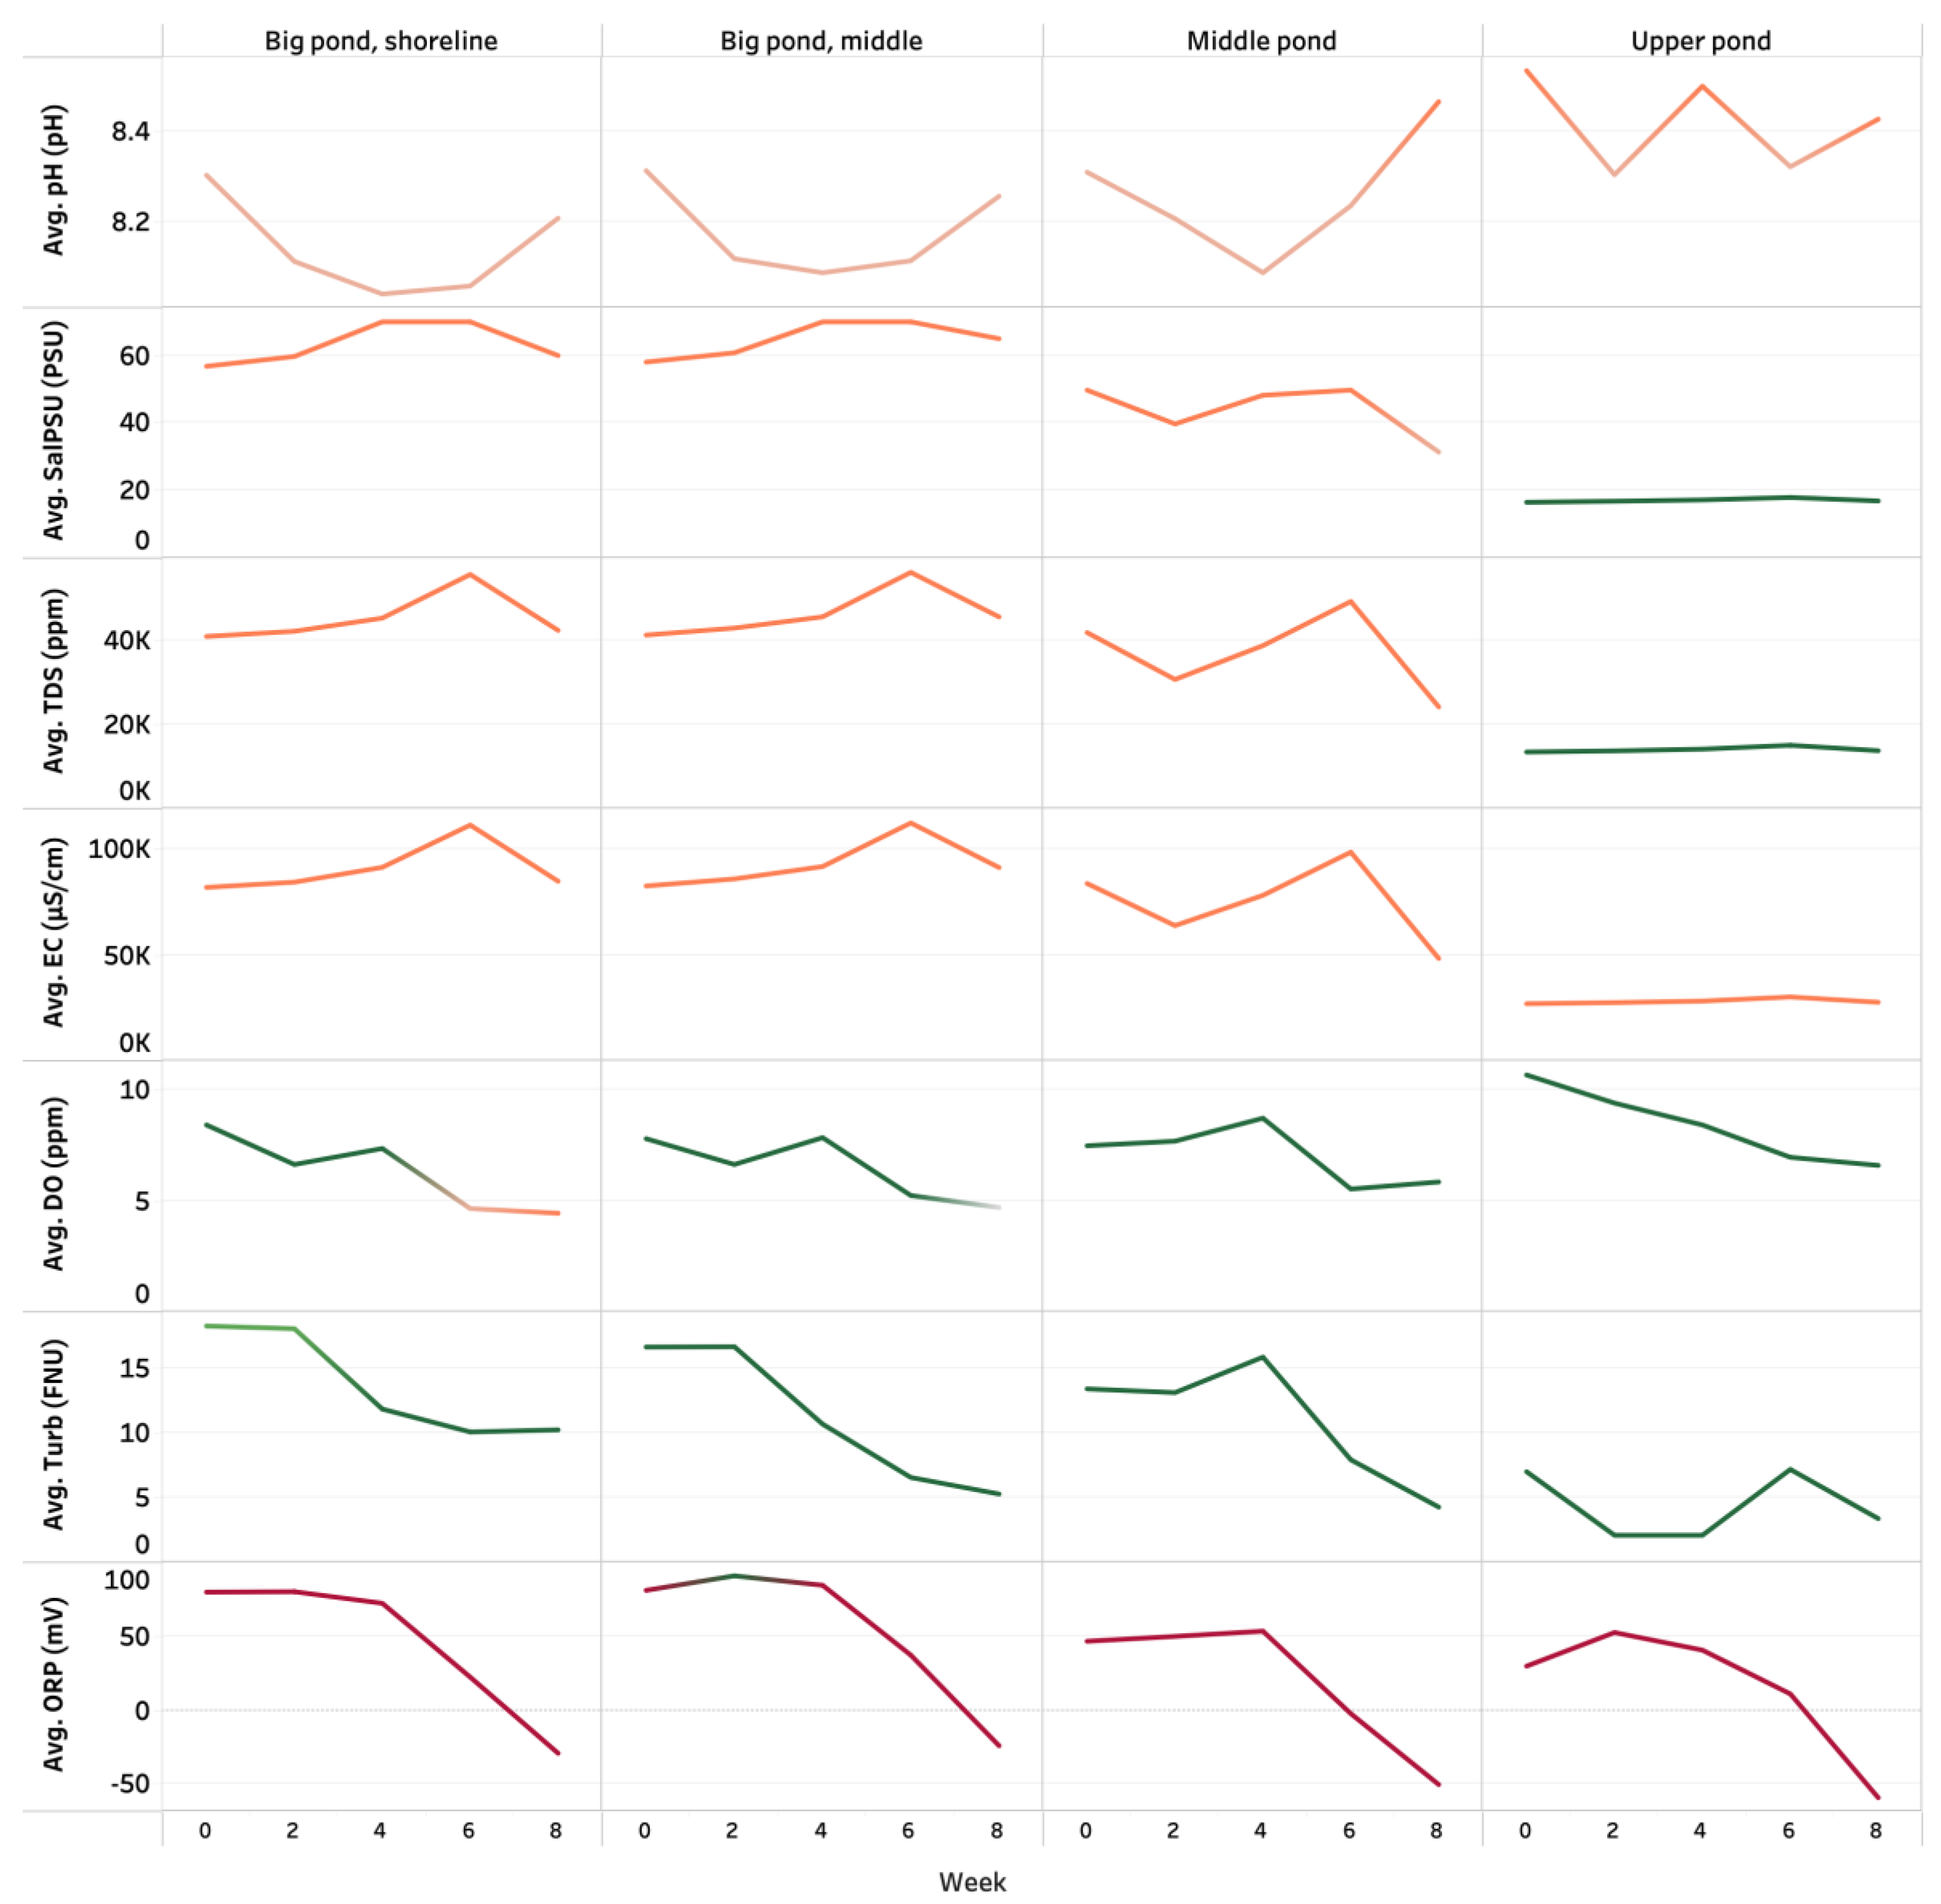
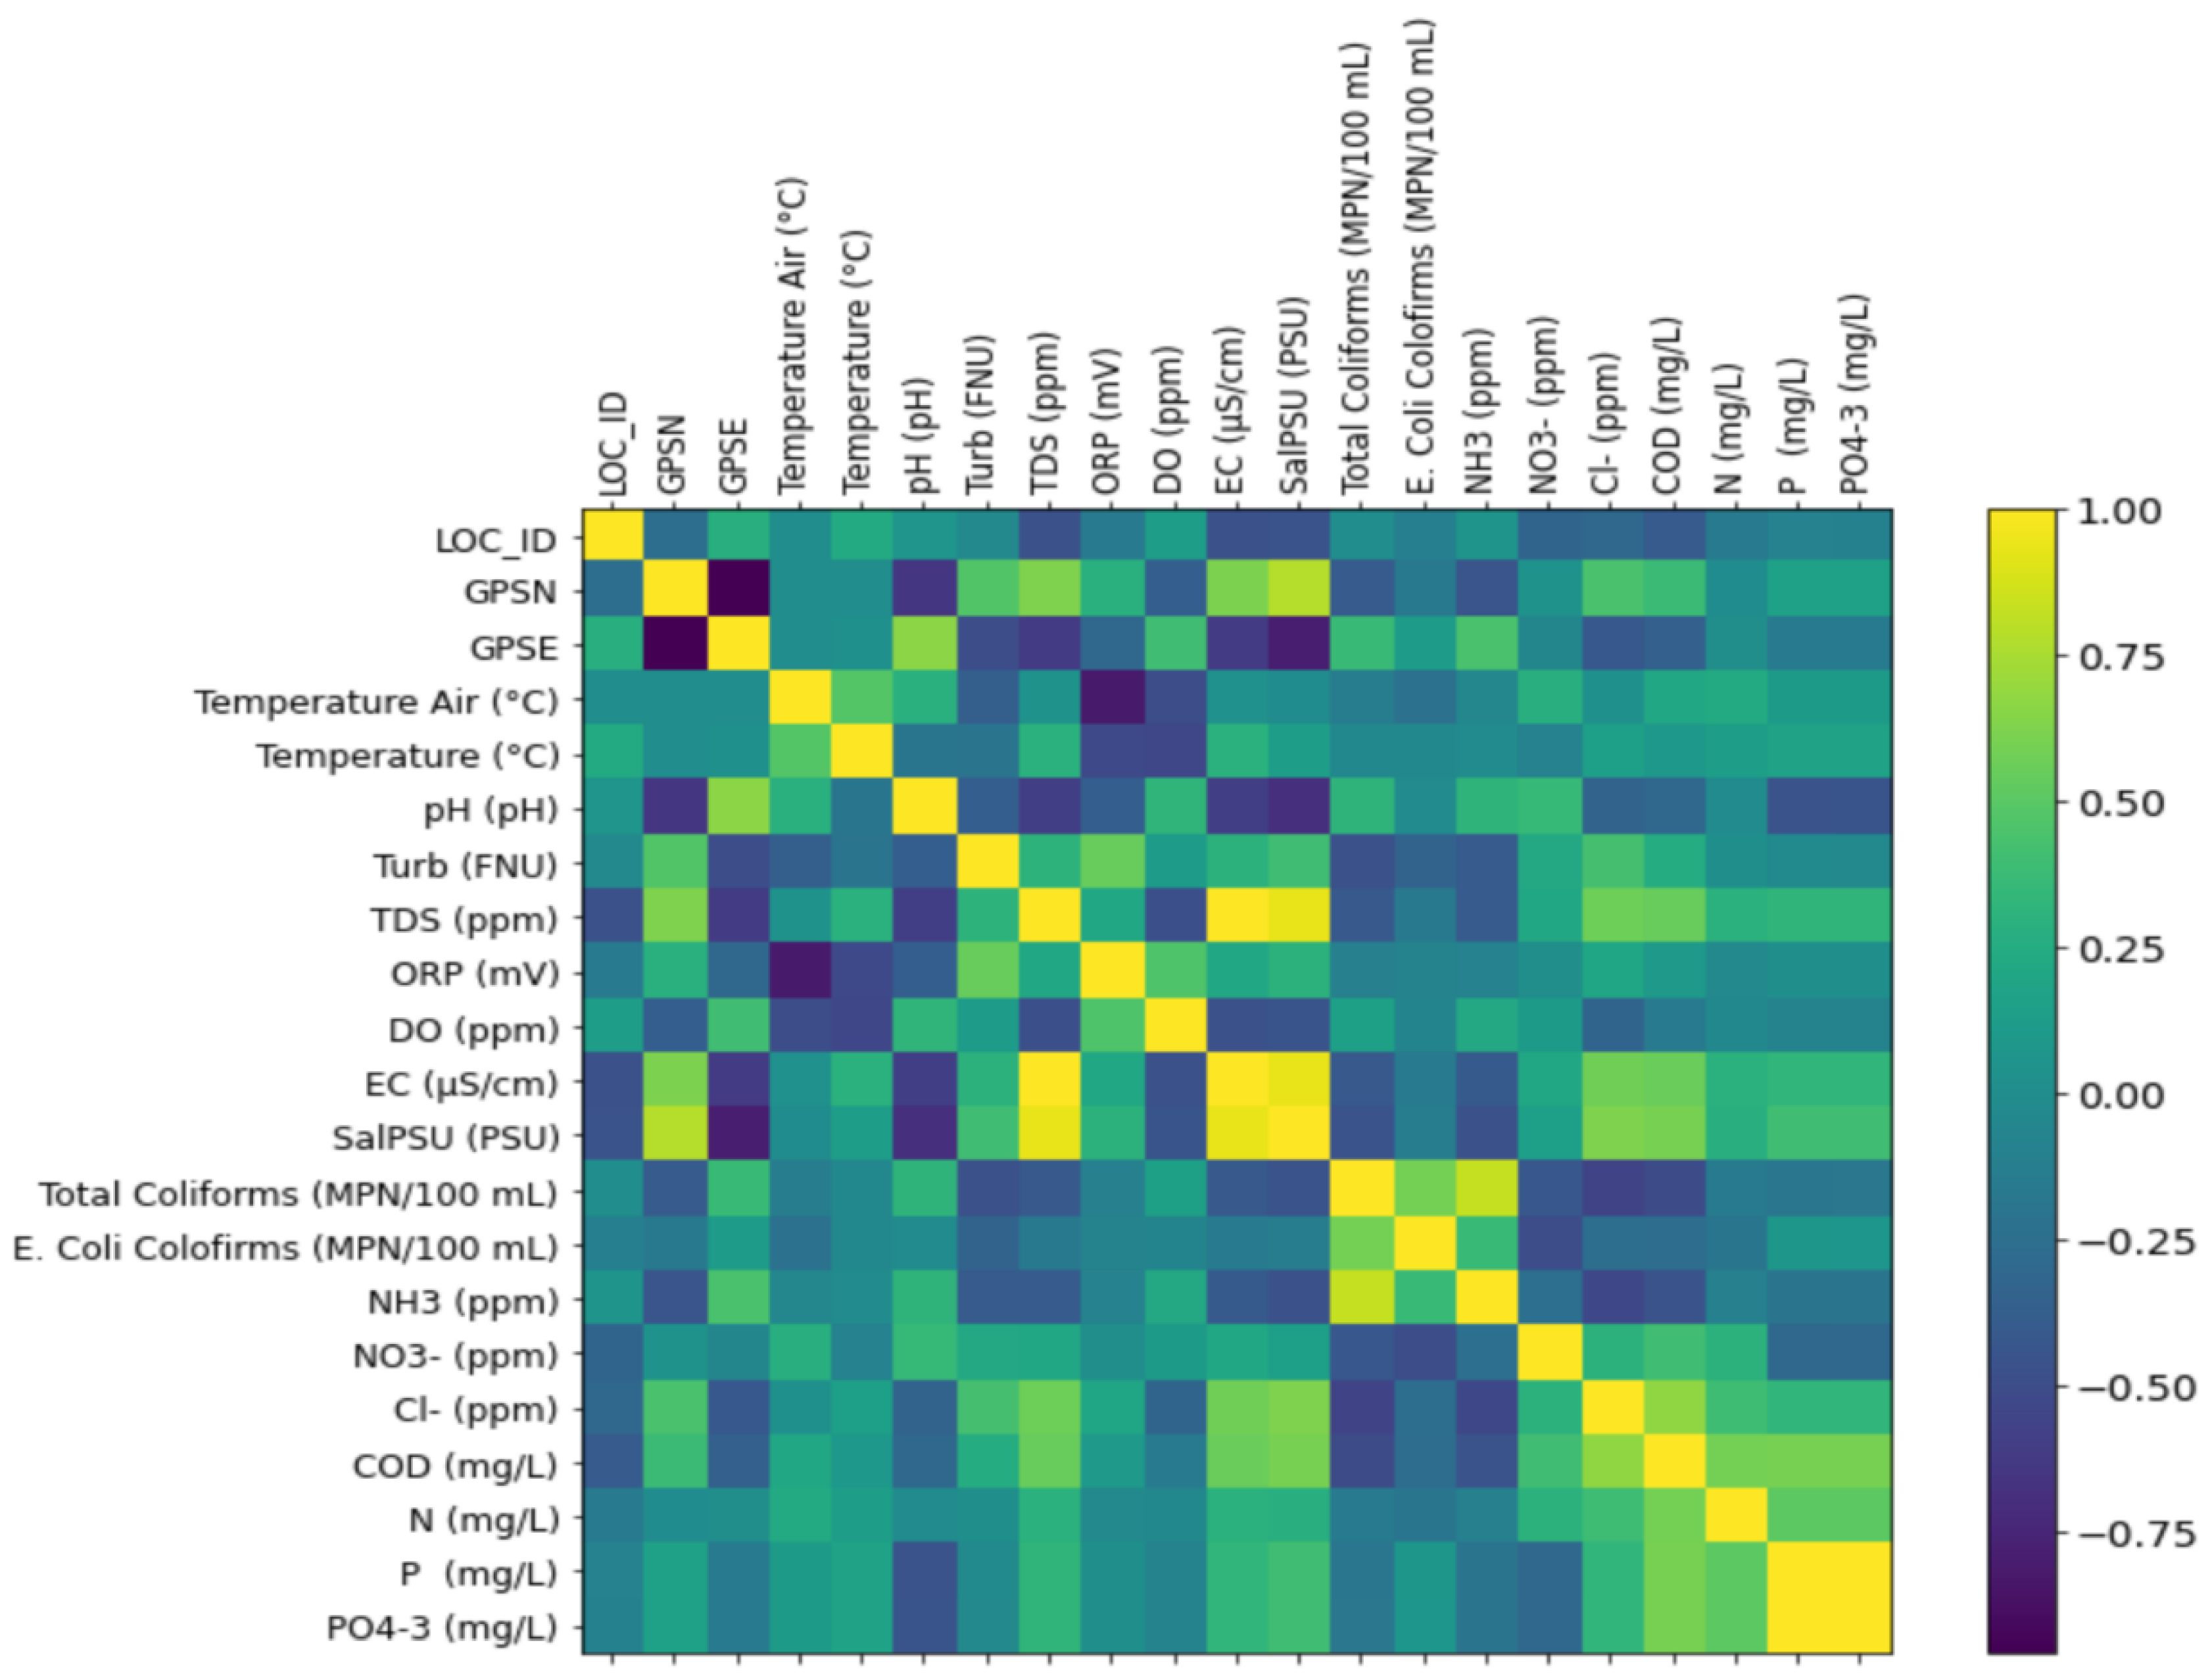
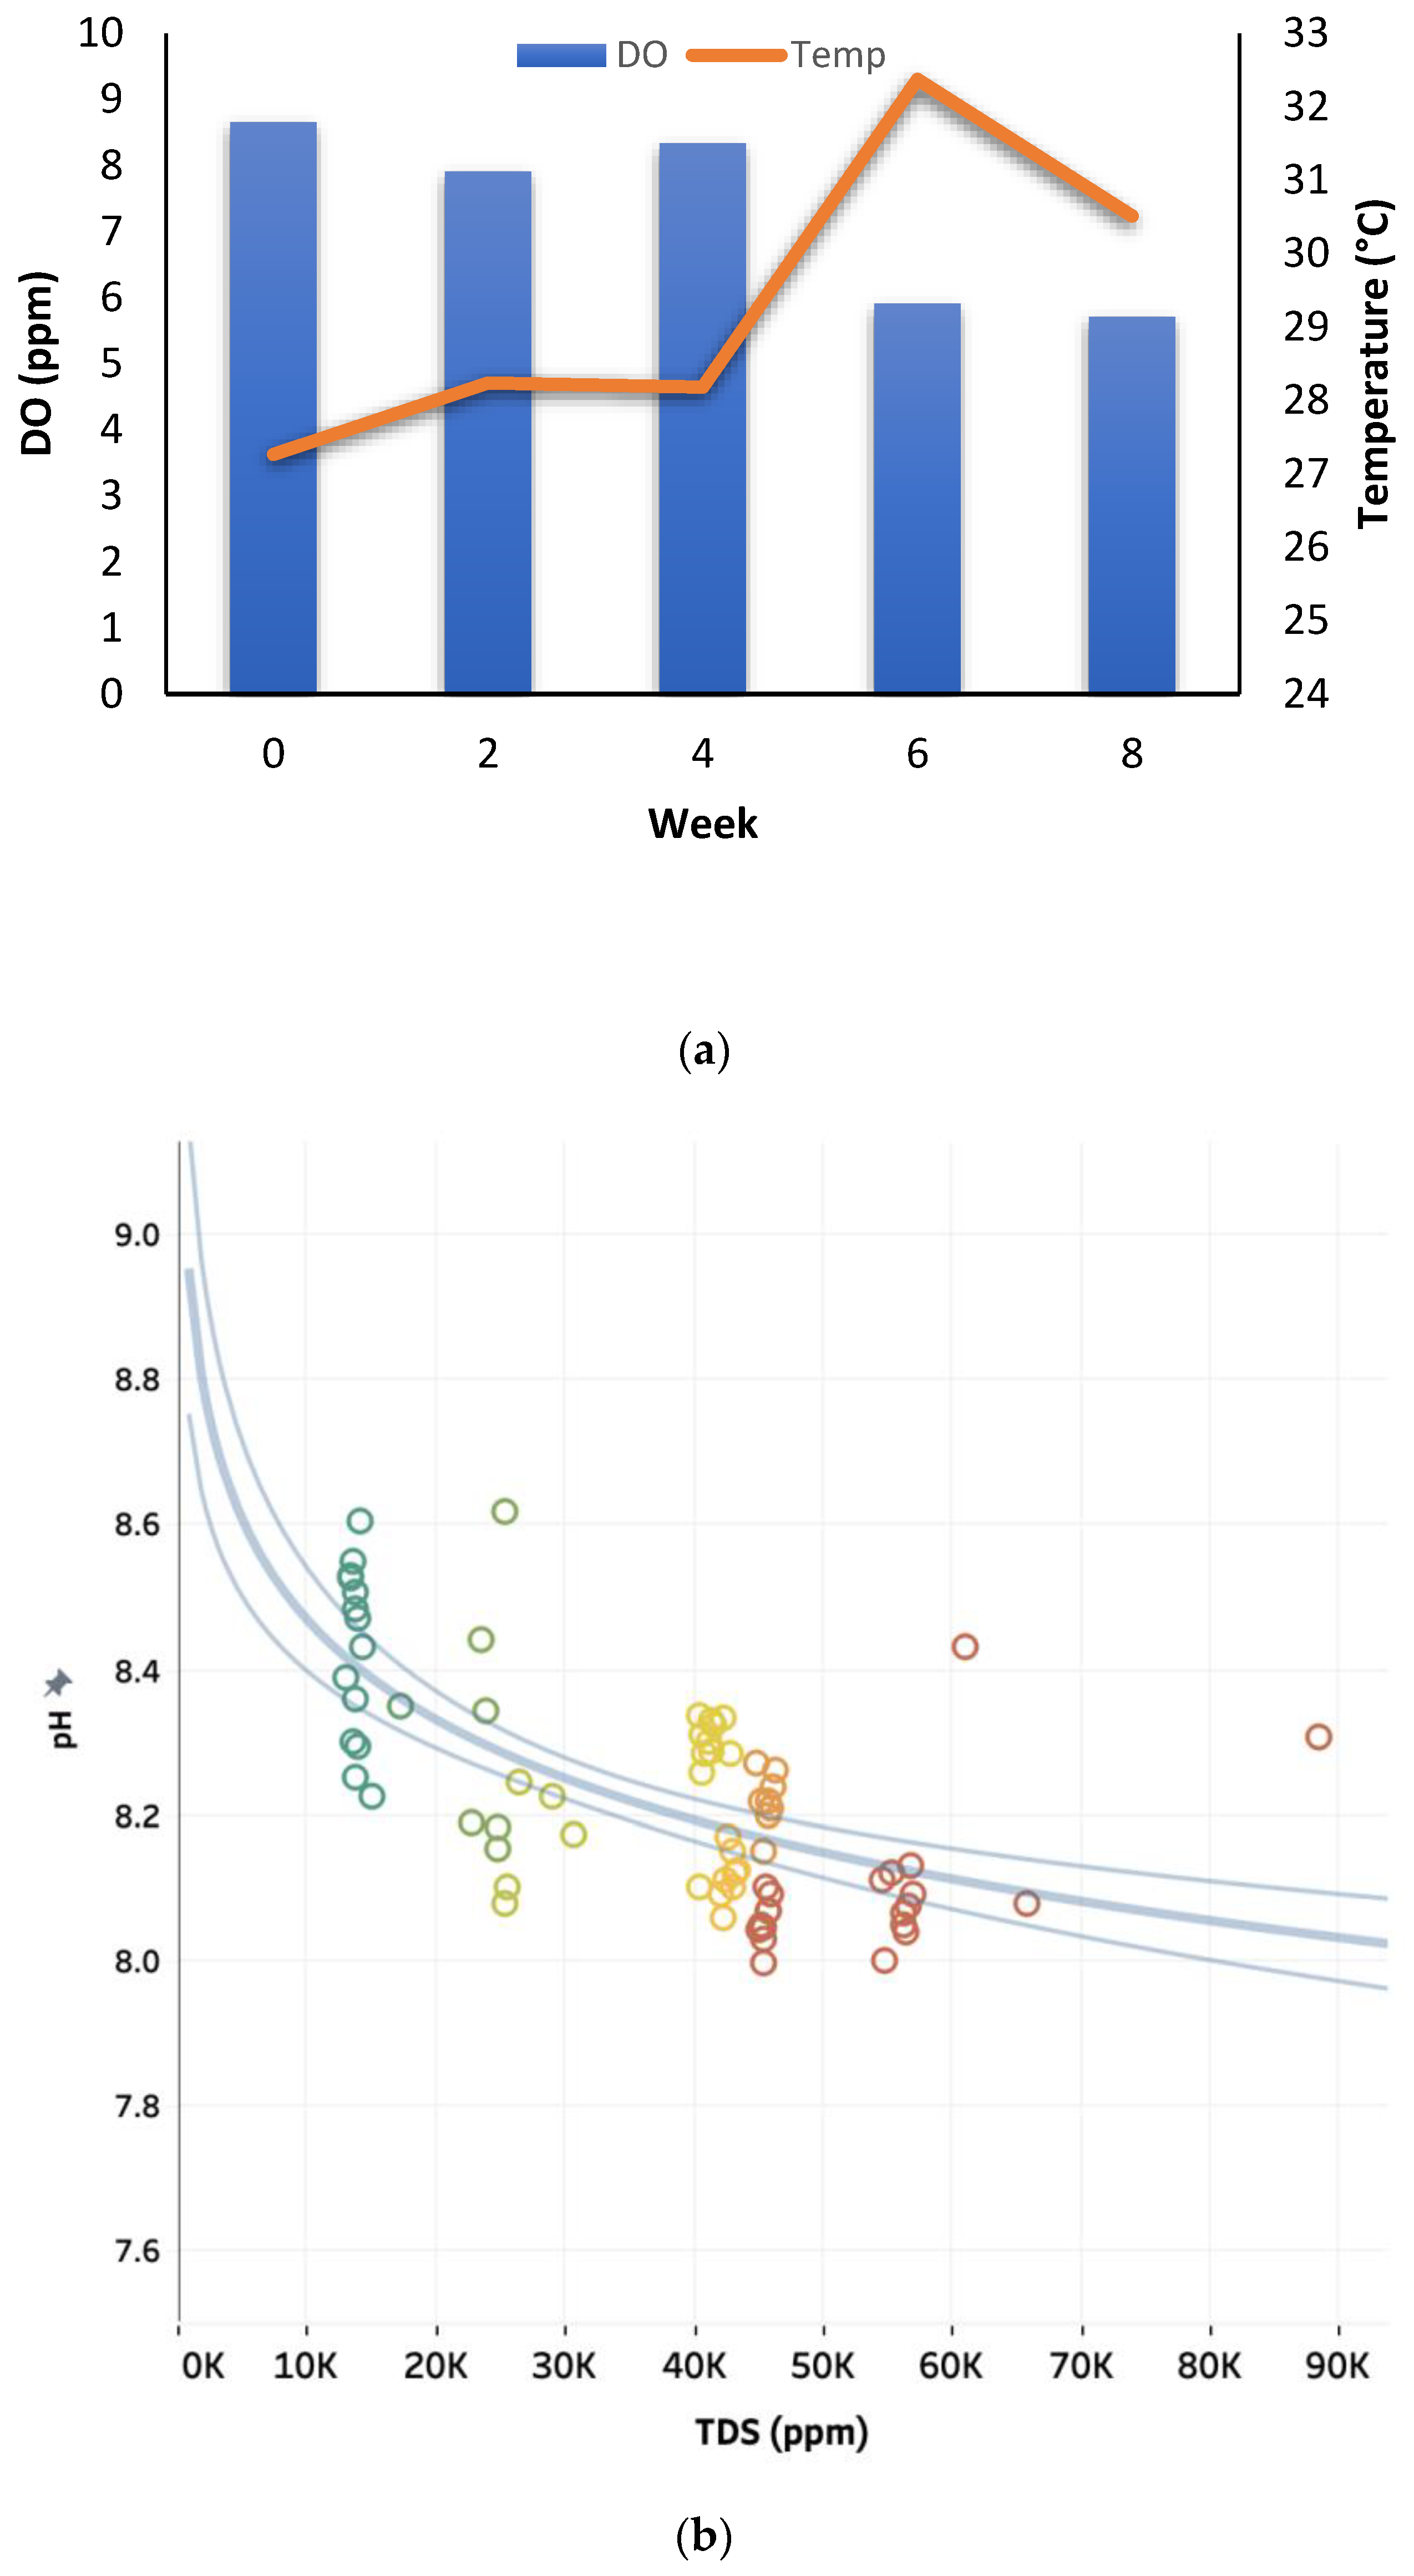
3.1.1. On-Site Measured Parameters

Parameters measured on-site included temperature, pH, turbidity, Total Dissolved Solids (TDS), oxidation-reduction potential (ORP), dissolved oxygen (DO), electrical conductivity (EC), and salinity, which are summarized in Table 2. Each site was categorized based on its location, as shown in Figure 1, which included the upper pond, middle pond, and big pond (further divided into middle and shoreline). The results report an average temperature based on 5 sampling trips of 29.31 °C, the temperature increased on average from 26.98 °C to 30.57 °C and the air temperature obtained through World Weather Online [35] also increased from 27 to 33 °C during the sampling period. Therefore, the increase in air temperature led to the increase in water temperature. Figure 2 shows the time series of water-quality parameters, including pH, EC, ORP, DO, and turbidity measured in the wetland during the 5 weeks. The pH of the surface water varied between samplings but remained between 8.00 to 8.60 and was higher in the upper pond. When assessing salinity, total dissolved solids and electrical conductivity the lowest values were measured in the upper pond (which eventually receives the waters coming from the rest of the wetland), followed by the middle pond and, finally, the big pond. No difference was observed between the middle deeper areas of the big pond and the shoreline. The highest values were recorded in week 6, which is consistent with the higher temperature measured at that time. ORP and EC were 35.39 mV and 74,030.96 µS/cm in the study area. Initially, the ORP levels were positive and reflected highly oxygenated surface water.

3.1.2. In-Lab Measured Parameters

In addition to the water-quality parameters measured on-site which included five biweekly sampling trips, samples transported to the laboratory were assessed for chloride, nitrates, ammonia, COD, and total nitrogen and phosphorous during the first three sampling collections and are shown in Table 2. The lowest concentration of chloride was detected in the upper pond during all three sampling trips and ranged from 8000 ppm to 20,000 ppm. On the other hand, the middle pond and both big ponds had relatively higher chloride concentrations ranging from 30,000 ppm to 40,000 ppm. The middle and big pond, shoreline and middle did not show significant variation, but big pond, middle reported the highest chloride concentration, 39,133 ppm (Table 2). Over time, slight changes in chloride concentration were observed in all sampling locations, indicating potential dilutions.
Nitrate concentration was highest in the middle pond, with values 43.67 ppm, 47.57 ppm, and 80.20 ppm during weeks 0, 2 and 4, respectively. The lowest nitrate levels were found in the upper pond at 35.35 ppm. Ammonia concentration was the highest in the upper pond, with values of 1.07 ppm, 1.93 ppm, and 2.36 ppm for weeks 0, 2 and 4, respectively. Alternatively, the lowest ammonia concentrations were found in the big pond, middle, with a lowest of 0.06 ppm but increased thereafter. COD were the highest in the big pond, shoreline with a value of 2308.67 mg/L (Table 2). The lowest concentration of COD was found in the upper pond at 68.00 mg/L.
Total nitrogen was highest at the middle pond (54.00 mg/L) and the lowest at the upper pond (2.00 mg/L). There was a noticeable drop in nitrogen levels in the second trip and a sudden increase in the third trip whereby the levels fluctuated greatly. The lowest phosphorus levels were found in the upper pond with values of 0.03 mg/L, 0.00 mg/L, and 0.53 mg/L during weeks 0, 2, and 4, respectively. Alternatively, the highest phosphorus concentrations were found on the big pond, shoreline at 0.67 mg/L.

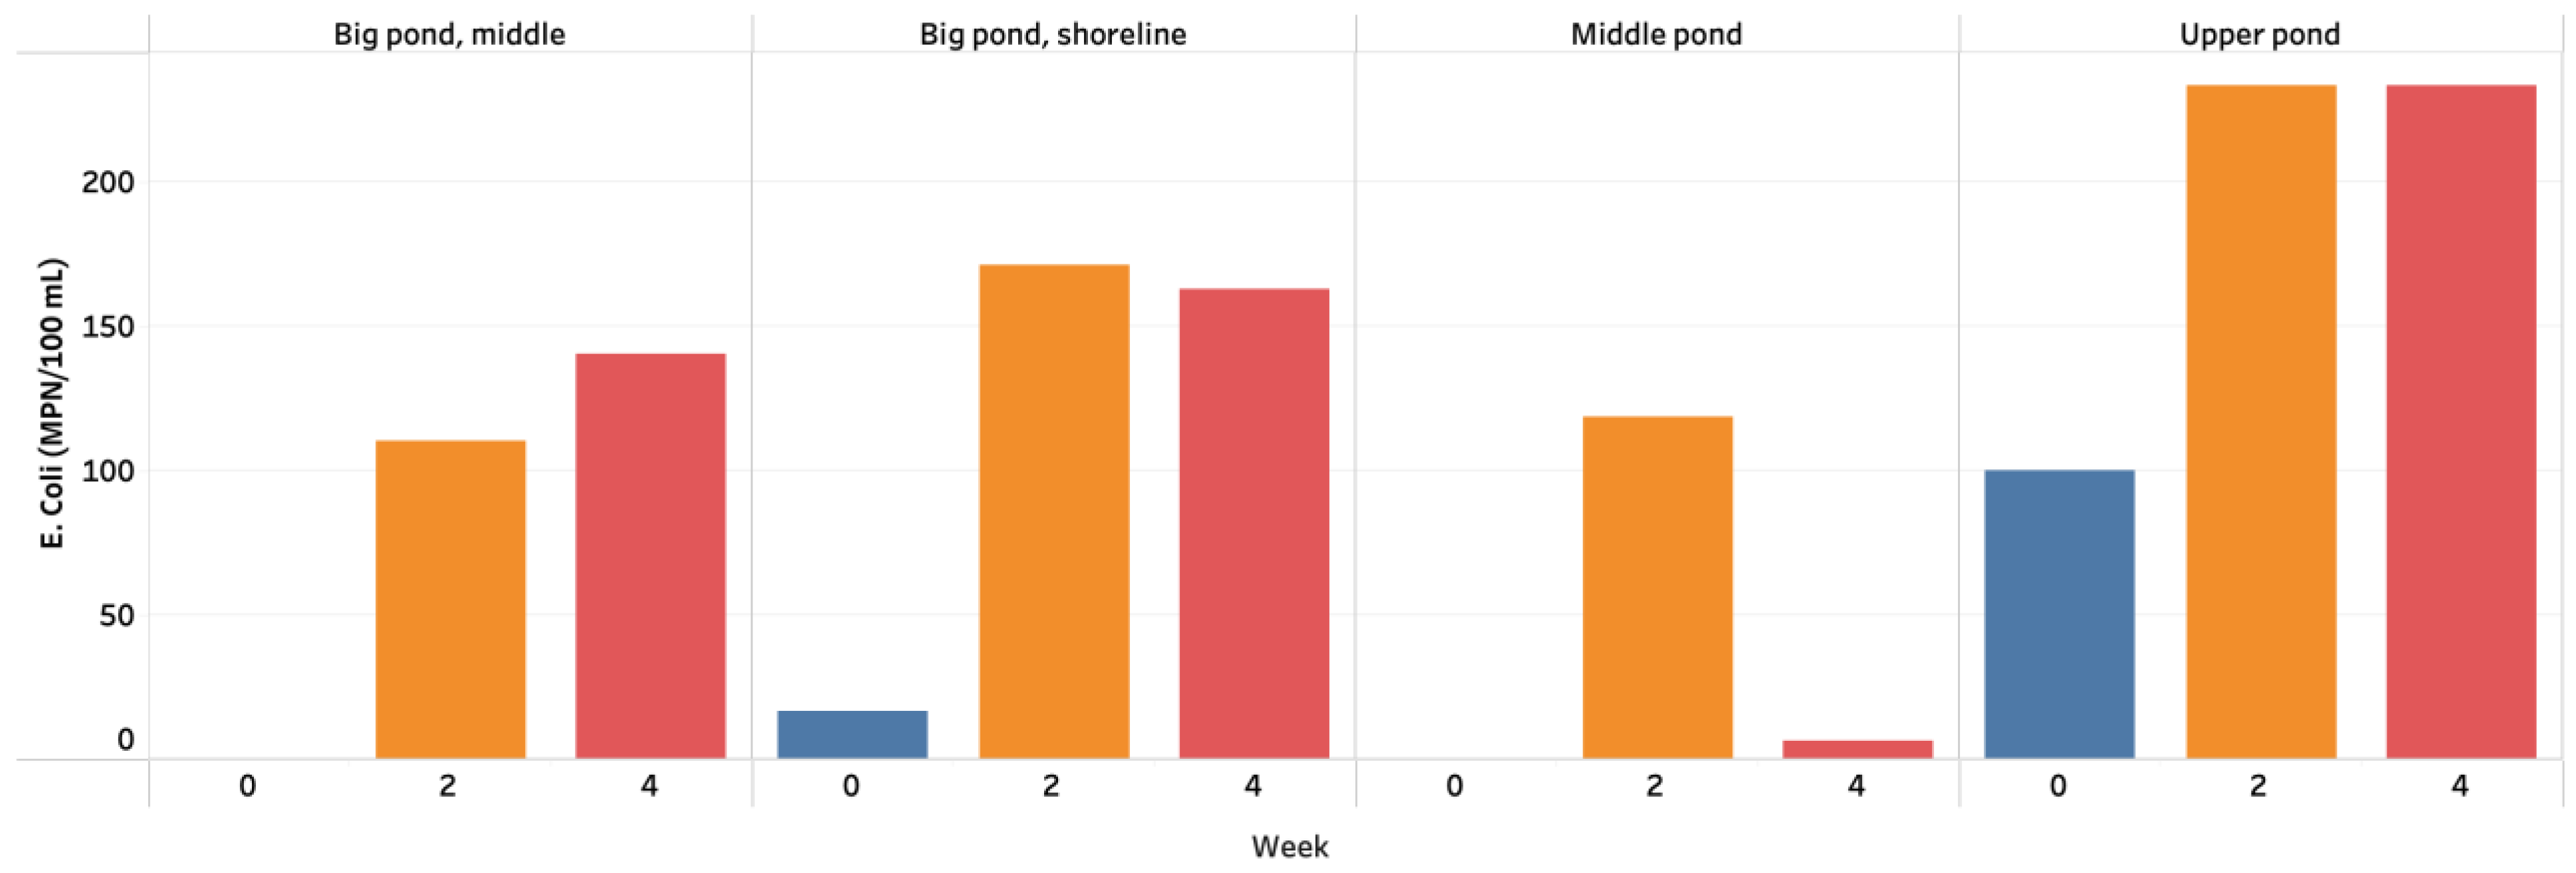
3.2. Bacterial Analysis—Total Coliform and E. coli Analysis (IDEXX)

Bacterial analysis was performed on the samples collected during the first three sampling periods of the study (week 0, week 2, and week 4). The IDEXX analysis showed the presence of bacteria and E. coli with an average bacterial coliforms of 2282.5 MPN per 100 mL of surface water and average E. coli 107.8 MPN per 100 mL of surface water as shown in Table 3. Both total coliforms and E. coli increased throughout the study, and the highest values were consistently reported in the upper pond.

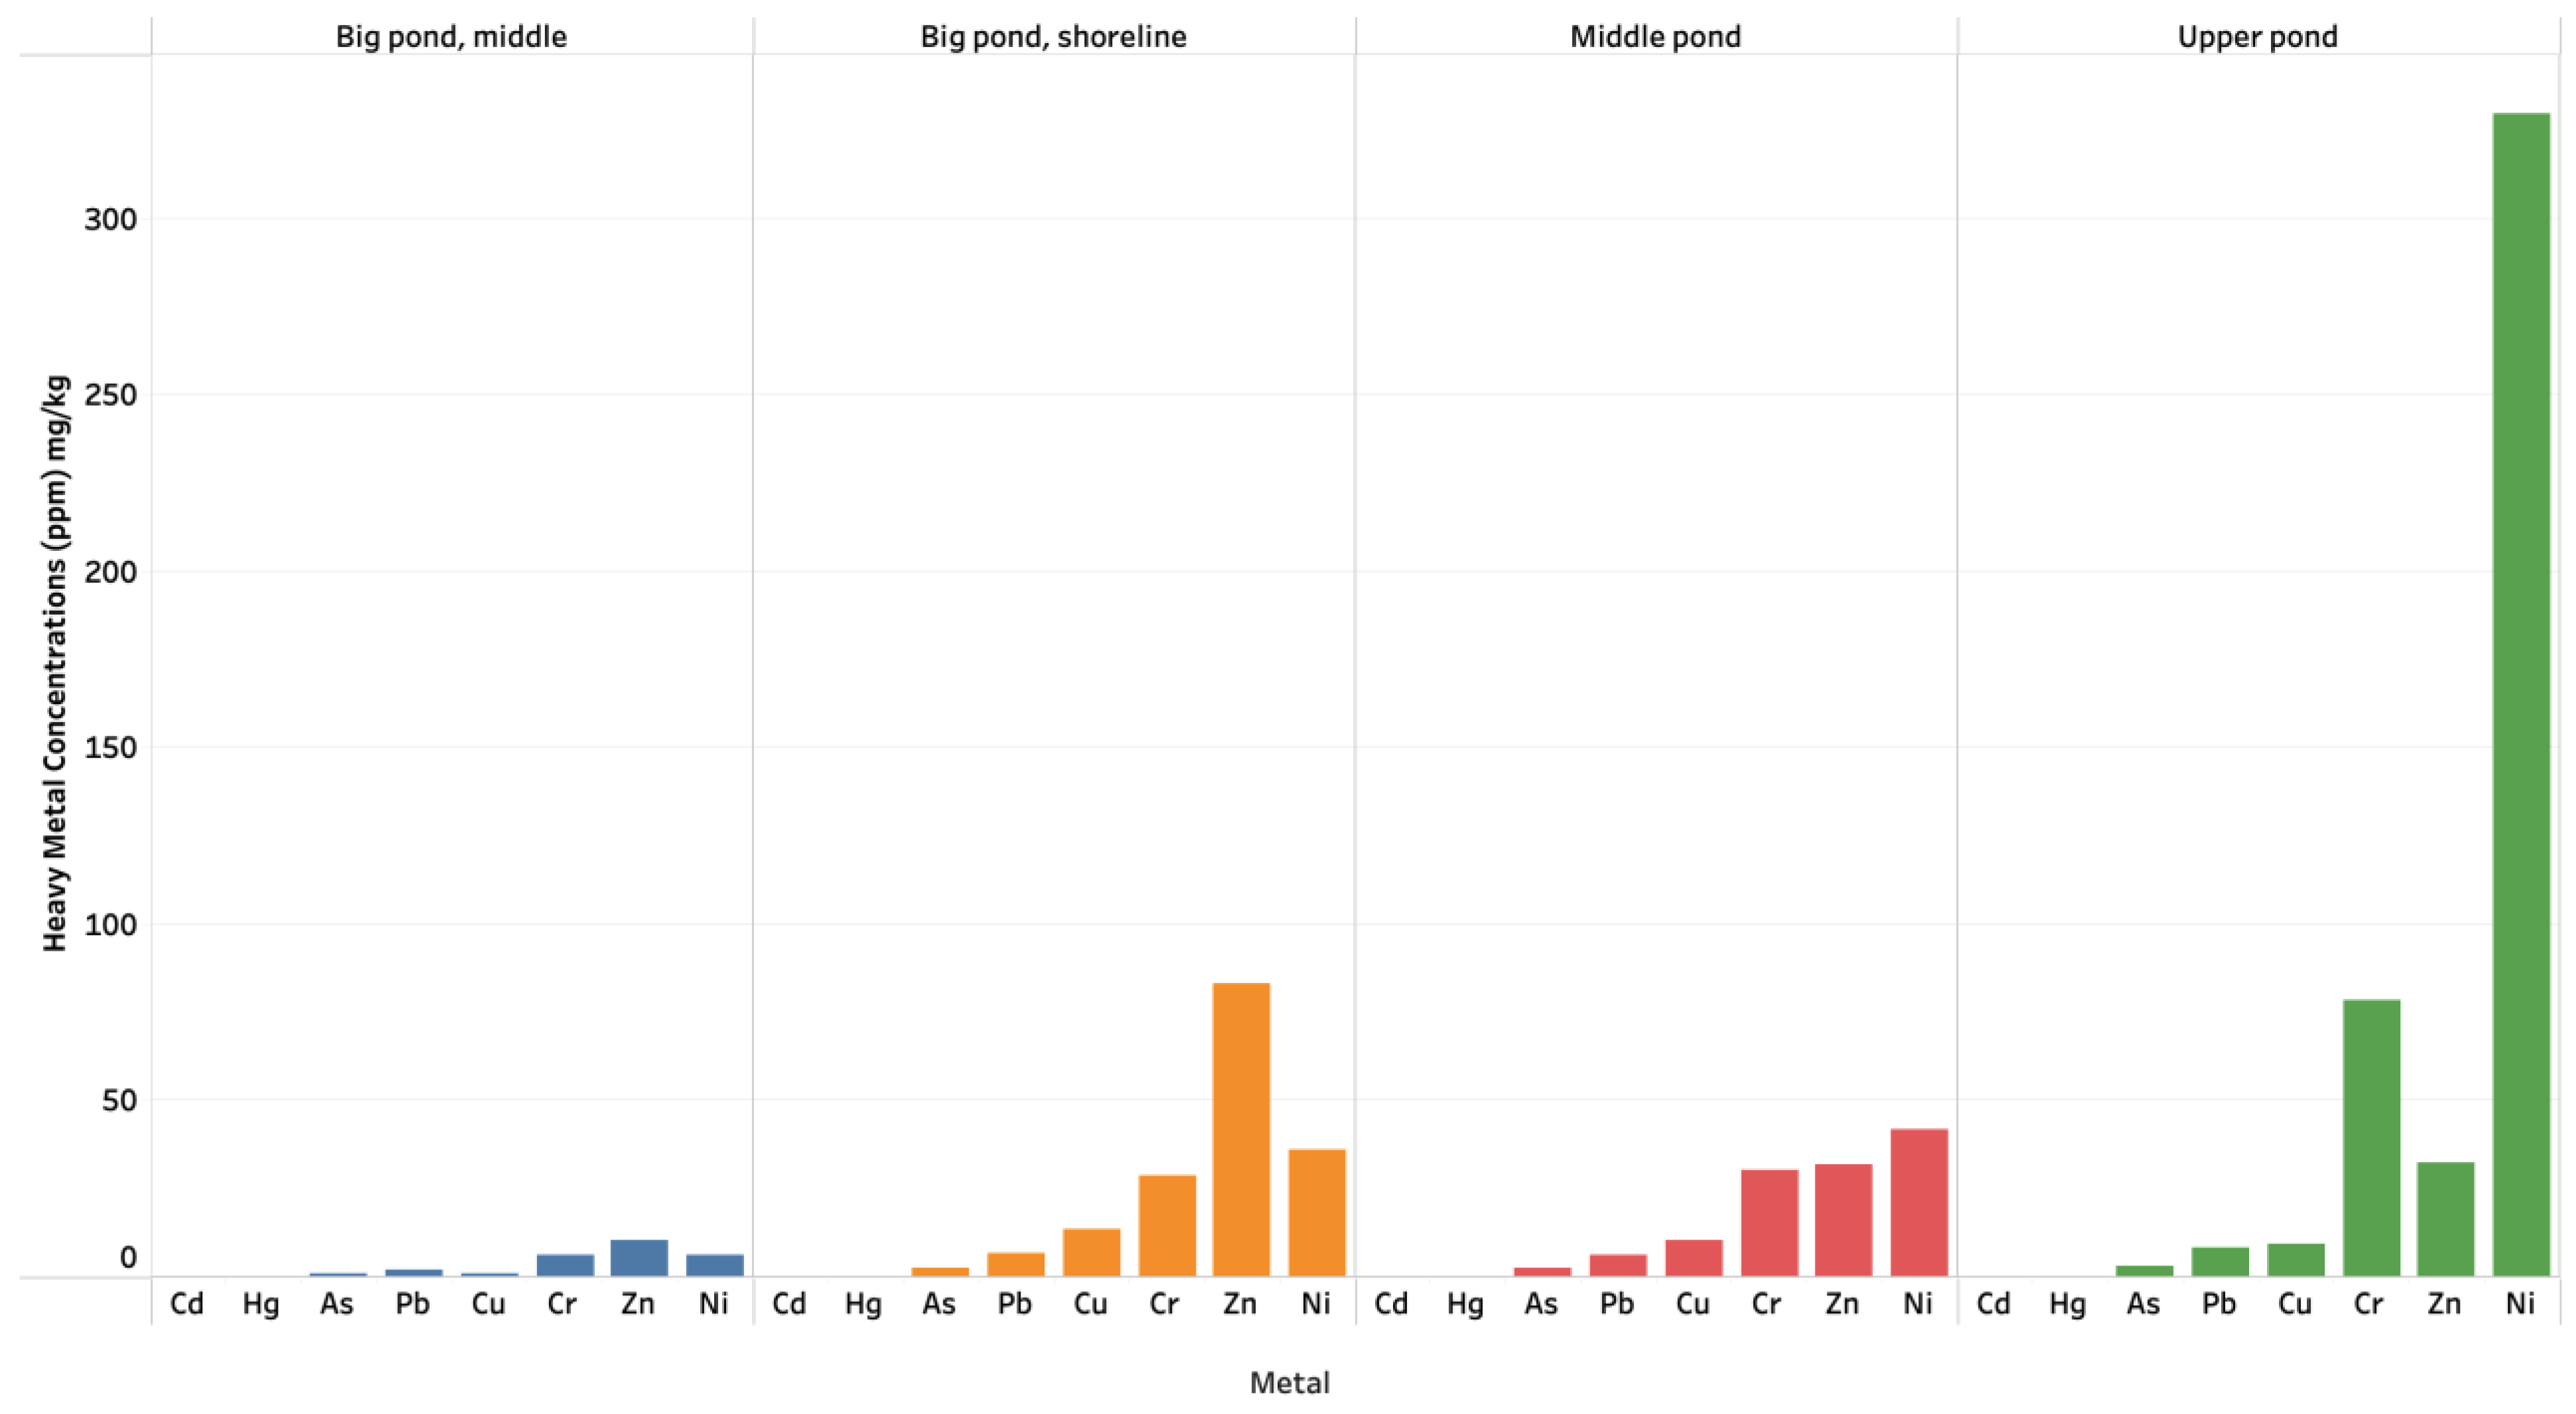
3.3. Heavy Metal Results

Heavy metals analyzed in sediment samples are shown in Table 4. Cadmium was analyzed but not detected, and therefore was not included in the table. The metals Al, As, Cr, Cu, Fe, Pb, Ni, Zn, and Hg, were all detected. Iron and aluminum were the highest concentrations in sediments, with an average of 5599.3 mg/kg and 3171.1 mg/kg, respectively. On the other hand, mercury and arsenic reported the lowest concentrations, with an average of 0.0 mg/kg and 2.4 mg/kg, respectively. Heavy metals, assessed in sediments, showed that, on average, iron and aluminum were found at the highest concentration in all sites.

4. Discussion

4.1. Water-Quality Parameters

A complete correlation matrix was constructed using the average concentrations obtained in this study (Figure 3). The results obtained showed that with an increase in water temperature, the evaporation levels increased, leading to the lowering in water levels and, therefore, higher salinity. According to the correlation matrix, the strongest positive correlation was observed between electrical conductivity and TDS. In addition, high positive correlations were detected for TDS and salinity, TDS and DO, TDS and COD, EC and salinity, and, lastly, DO and EC. Parameters such as TDS, salinity, and conductivity were all measured using the same meter and calculations are based on measured EC, hence they are directly correlated to one another. The matrix shown in Figure 3 evidenced the main correlations shown in the water body are few high-level relationships between parameters, with a few showing slight relationships due to the high variation over time and space within the environment.
Overall, the average salinity of the sampled sites ranged greatly and the results show that none of the areas sampled are considered freshwater. According to the wetlands classification system of the US [49], the Upper Pond, at 16–17 psu, would be considered mesohaline, Site 3 of the Middle Pond would be Eusaline, and Site 2 of the Middle Pond and the Big Pond would be considered Hypersaline. As there are no above-ground outflows other than evaporation, this suggests that freshwater is flowing into the system to the upper ponds and through to the big pond with increasing salinity due to evaporation. An inverse relationship was observed when measuring DO vs. temperature, as shown in Figure 4a. A correlation coefficient between both variables was calculated, and a value of −0.93 was obtained, indicative of a negative correlation. As temperature increased from an average of 27 °C for all sites on the first sampling (week 0) to 31 °C during the last sampling (week 8), the DO decreased from an average of 9 ppm to 6 ppm. The pH showed an inverse relationship with TDS, where TDS increases with decreasing water pH [50] (Figure 4b). Turbidity and ORP assessment showed a similar trend to salinity, TDS, and EC, where the lowest values were observed in the upper pond and increased consistently as sampling was closer to the big pond.
A study assessing DO in the Gulf of Aqaba reported a DO of 6.3 ppm, similar to the same range of 6.89 as obtained in Wasit Wetland [51]. Another study assessed the pH, DO, and temperature of Wasit before its decree as a protected area. The study was conducted during September, October, and November of 2009 and found comparable concentrations as those obtained in the present study (February, March, and April) 2021 [28]. The pH in the present study averaged 8.23, compared to 8.29 previously reported. Additionally, DO and Temperature reported in this study were 6.89 mg/L and 29.31 °C, compared to the previously reported 6.55 mg/L and 31.26 °C, respectively. Hence, it shows that, on average, minimum changes were observed over 12 years.
Limited studies have reported the status of aquatic ecosystems in the region. A study in the Gulf of Aqaba concluded that the average temperature was 20 °C in the winter and 28 °C in the summer [52]. The average pH, on the other hand, was 8.26. Therefore, the average water temperature and pH in Wasit Wetland exceeds the ranges in the Gulf of Aqaba, possibly due to the shallow nature during the warming season, with air temperatures increasing from 27 °C to 33 °C. The increase in air temperature led to the rise in water temperature, which would have resulted in evaporation levels lowering water levels, thereby increasing salinity and TDS. The average salinity and turbidity in Wasit were 50.28 psu and 10.74 FNU, which are considerably higher than the turbidity found in southern Iraq’s river delta, the Shatt Al-Arab, which were reported between 0.61 FNU and 2.95 FNU [53]. A study reporting on the salinity in Dubai Creek, which is directly linked to the Arabian Gulf, presented an average between 37.37 and 47.09 psu, significantly lower than that reported in this study [54]. The TDS levels were 42,740 ppm in the Gulf of Aqaba, Jordan, which are much higher in to those reported in Wasit Wetland [52]. The TDS levels increased with the increase in temperature, suggesting that there is a link between these parameters. There was uniformity and a gradual increase in TDS levels as sampling approached the big pond suggesting underground water flowing from the mountains from the eastern region and water flowing westward and with the high evaporation rates, the TDS increases towards the big pond with time. As expected, a direct relationship was observed between electrical conductivity, salinity, and TDS (Figure 3).
In general, the higher the ORP levels, the faster the bacteria decompose dead tissue and pollutants, suggesting a healthier water body [51]. The ORP levels in this study varied during the last trip to negative values meaning that the water has antioxidant properties producing free radicals that can damage organisms living in the ecosystem [55]. The increase in electrical conductivity is also associated with the rise in temperature, and, consequently, salinity, which increases ion solubility leading to the more dissociations of salts and minerals that can conduct electricity [56]. The EC was recorded as 52,170 mV in the Gulf of Aqaba, less than that of Wasit surface area samples [52]. Fluctuations in the chloride concentrations among the sampling locations could be attributed to the variable influxes of freshwater and sub-surface tidal influence from the nearby Arabian Gulf [57]. In Wasit, the chloride levels are specifically high due to the hypersaline nature of the surface water. In contrast, in the Gulf of Aqaba Jordan [52], the average chloride concentration was lower at 24,326 ppm. Ammonia concentration was the highest in the upper pond, and increased gradually throughout the sampling period due to the decomposition of organic material and the discharge of ammonia by the biota found in the wetland [58]. The remaining sampling sites remained constant as ammonia concentrations did not change significantly.
COD levels dropped during the second sampling trip (week 2), suggesting a decreased level of soluble organic compounds due to the upwelling of nutrients. The emergence of algae growth on the water’s surface was noticeable on all the sampling locations [59]. An interesting observation in this wetland was an increase in the formation of bubbles on the surface of the sampling locations, indicating that the gas content has increased due to the process of fermentation of organic materials by anerobic bacteria leading water zones to be deprived of oxygen due to eutrophication [60]. For the upper pond, the COD levels were relatively low compared to the rest of the sampling sites and the middle pond and big ponds showed significantly higher COD concentrations. COD indicates the amount of oxygen consumed by both inorganic and organic chemicals in water, hence, COD increases due to decaying bacterial cells. As bacterial cells decompose, they release dissolved organic matter (DOC) that increases COD levels due to the increase in cell debris and a negative correlation between COD and bacterial growth in the wetland is obtained [61]. COD is also directly correlated to salinity [62]. According to a similar study, the Arzew-Algeria Gulf had an average of 1600 mg/L of COD which is also in the range of this current study [63]. A drastic change in nitrogen concentration was noted between weeks 2 and 4, due to the shifts that result from the eutrophication cycles as nitrogen changes in form from time to time depending on fertilization rates [64]. Constant hydrological changes occur throughout the seasons affecting the water bodies and the overall concentration of nitrogen in the wetland [65]. In the Arabian Gulf, a similar study found an average of 10.85 mg/L of total nitrogen, which most of the locations in this review surpass [66]. Phosphorus is a product of the natural decomposition of rocks and minerals and sedimentation, which supports the high phosphorus concentrations obtained at the big pond, the shoreline compared to the big pond, and the middle [67]. Furthermore, the run-off of soils containing fertilizers can carry phosphorus that is drained into the surface water, causing an increase in phosphorus concentrations [68]. However, there is no evidence of this at the sampling locations. High levels of phosphorus are also linked to accelerating eutrophication rates and algae bloom growth due to the increase in temperature [63].
While levels of ammonia were inversely proportional to the chloride concentration, nitrates and dissolved oxygen were directly proportional (Figure 5). A clear correlation was observed between COD and total phosphorous, during the sampling period. Both parameters changed similarly (Figure 5). A study in the Arabian Gulf observered a phosphorus concentration of 0.93 mg/L, which the current study does not exceed except in the middle and upper ponds during the third trip [66].

4.2. Bacteria Analysis

The Total Fecal Coliforms measured during weeks 0, 2, and 4 of the study in the wetland were on average 2282.5 and 107.8 MPN per 100 mL of surface water for total coliforms and E. coli, respectively. The total fecal coliforms were highest at the upper pond during all three sampling dates meaning there was a source of coliforms close to the first sampling site leading to the high estimate of coliforms in the surface water (Figure 6). Both total coliforms and E. coli decreased from upper to lower ponds (Figure 5). This could be due to UV sensitivities of microbes [69], with sterilization of microbial community as water flows through the surface waters of the wetland. In the upper pond, the number of coliforms increased gradually from the first visit to the third. This observation may have been due to the rise in temperature and the increased humidity that can sustain microorganisms and allow them to colonize and grow faster [70]. The other ponds of the wetland remained constant for coliforms throughout the study. At more than 1000 MPN per 100 mL, all areas exceeded Coastal Wetlands Regulations from US EPA and Guiding Standards for Marine Water from MOCCAE [37,39]. As these waters are naturally hypersaline, the high levels suggest that there is microbial activity in the wetland that can survive extreme and harsh conditions. Several studies show natural microbial communities in hypersaline environments of inland waters [71,72,73]. In a comparative study performed at Bushehr coastal areas along the Arabian Gulf [74], the average amount of coliforms found was 1238.13 MPN/100 mL which is considerably lower than in the Wasit Wetland. Since E. coli was present in most of the sampling sites, there is enough evidence to conclude that there is a contamination source affecting the water quality of the wetland. The source of this contamination is unknown since E. coli can be found in endothermic animal intestines, water, and soil that this specific study has not investigated [75]. As a nature reserve, there are several mammal and bird species in the habitat around the ponds. For E. coli most of the locations were within the local standards set by MOCCAE for Marine Water, which is less than 200 MPN per 100 mL. The upper pond exceeded the standard with 345 E. coli MPN per 100 mL during Week 11 [37]. Compared to global standards of Coastal Wetlands Regulations, all surface area samples exceeded the 30–35 MPN per 100 mL water range [39] maximum value suggested by the EPA. The results of the current study in the Wasit Wetland were within the same range as the comparative study [74] discussed earlier, which had a total of 150.87 MPN per 100 mL of E. coli in the Arabian Gulf. Results of fecal coliforms and E. coli showed a direct correlation with time (Figure 5 and Figure 6).

4.3. Heavy Metals

Heavy and trace metals analyzed in Wasit followed the following trend Fe > Al > Ni > Zn > Cr > Cu > Pb > As > Hg > Cd. The total metal concentration reported increased as we moved from the big pond to the upper pond (Figure 7 and Table 5), coinciding with the facts that the pH levels recorded increased from the big pond to the upper bond, with the upper bong having the highest pH levels. A study completed by Zhang et al. (2018) investigated the leaching performance of heavy-metal-contaminated sediments at different pH levels [76]. The results showed that leaching contents of heavy metal from sediments was greater with higher pH values [76].

4.4. Water-Quality Index and Hazard Assessment

Both water-quality parameters were used in this paper for the average of each sample representing a site category. CCME WQI and WPI were used to evaluate the degree of pollution in the wetland water using 13 water-quality parameters (n = 13). According to the literature, a value of 0–44 for the CCME WQI indicates poor water quality or water that is almost always threatened. A value higher than 1 for the WPI indicates highly polluted water, as shown in Table 5.
It is important to note that the standards utilized in this study to calculate both water-quality indicators are taken from the regional marine water-quality guidelines provided by the United Arab Emirates Ministry of Climate Change and Environment [37] and Dubai Municipality standards [38], or from the Environmental Protection Agency (EPA) standards [39]. Due to the hypersaline nature of this wetland, it is difficult to assess the quality of the waters in comparison to others, as no indicators and standards have been published for similar ecosystems. Moreover, likely due to the high salinity level, only one species of fish is recorded, the aphanius dispar or Arabian Pupfish, which occurs in coastal zones, also found in oasis pools with hypersaline to fresh water.
The hazard quotient assessment shown in Table 6, indicates that As, Cr, Cu, Pb, Zn, Hg, and Cd are all considered to be safe and low risk to organisms. Ni was 1.08, indicating a low pollutant load; meanwhile, Fe reported a high value of 2239.72, indicating high risk. The results obtained in this study are consistent with those reported by Samara et al., 2020 (Table 6). Although the two sites are different, it does give an indication of the availability of iron in the region. That study also indicated that iron has the potential to precipitate in alkaline/oxidizing conditions making it less bioavailable [46].
Several studies have also used the water-quality approach to assess the status of similar wetlands. A study investigated the hydrological regime, water quality, and spatial distribution of the flora in the Songor Wetland in Ghana showing that the water quality was poor due to anthropogenic contamination of phosphate and silicate in the east and elevated levels of nitrate, ammonia, TDS, and sulphate in the West. The study reported a TDS of 41 g/L in one of the sites and an average of 7 g/L at a temperature of 28 °C for all locations. The values of TDS in the Wasit site was on average 35 g/L which is comparable to the highest value seen in Ghana. The DO in both studies was similar approximately 7 mg/L in both studies, the pH average was 7.32 in Ghana and 8.25 in UAE, and ammonia was lowest in Ghana 0.25 mg/L, compared to 0.60 mg/L. The study concluded that the main environmental factor affecting the wetland’s water quality’s spatial variance was salinity, which is a similar to what is observed in the present study [77]. A study by Medjani et al. (2021) suggests that the management of water resources in arid and hyperarid areas, which are especially susceptible to anthropogenic influences and natural geogenic processes, is of high importance due to the effects of the environmental conditions [78]. A study aimed at understanding the causes of low water quality in the Amirkalayeh Wetland, a Ramsar Convention-listed wetland of international importance revealing that the wetland had undergone hyper-eutrophication due to a three-fold increase in salinity and a substantial rise in nutrient levels. The study reported a pH on average of 7.77, EC of 2.05 mS/cm and chloride concentration of 285 mg/L. Although the study was concerned with the increased salinity, the levels are still much lower that the reported in the Wasit Wetland of 8.25, 70.2 mS/cm, and 29,830 mg/L, respectively. The research emphasized the necessity of preventing agricultural drainage from entering the wetland and enhancing sustainable water management practices to enhance the wetland’s water quality and safeguard its aquatic ecosystem and wildlife [79]. Shetaia et al. (2020) examined physicochemical parameters, nutrient and heavy-metal concentrations, and possible pollution sources at Egypt’s Edku lagoon. The results of the study revealed elevated concentrations of ammonia (1.5 mg/L) as compared to (0.60 mg/L in Wasit), and orthophosphate (0.389 mg/L) as compared to (0.50 mg/L in Wasit). According to the WQI and pollution indices, the lagoon’s water quality was deemed to be poor and heavily contaminated with heavy metals, as also reported in the present study, yet no comparison is possible as the present study reports heavy metals in sediments, rather than water [80].
Table 6. Average heavy metal concentrations per sampling locations categorizations.
Sampling LocationsHeavy Metals in Sediments
(mg/kg)
AlAsCrCuFePbNiZnHgCd
Upper Pond38402.978.79.213,7008.533032.60.2ND
Middle Pond49902.930.310.577256.441.831.80ND
Big pond, middle44152.954.59.910,712.57.4185.932.20.1ND
Big pond, shoreline5211.16.51.2590.31.96.210.40ND
Average3171.12.427.79.75599.35.654.152.30ND
Regional Parameter a--50250100--200--50025
Global Parameter b--ND25–7525–501.7–2.540–6020–5090–200ND6
Average this study 3171.12.427.79.75599.35.654.152.30ND
Hazard Quotient (HQ) 0.050.110.102239.720.031.080.1000
UAE Mangroves (Samara et al., 2021)12,683.02--17.311.991365.131.7635.6226.9--0.08
Hazard Quotient (HQ) 0.070.02546.050.010.710.05 0.02
Note(s): a [37,38], b [48].

4.5. Management of the Reserve

The Wasit Nature Reserve’s hydrological character results from a complex interaction between physical geography, passive, natural dynamics (mainly freshwater inflow, coastal groundwater and evaporation) and active, human-mediated intervention. Historical Landsat imagery available on Google Earth suggests that the wetland environment’s configuration and character have changed significantly between 1985 and 2020 (Figure 8).
Although it is probable that the wetland’s range in 1985 was already a reduction from the historical formation, this evidence is not available through the Google Earth platform. Extensive engineering projects from 1985 to 2020 have developed and industrialized the landscape so that the current nature reserve is, on the surface at least, distinctly constrained by hard linear infrastructure. Despite this apparent transformation, there are likely still historical hydrogeological and drainage basin dynamics strongly influencing observable water volumes at the nature reserve. Freshwater inflow to Wasit Nature Reserve from southerly and easterly sources was described by Samara et al., 2016. The influence of brackish coastal groundwater on the nature reserve’s current, observable water volume is not clearly understood. Dewatering includes groundwater extraction through a series of temporary wells and diesel pumps, lowering the localized water table to a levelwhere construction activities can be executed. The extracted water is often discharged into a nearby stormwater drainage network to flow to the ocean. The impact of these activities on the groundwater is significant and readily observable in surface water availability. The effect of these activities on the biochemical and ecological dynamics of the wetland system is unquantified. Figure 9a–c from Google Earth provides a snapshot visual record of dewatering’s impact, outside of the Wasit Nature Reserve delineation, on the Wasit Nature Reserve water volume.
Dewatering activities were initiated on industrial-zoned land (previously within the Al Ramtha Lagoon configuration), immediately north of Wasit Nature Reserve in November 2017 (Figure 9a). After seven months of dewatering within 1 km of Wasit Nature Reserve, although a natural, annual cyclic lowering of water level is anticipated during this period in a year, as a result of rainfall predominantly falling in mid-winter in May 2018, this effect was exaggerated by ongoing dewatering in the industrial zone immediately north of the Wasit Nature Reserve. Dewatering in the industrial zone adjacent to the Wasit Nature Reserve for nine months almost eliminated all surface water within the wetland (Figure 9b). The cessation of dewatering activities near the Wasit Nature Reserve (despite the absence of rainfall within any relevant catchment basin areas) in July 2018 resulted in a significant increase in surface water volume within the nature reserve. The initiation of wide-scale dewatering activities in the Wasit suburb, south of the Wasit Nature Reserve, in July 2019, for sewage infrastructure construction, quickly depleted the available surface water within the wetland. In response to this observation and following discharge water-quality testing, the EPAA of Sharjah instructed that extracted water be diverted into the south-western reed bed of the wetland (rather than into the stormwater drainage network). Surface water levels quickly returned to pre-dewatering levels and moderately exceeded these levels within three months of the initial instruction. Following 11 months of dewatering diversion into the Wasit Nature Reserve, surface water levels were at a volume likely higher than the mean surface water volume for that period of a year in the nature reserve (Figure 9c).
Wetlands worldwide are becoming more vulnerable due to climate change, yet they plan an important role in climate adaptation [81]. In the UAE in particular many wetlands, have been irretrievably lost, affecting the country’s biodiversity [82]. It has been reported that biomonitoring and good management of hypersaline wetlands with extreme aridity and salinity is essential, especially in dealing with irreversible changes due to human activity [83]. In the UAE, climate change is expected to increase temperatures and salinity [84]. In the UAE it has been determined that the most vulnerable ecosystems to climate change are water, coastal, marine, and dryland ecosystems, in addition to sectors such as building and infrastructure; agriculture and food security, and public health [85]. It is also suggested that the mangroves in the Arabian Gulf will be threatened by changes such as the decrease in rainfall due to climate change [86]. There is still limited data supporting the potential consequences of climate change on the UAE’s wetlands, making this study an important baseline for future studies. With careful planning and implementation of the best management practices for erosion and sediment control, the consequences of development on receiving water bodies can be minimized. A similar study suggested that sustainability management is possible for the restoration of hypersaline wetlands by assessing seasonal fluctuations of water quality parameters and their potential effects due to climate change [87].

5. Conclusions

Wasit Nature Reserve’s hydrological character results from a complex interaction between physical geography; passive, natural dynamics (mainly freshwater inflow, coastal groundwater, and evaporation); and active, human-mediated intervention. The current environmental status of a vulnerable wetland ecosystem in the United Arab Emirates was assessed for the first time in this research paper. Wasit is home to a wide range of species and organisms. It is extremely vulnerable to pollution, given the high level of human activity that surrounds the wetland, leading to the increased risk of water contamination. Compared to other regions and the standards set by regional and international organizations, most of the water-quality parameters demonstrated comparatively higher values. The only parameters that did not exceed the standards were temperature, pH, turbidity, DO, and ORP. Furthermore, the results of this study show that there are slightly elevated levels of certain heavy metals in the sediments. The surface distribution of the water-quality variable showed that location 1 was the only sampling site that varied from the rest. Compared to the analysis previously performed on the same site in 2009, the temperature decreased slightly, while the pH and DO did not change significantly. Water-quality indicators show that the area is considered highly polluted. These results also reflect the need for local parameters and standards that are specific to this type of ecosystems, and subsequently new indicator assessments for water quality in the region. In summary, the evaluation suggests that the Wasit Nature Reserve is still hypersaline and must retain its protected status. This study highlights the importance of monitoring protected areas and raising awareness among governments and the general public about the significance of wetland ecosystem conservation in the United Arab Emirates, especially with threats such as climate change.

Author Contributions

Conceptualization, F.S. and S.L.K.; methodology, T.A.A., F.Y., B.W.-J., S.L.K., S.M.A.A. and F.S.; software, B.W.-J. and B.K.; validation and formal analysis; T.A.A., F.Y., B.W.-J., S.L.K., S.M.A.A., B.K., N.A. and F.S.; investigation, T.A.A., F.Y., B.W.-J., S.L.K., S.M.A.A. and F.S.; resources, S.L.K., F.Y., B.W.-J., F.S. and S.M.A.A.; writing—original draft preparation, T.A.A. and F.S.; writing—review and editing, S.L.K., F.Y., B.W.-J., B.K. and N.A.; visualization, F.Y., B.W.-J., S.L.K. and F.S.; supervision, F.S. and S.L.K.; project administration, F.S.; funding acquisition, F.S. All authors have read and agreed to the published version of the manuscript.

Funding

This research was funded by the Undergraduate Research Grant URG21-033 and Faculty Research Grant FRG19-L-S51 (AS1703).

Institutional Review Board Statement

Not applicable.

Informed Consent Statement

Not applicable.

Data Availability Statement

The data presented in this study are available on request from the corresponding author. The data are not publicly available due to privacy issues.

Acknowledgments

The authors of this paper express their most sincere gratitude to His Highness Sheikh Sultan bin Mohammed Al Qasimi, Supreme Council Member and Ruler of Sharjah. We also acknowledge the support of her Excellency Hana Saif Al Suwaidi, chairperson of Sharjah Environment and Protected Areas Authority. Gratitude to Thouraya Ghalayini for all her technical support. Thanks to the American University of Sharjah (AUS) for funding this research through the Undergraduate Research Grant URG21-033 and Faculty Research Grant FRG19-L-S51 (AS1703). Our deepest appreciation to the University of Sharjah 2nd Forum for Women in Research (QUWA): Empowering Women in Research and Innovation for also partially supporting this work. The work in this paper was supported, in part, by the Open Access Program from the American University of Sharjah. This paper represents the opinions of the author(s) and does not mean to represent the position or opinions of the American University of Sharjah.

Conflicts of Interest

The authors declare no conflict of interest.

References

  1. Ramsar Convention on Wetland. The Introductory Ramsar Brochure, 3rd ed.; Ramsar Convention on Wetland: Gland, Switzerland, 2008. Available online: https://www.ramsar.org/about-the-convention-on-wetlands-0 (accessed on 1 May 2022).
  2. US EPA. What is a Wetland?|US EPA. Available online: https://www.epa.gov/wetlands/what-wetland (accessed on 15 March 2023).
  3. Dorche, E.E.; Fathi, P.; Ofogh, A.E. Wetland water quality assessment in cold and dry regions (Case study: Choghakhor wetland, Iran). Limnol. Rev. 2019, 19, 57–75. [Google Scholar] [CrossRef]
  4. Barot, C.; Patel, V. Comparative Study of Seasonal Variation in Physicochemical Properties of Selected Wetlands of Mehsana Districts, North Gujarat. Indian J. Appl. Res. 2011, 4, 44–47. [Google Scholar] [CrossRef]
  5. Wilcox, D.A.; Nichols, S.J. The effects of water-level fluctuations on vegetation in a Lake Huron wetland. Wetlands 2008, 28, 487–501. [Google Scholar] [CrossRef]
  6. Al-Obaid, S.; Samraoui, B.; Thomas, J.; El-Serehy, H.A.; Alfarhan, A.H.; Schneider, W.; O’connell, M. An overview of wetlands of Saudi Arabia: Values, threats, and perspectives. AMBIO 2016, 46, 98–108. [Google Scholar] [CrossRef] [PubMed]
  7. Abuzinada, A. The role of protected areas in conserving biological diversity in the kingdom of Saudi Arabia. J. Arid. Environ. 2003, 54, 39–45. [Google Scholar] [CrossRef]
  8. Umar, M.; Arshad, M.; Hussain, M.; Batool, M.; Malik, M.F. Assessment of Avifauna and Water Quality Parameters of Mangla Wetland, Azad Kashmir, Pakistan. Pak. J. Zool. 2021, 53, 809. [Google Scholar] [CrossRef]
  9. UNFCCC. Wetlands Disappearing Three Times Faster Than Forests. 2018. Available online: https://unfccc.int/news/wetlands-disappearing-three-times-faster-than-forests (accessed on 1 May 2022).
  10. Shiji, M.; Sabitha, A.R.; Prabhakar, K.; Harikumar, P.S. Water quality assessment of Kavvayi Lake of northern Kerala, India using CCME water quality index and biological water quality criteria. J. Environ. Biol. 2016, 37, 1265–1272. [Google Scholar]
  11. Saha, M.; Sarkar, A. Development of Molecular Identification of Nitrifying Bacteria in Water Bodies of East Kolkata Wetland, West Bengal. J. Bioremediation Biodegradation 2014, 5, 1000211. [Google Scholar] [CrossRef]
  12. U.S. Environmental Protection Agency (US EPA). Why are Wetlands Important: Wetlands and Nature? 2018. Available online: https://www.epa.gov/wetlands/why-are-wetlands-important (accessed on 1 May 2022).
  13. Dahl, T. Status and Trends of Wetlands in the Conterminous United States 2004 to 2009; U.S. Department of the Interior, Fish and Wildlife Service: Washington, DC, USA, 2011. Available online: http://www.fws.gov/wetlands/Status-And-Trends-2009/index.html (accessed on 1 May 2022).
  14. Davidson, N.C. How much wetland has the world lost? Long-term and recent trends in global wetland area. Mar. Freshw. Res. 2014, 65, 934–941. [Google Scholar] [CrossRef]
  15. Kükrer, S.; Mutlu, E. Assessment of surface water quality using water quality index and multivariate statistical analyses in Saraydüzü Dam Lake, Turkey. Environ. Monit. Assess. 2019, 191, 71. [Google Scholar] [CrossRef]
  16. Convention on Wetlands. Global Wetland Outlook: Special Edition 2021; Secretariat of the Convention on Wetlands: Gland, Switzerland, 2021. [Google Scholar]
  17. Gao, J.T.; Wang, X.Y.; Li, W.P.; Yu, L.H.; Yang, W.H.; Yin, Z.Y. Water quality assessment and analysis for rehabilitate and management of wetlands: A case study in Nanhai wetland of Baotou, China. MATEC Web Conf. 2016, 60, 2004. [Google Scholar] [CrossRef]
  18. Xu, T.; Weng, B.; Yan, D.; Wang, K.; Li, X.; Bi, W.; Li, M.; Cheng, X.; Liu, Y. Wetlands of International Importance: Status, Threats, and Future Protection. Int. J. Environ. Res. Public Health 2019, 16, 1818. [Google Scholar] [CrossRef]
  19. Haseena, M.; Malik, M.F.; Javed, A.; Arshad, S.; Asif, N.; Zulfiqar, S.; Hanif, J. Water pollution and human health. Environ. Risk Assess. Remediat. 2017, 1, 16–19. [Google Scholar] [CrossRef]
  20. Griffiths, J. Waterborne diseases. In International Encyclopedia of Public Health; Academic Press: Cambridge, MA, USA, 2017; pp. 338–401. [Google Scholar] [CrossRef]
  21. Alikhani, S.; Nummi, P.; Ojala, A. Urban Wetlands: A Review on Ecological and Cultural Values. Water 2021, 13, 3301. [Google Scholar] [CrossRef]
  22. Shahabudin, M.M.; Musa, S. Occurrence of Surface Water Contaminations: An Overview. IOP Conf. Ser. Earth Environ. Sci. 2018, 140, 012058. [Google Scholar] [CrossRef]
  23. Day, L. Follow-On Assessment of Phase 1 Wetlands and Initial Assessment of Phase 2 Wetlands with Recommendations for their Rehabilitation and Sustainable Management; The Freshwater Consulting Group: Cape Town, South Africa, 2006. [Google Scholar]
  24. Wagner, I.; Marsalek, J.; Breil, P. (Eds.) Aquatic Habitats in Sustainable Urban Water Management: Urban Water Series—UNESCO-IHP, 1st ed.; CRC Press: Boca Raton, FL, USA, 2007. [Google Scholar] [CrossRef]
  25. Ministry of Climate Change and Environment (MOCCAE). Status of Important Bird Areas in the UAE. 2018. Available online: https://www.moccae.gov.ae/en/reports-listing/28/4/2018/status-of-important-bird-areas-iba-in-the-uae-2018.aspx (accessed on 1 May 2022).
  26. Dennehy, J. Climate Change a Serious Threat to the Emirates Wetlands. The National. 2019. Available online: https://www.pressreader.com/uae/the-national-news/20190308/281655371383484 (accessed on 1 May 2022).
  27. Soorae, P.; Sakkir, S.; Saji, A.; Khan, S.B.; Al Zaabi, R.; Shah, J.N.; Ali, A.; Al Omari, K.; Al Dhaheri, A.; Javed, S.; et al. A Review of the Flora and Fauna in the Al Wathba Wetland Reserve in Abu Dhabi, United Arab Emirates. Wetlands 2019, 40, 1505–1512. [Google Scholar] [CrossRef]
  28. Samara, F.; Ali, T.; Twyford, J.; Knuteson, S. Investigation of fecal contamination of groundwater and surface water at al wasit nature reserve, Sharjah, United Arab Emirates. Asian J. Microbiol. Biotechnol. Environ. Sci. 2016, 18, 35–45. [Google Scholar]
  29. Shadrin, N. Hypersaline Lakes as the Polyextreme Habitats for Life. In Introduction to Salt Lake Sciences; Zheng, M., Deng, T., Oren, A., Eds.; Science Press: Beijing, China, 2018; pp. 180–187. [Google Scholar]
  30. Ragnvaldsson, D.; Herting, G.; Jönsson, A.; Odnevall, I. Applying Generic Water Quality Criteria to Cu and Zn in a Dynamic Aquatic Environment—The Case of the Brackish Water Formation Strömmen-Saltsjön. Water 2022, 14, 847. [Google Scholar] [CrossRef]
  31. Shadrin, N.; Anufriieva, E.; Latushkin, A.; Prazukin, A.; Yakovenko, V. Daily Rhythms and Oxygen Balance in the Hypersaline Lake Moynaki (Crimea). Water 2022, 14, 3753. [Google Scholar] [CrossRef]
  32. Anufriieva, E.; Kolesnikova, E.; Revkova, T.; Latushkin, A.; Shadrin, N. Human-Induced Sharp Salinity Changes in the World’s Largest Hypersaline Lagoon Bay Sivash (Crimea) and Their Effects on the Ecosystem. Water 2022, 14, 403. [Google Scholar] [CrossRef]
  33. Ramsar. Ramsar Information Sheet United Arab Emirates Wasit Nature Reserve. 2386. 2019. Available online: https://rsis.ramsar.org/ris/2386 (accessed on 1 May 2022).
  34. Mohammed, A.; Samara, F.; Alzaatreh, A.; Knuteson, S.L. Statistical Analysis for Water Quality Assessment: A Case Study of Al Wasit Nature Reserve. Water 2022, 14, 3121. [Google Scholar] [CrossRef]
  35. WWO, World Weather Online. United Kingdom. Available online: https://www.worldweatheronline.com/ (accessed on 1 May 2022).
  36. Saffran, K.; Cash, K.; Hallard, K. CCME Water Quality Index 1.0 User’s Manual. Canadian Water Quality Guidelines for the Protection of Aquatic Life; Canadian Council of Ministers of the Environment: Winnipeg, MB, Canada, 2001; pp. 1–5. [Google Scholar]
  37. Ministry of Climate Change and Environment (MOCCAE). Guiding Standards for Marine Water Properties in the United Arab Emirates. Ministry of Climate Change and Environment. 2020. Available online: https://www.moccae.gov.ae/assets/download/d6b99426/brand_%D8%A7%D9%84%D9%85%D8%B9%D8%A7%D9%8A%D9%8A%D8%B1%20%D8%A7%D9%84%D8%A7%D8%B3%D8%AA%D8%B1%D8%B4%D8%A7%D8%AF%D9%8A%D8%A9%20%D9%84%D8%AE%D9%88%D8%A7%D8%B5%20%D8%A7%D9%84%D9%85%D9%8A%D8%A7%D9%87%20%D8%A7%D9%84%D8%A8%D8%AD%D8%B1%D9%8A%D8%A9_En[2].pdf.aspx (accessed on 1 May 2022).
  38. Dubai Municipality. Environmental Standards and Allowable Limits of Pollutants on land, Water and Air Environment. In Information Bulleting, Dubai Municipality; Environment Protection & Safety Section: Dubai, United Arab Emirates, 2003. [Google Scholar]
  39. U.S. Environmental Protection Agency (US EPA). Parameters of Water Quality: Interpretation and Standards; Environmental Protection Agency: Washington, DC, USA, 2001. Available online: https://www.epa.ie/pubs/advice/water/quality/Water_Quality (accessed on 1 May 2022).
  40. Zamdayu, W.J.; Abdulkadir, S.A. Evaluating Water Quality of Lower River Gongola for Irrigation. Int. J. Adv. Eng. Manag. 2021, 3, 1330–1334. [Google Scholar] [CrossRef]
  41. Katyal, D. Water Quality Indices Used for Surface Water Vulnerability Assessment by Deeksha Katyal: SSRN. Int. J. Environ. Sci. 2011, 2, 154–173. Available online: https://papers.ssrn.com/sol3/papers.cfm?abstract_id=2160726 (accessed on 20 December 2022).
  42. Hossain, M.; Patra, P.K. Water pollution index—A new integrated approach to rank water quality. Ecol. Indic. 2020, 117, 106668. [Google Scholar] [CrossRef]
  43. Horton, R.K. An index number system for rating water quality. J. Water Pollut. Control Fed. 1965, 37, 300–306. [Google Scholar]
  44. ISO 11466:1995; Soil Quality—Extraction of Trace Elements Soluble in Aqua Regia. (n.d.). ISO: Geneva, Switzerland, 1995. Available online: https://www.iso.org/standard/19418.html (accessed on 17 March 2023).
  45. Telliard, W.A. Method 245.7 Mercury in Water by Cold Vapor Atomic Fluorescence Spectrometry, Revision 2.0.; U.S. Environmental Protection Agency: Washington, DC, USA, 2005.
  46. Samara, F.; Solovieva, N.; Ghalayini, T.; Nasrallah, Z.A.; Saburova, M. Assessment of the Environmental Status of the Mangrove Ecosystem in the United Arab Emirates. Water 2020, 12, 1623. [Google Scholar] [CrossRef]
  47. Nabelkova, J.; Kominkova, D. Trace metals in the bed sediment of small urban streams. Open Environ. Biol. Monit. J. 2012, 5, 48–55. [Google Scholar] [CrossRef]
  48. U.S. Environmental Protection Agency (US EPA). Guidelines for the Pollution Classification of Great Lakes Harbor Sediments; U.S. Environmental Protection Agency (US EPA): Washington, DC, USA, 1977.
  49. Cowardin, L.M.; Carter, V.; Golet, F.C.; LaRoe, E.T. Classification of Wetlands and Deep-Water Habitats of the United States; U.S. Department of the Interior, Fish and Wildlife Service: Washington, DC, USA; Northern Prairie Wildlife Research Center Online: Jamestown, ND, USA, 1979. Available online: http://www.npwrc.usgs.gov/resource/wetlands/classwet/index.htm (accessed on 29 January 2022).
  50. Naji, T.A.; Al-Jasim, A.A.N.; Shaban, A.H.; Abduljabbar, H.M. Spatial Analyzing of the Chemical Soil Properties for the Sanam Mountain-Al Zubair Region South of Basra Province and Diagnosis of its Effects on Soil Qualities Using Remote Sensing Technology and GIS. In Materials Science Forum; Trans Tech Publications Ltd.: Bäch, Switzerland, 2022; Volume 1050, pp. 173–187. [Google Scholar]
  51. Al-Taani, A.A.; Batayneh, A.; Nazzal, Y.; Ghrefat, H.; Elawadi, E.; Zaman, H. Status of trace metals in surface seawater of the Gulf of Aqaba, Saudi Arabia. Mar. Pollut. Bull. 2014, 86, 582–590. [Google Scholar] [CrossRef]
  52. Al-Taani, A.A.; Rashdan, M.; Nazzal, Y.; Howari, F.; Iqbal, J.; Al-Rawabdeh, A.; Al Bsoul, A.; Khashashneh, S. Evaluation of the Gulf of Aqaba Coastal Water, Jordan. Water 2020, 12, 2125. [Google Scholar] [CrossRef]
  53. Lateef, Z.Q.; Al-Madhhachi, A.-S.T.; Sachit, D.E. Evaluation of Water Quality Parameters in Shatt AL-Arab, Southern Iraq, Using Spatial Analysis. Hydrology 2020, 7, 79. [Google Scholar] [CrossRef]
  54. Shriadah, M. Water quality of two semi-closed areas in the United Arab Emirates coast along the Arabian Gulf: A comparative study. Pak. J. Mar. Sci. 2002, 11, 19–26. [Google Scholar]
  55. Kremer, M. Water Quality 101: What is ORP in Water Testing? Jenco. 2018. Available online: https://blog.jencoi.com/what-is-orp-in-water-testing (accessed on 1 July 2022).
  56. Reineke, W.; Schlömann, M. Heavy Metals and Other Toxic Inorganic Ions. In Environmental Microbiology; Springer: Berlin/Heidelberg, Germany, 2023; pp. 331–348. [Google Scholar] [CrossRef]
  57. Saha, A.; Paul, T.T.; Sudheesan, D.; Sharma, S.K.; Suresh, V.R.; Das, B.K.; Manoharan, S.; Vijaykumar, M.E.; Samanta, S.; Jana, C. Assessment of Spatial and Temporal Changes in Water Quality of a Tropical River in Southern Western Ghats, Kerala, India, Using Physicochemical Quality Indices and Multivariate Analysis. Nat. Resour. Res. 2022, 31, 1375–1401. [Google Scholar] [CrossRef]
  58. Bano, H.; Rather, R.A.; Malik, S.; Bhat, M.A.; Khan, A.H.; Américo-Pinheiro, J.H.P.; Mir, I.A. Effect of Seasonal Variation on Pollution Load of Water of Hokersar Wetland: A Case Study of Queen Wetland of Kashmir, J&K, India. Water Air Soil Pollut. 2022, 233, 518. [Google Scholar] [CrossRef]
  59. Smith, R. Chemical OXYGEN Demand in Influent Wastewater Monitoring. YSI. 2017. Available online: https://www.ysi.com/ysi-blog/water-blogged-blog/2017/01/chemical-oxygen-demand-in-influent-wastewater-monitoring (accessed on 20 December 2022).
  60. Herlina, N.; Lubis, M.T.; Husin, A.; Putri, I. Studies on decreasing Chemical Oxygen Demand (COD) on artificial laundry wastewater using anaerobic-aerobic biofilter dipped with bio ball media. MATEC Web Conf. 2019, 276, 06015. [Google Scholar] [CrossRef]
  61. Islam, M.; Shafi, S.; Bandh, S.A.; Shameem, N. Impact of environmental changes and human activities on bacterial diversity of lakes. In Freshwater Microbiology; Academic Press: Cambridge, MA, USA, 2019; pp. 105–136. [Google Scholar]
  62. Li, Z.; Sheng, Y.; Shi, W.; Sun, Q.; Mortimer, R.J. Influence of salinity on COD measurements in coastal water management. Desalination Water Treat. 2015, 57, 18338–18345. [Google Scholar] [CrossRef]
  63. Redouane, F.; Mourad, L. Determination of the Sea Waters Quality of Arzew-Algeria Gulf. J. Pollut. Eff. Cont. 2017, 5, 188. [Google Scholar] [CrossRef]
  64. Voss, M.; Bange, H.W.; Dippner, J.W.; Middelburg, J.; Montoya, J.; Ward, B. The marine nitrogen cycle: Recent discoveries, uncertainties and the potential relevance of climate change. Philos. Trans. R. Soc. B Biol. Sci. 2013, 368, 20130121. [Google Scholar] [CrossRef]
  65. Lu, J.; Bunn, S.E.; Burford, M.A. Effects of water level fluctuations on nitrogen dynamics in littoral macrophytes. Limnol. Oceanogr. 2017, 63, 833–845. [Google Scholar] [CrossRef]
  66. Shriadah, M. Nutrient salts in the United Arab Emirates waters (the Arabian Gulf and the Gulf of Oman). Pak. J. Mar. Sci. 2006, 15, 1–9. Available online: https://core.ac.uk/download/pdf/33722074.pdf (accessed on 25 August 2022).
  67. Fadiran, A.; Dlamini, S.; Mavuso, A. A comparative study of the phosphate levels in some surface and ground water bodies of Swaziland. Chem. Soc. Ethiop. 2008, 22, 197–206. [Google Scholar]
  68. Stefan, D.S.; Simina, D. Water Stress Induced by Enrichment of Nutrient and Climate Change Factors. In Water Stress in Plants; IntechOpen: London, UK, 2016. [Google Scholar]
  69. Urmeneta, J.; Gascón, J.; Oubiña, A.; Pérez-Lezaun, A. Sensitivity of selected bacterial species to UV radiation. Curr. Microbiol. 1995, 30, 177–182. [Google Scholar] [CrossRef]
  70. Dang, H.; Lovell, C.R. Microbial Surface Colonization and Biofilm Development in Marine Environments. Microbiol. Mol. Biol. Rev. 2016, 80, 91–138. [Google Scholar] [CrossRef]
  71. Saccò, M.; White, N.E.; Harrod, C.; Salazar, G.; Aguilar, P.; Cubillos, C.F.; Meredith, K.; Baxter, B.K.; Oren, A.; Anufriieva, E.; et al. Salt to conserve: A review on the ecology and preservation of hypersaline ecosystems. Biol. Rev. 2021, 96, 2828–2850. [Google Scholar] [CrossRef] [PubMed]
  72. Shadrin, N.; Anufriieva, E.; Gajardo, G. Ecosystems of Inland Saline Waters in the World of Change. Water 2023, 15, 52. [Google Scholar] [CrossRef]
  73. Layalestani, S.S.S.; Shavandi, M.; Haddadi, A.; Amoozegar, M.A.; Dastgheib, S.M.M. Bacterial community structure in saline sediments from hypersaline wetland in south of Halghe Dare hills, Alborz province. J. Microb. World 2020, 13, 215–227. [Google Scholar]
  74. Karbasdehi, V.N.; Dobaradaran, S.; Nabipour, I.; Ostovar, A.; Arfaeinia, H.; Vazirizadeh, A.; Mirahmadi, R.; Keshtkar, M.; Ghasemi, F.F.; Khalifei, F. Indicator bacteria community in seawater and coastal sediment: The Persian Gulf as a case. J. Environ. Heal. Sci. Eng. 2017, 15, 6. [Google Scholar] [CrossRef]
  75. Lim, J.; Yoon, J.; Hovde, C. A brief overview of Escherichia Coli and its plasmid. J. Microbiol. Biotechnol. 2010, 20, 5–14. [Google Scholar] [CrossRef]
  76. Zhang, Y.; Zhang, H.; Zhang, Z.; Liu, C.; Sun, C.; Zhang, W.; Marhaba, T. pH Effect on Heavy Metal Release from a Polluted Sediment. J. Chem. 2018, 2018, 7597640. [Google Scholar] [CrossRef]
  77. Klubi, E.; Samuel, A.; Akita, L. Assessment of hydrological pathway and water quality of the Songor wetland, Ghana. J. Environ. Sci. Technol. 2019, 13, 511–523. [Google Scholar] [CrossRef]
  78. Medjani, F.; Djidel, M.; Labar, S.; Bouchagoura, L.; Bara, C.R. Groundwater physico-chemical properties and water quality changes in shallow aquifers in arid saline wetlands, Ouargla, Algeria. Appl. Water Sci. 2021, 11, 82. [Google Scholar] [CrossRef]
  79. Rahimi, M.; Zarei, M.; Keshavarzi, B.; Golshani, R.; Zafarani, S.G.G. Water quality stress to Amirkalayeh Wetland, Northern Iran. Environ. Monit. Assess. 2023, 195, 49. [Google Scholar] [CrossRef]
  80. Shetaia, S.A.; Abu Khatita, A.M.; Abdelhafez, N.A.; Shaker, I.M.; El Kafrawy, S.B. Evaluation of Potential Health Risk, Heavy Metal Pollution Indices and Water Quality of Edku Lagoon-Egypt. Egypt. J. Aquat. Biol. Fish. 2020, 24, 265–290. [Google Scholar] [CrossRef]
  81. Zhang, Y.; Cao, B.; Zhang, Q.; Cui, S.; Cui, B.; Du, J. Responses of Urban Wetland to Climate Change and Human Activities in Beijing: A Case Study of Hanshiqiao Wetland. Sustainability 2022, 14, 4530. [Google Scholar] [CrossRef]
  82. The UAE’s Wetlands Are a National Treasure that Deserve Our Care and Protection (n.d.). Available online: https://www.thenationalnews.com/opinion/comment/the-uae-s-wetlands-are-a-national-treasure-that-deserve-our-care-and-protection-1.785600 (accessed on 17 March 2023).
  83. Bourhane, Z.; Cagnon, C.; Castañeda, C.; Rodríguez-Ochoa, R.; Álvaro-Fuentes, J.; Cravo-Laureau, C.; Duran, R. Vertical organization of microbial communities in Salineta hypersaline wetland, Spain. Front. Microbiol. 2023, 14, 869907. [Google Scholar] [CrossRef]
  84. Fawzi, M.; Mfarrej, B. Climate Change Patterns in the UAE: A Qualitative Research and Review. Nat. Environ. Pollut. Technol. Int. Q. Sci. J. 2019, 18, 261–268. [Google Scholar]
  85. Ministry of Climate Change and Environment (MOCCAE). National Climate Change Plan of the United Arab Emirates 2017–2050; Ministry of Climate Change and Environment: Dubai, United Arab Emirates, 2017; pp. 22–48.
  86. Assaf, H.; Idwan, S.; Jallad, A.H.; Ammari, M.Z.J.; Al Chaar, A.; Kouja, M. Public values regarding an urban mangrove wetland in the united arab emirates. J. Environ. Eng. Landsc. Manag. 2022, 30, 114–123. [Google Scholar] [CrossRef]
  87. Rudneva, I.I.; Gaisky, P.V.; Shaida, V.G.; Shaida, O.V. Assessing Climate and Human Activity Effects on Hypersaline Lake Ecosystem: Case Study of Saki Lake, Crimea. Water 2023, 15, 456. [Google Scholar] [CrossRef]
Figure 1. Map of sampling locations for surface water at the Wasit Nature Reserve.
Water 15 01766 g001
Figure 2. Timeseries including pH, EC, ORP, DO, and turbidity of surface water of the Wasit Nature Reserve in Sharjah, UAE, weeks 0, 2, 4, 6, and 8 represent the biweekly sampling between February to April 2021.
Water 15 01766 g002
Figure 3. Correlation matrix including all average water quality physical parameters as well as bacteria in Wasit Nature Reserve in Sharjah, UAE.
Water 15 01766 g003
Figure 4. Correlation between (a) Bar chart of the variation of DO and temperature with time (b) pH and TDS in Wasit Nature Reserve, Sharjah.
Water 15 01766 g004
Figure 5. Correlations between selected surface water of the Wasit Nature Reserve in Sharjah, UAE, during weeks 0, 2, and 4 biweekly sampling between February and March 2021.
Water 15 01766 g005
Figure 6. Total Coliforms in surface water of the Wasit Wetland in Sharjah, UAE, between sampling locations during weeks 0, 2, and 4 of the study.
Water 15 01766 g006
Figure 7. Total selected heavy metals measured in sediments of the Wasit Wetland in Sharjah, UAE, between sampling locations.
Water 15 01766 g007
Figure 8. Al Ramtha 1985 (left) and Wasit Nature Reserve 2020 (right).
Water 15 01766 g008
Figure 9. Dewatering activities initiated in (a) November 2017, (b) July 2018, and (c) July 2020.
Water 15 01766 g009
Table 1. Sampling Locations Categorizations for this study.
Sampling LocationsSite Category
Loc 1A, 1B, 1CUpper Pond
Loc 2, 3A, 3BMiddle Pond
Loc 8, 9, 10Big pond, middle
Loc 4, 5, 6, 7, 11, 12Big pond, shoreline
Table 2. Average of surface water quality and descriptive statistics at Wasit Wetland, Sharjah over the 5 sampling periods.
Sampling CategoriesTemppHTurbidityTDSORPD.O.ECSalinityChlorideNitratesAmmoniaCODTotal NitrogenTotal Phosphorous
(°C) (FNU)(ppm)(mV)(ppm)(µS/cm)(psu)(ppm)(ppm)(ppm)(mg/L)(mg/L)(mg/L)
Upper Pond28.338.424.3714,076.6715.038.4128,144.6717.1212,642.0050.701.8068.009.900.20
Middle Pond31.178.2510.8036,009.0017.307.0272,601.0042.8533,990.0057.100.401216.0029.900.70
Big pond, middle28.758.1811.1746,446.0054.076.4492,997.3364.7837,244.0057.200.201412.0021.000.70
Big pond, shoreline29.148.1413.6844,031.5045.256.3088,205.8363.3235,442.0057.600.201578.0019.600.70
Max31.178.4213.6846,446.0054.078.4192,997.3364.7837,244.0057.601.801578.0029.900.70
Min28.338.144.3714,076.6715.036.3028,144.6717.1212,642.0050.700.2068.009.900.20
Average29.358.2510.0035,140.7932.917.0470,487.2147.0229,830.0055.700.601068.0020.100.50
Stdev1.260.123.9714,734.3519.690.9729,541.0122.3111,535.003.300.80683.008.200.20
Regional Permissible Limit a19–236.0–9.0<75<20,000-<5<2000<45<250<50<0.06<40<2<0.05
Global Permissible Limit b15–356.5–8.5<75<50,000300–500<5<1000<40<250<50<0.041.2–30.2<0.3<0.3
Note(s): a [37,38], b [39].
Table 3. Total number of Coliforms and E. coli found in 100 mL of surface water during three sampling trips.
Site CategorySampling LocationTotal Coliforms (MPN/100 mL)E. coli
(MPN/100 mL)
week 0week 2week 4week 0week 2week 4
Upper pond1A3690913913,786<100345170
Upper pond1B2530689311,496200122362
Upper pond1C108079155190100233168
Middle pond2200419<100<100230<100
Middle pond3A520695556<10062<100
Middle pond3B-368462-6320
Big pond, middle8<1001014618<10098126
Big pond, middle9<100479456<10052104
Big pond, middle10<100860758<100181192
Big pond, shoreline4<10028511366<10020682
Big pond, shoreline5<1001467944<10098146
Big pond, shoreline6<10041601248<100169262
Big pond, shoreline7<10022821226<100145170
Big pond, shoreline11<10034412666<100108124
Big pond, shoreline1210019041714100301194
Average 135329253034133161163
Acceptable Regional
Parameter a
<1000 <200
Acceptable Global
Parameter b
<1000 30–35
Note(s): a [37,38], b [39].
Table 4. Heavy metal concentrations in sediments of 12 locations at the Wasit Wetland.
Sampling LocationsHeavy Metals in Sediments
(mg/kg)
AlAsCrCuFePbNiZnHg
Loc 13840.02.978.79.213,700.08.5330.032.60.2
Loc 25480.02.929.613.07870.07.053.939.10.0
Loc 34500.02.831.08.07580.05.729.724.50.0
Loc 43740.02.222.05.15220.03.239.019.70.0
Loc 53800.03.621.95.95690.02.838.015.10.0
Loc 63090.01.018.35.63330.03.026.033.30.0
Loc 74340.02.428.713.45750.08.242.5218.00.0
Loc 8443.01.85.70.0537.02.06.08.70.0
Loc 9404.01.55.40.0437.01.84.88.20.0
Loc 10716.00.08.53.7797.01.87.914.40.0
Loc 114010.03.028.77.95880.04.023.852.80.0
Loc 123690.04.453.344.510,400.019.548.1161.00.0
Max5480.04.478.744.513,700.019.5330.0218.00.2
Min404.00.05.40.0437.01.84.88.20.0
Average3171.12.427.79.75599.35.654.152.30.0
Stdev1698.61.220.811.74028.25.088.466.50.1
Table 5. Water-quality calculations.
Sampling LocationsSite CategoryCCME WQICategoryWPICategory
Loc 1A, 1B, 1CUpper Pond19Poor8Highly Polluted
Loc 2, 3A, 3BMiddle Pond26Poor16Highly Polluted
Loc 8, 9, 10Big pond, middle26Poor18Highly Polluted
Loc 4, 5, 6, 7, 11, 12Big pond, shoreline21Poor18Highly Polluted
Disclaimer/Publisher’s Note: The statements, opinions and data contained in all publications are solely those of the individual author(s) and contributor(s) and not of MDPI and/or the editor(s). MDPI and/or the editor(s) disclaim responsibility for any injury to people or property resulting from any ideas, methods, instructions or products referred to in the content.

