

The Assessment of the Groundwater Quality in the Coastal Aquifers of the Essaouira Basin, Southwestern Morocco, Using Hydrogeochemistry and Isotopic Signatures

Abstract
:1. Introduction
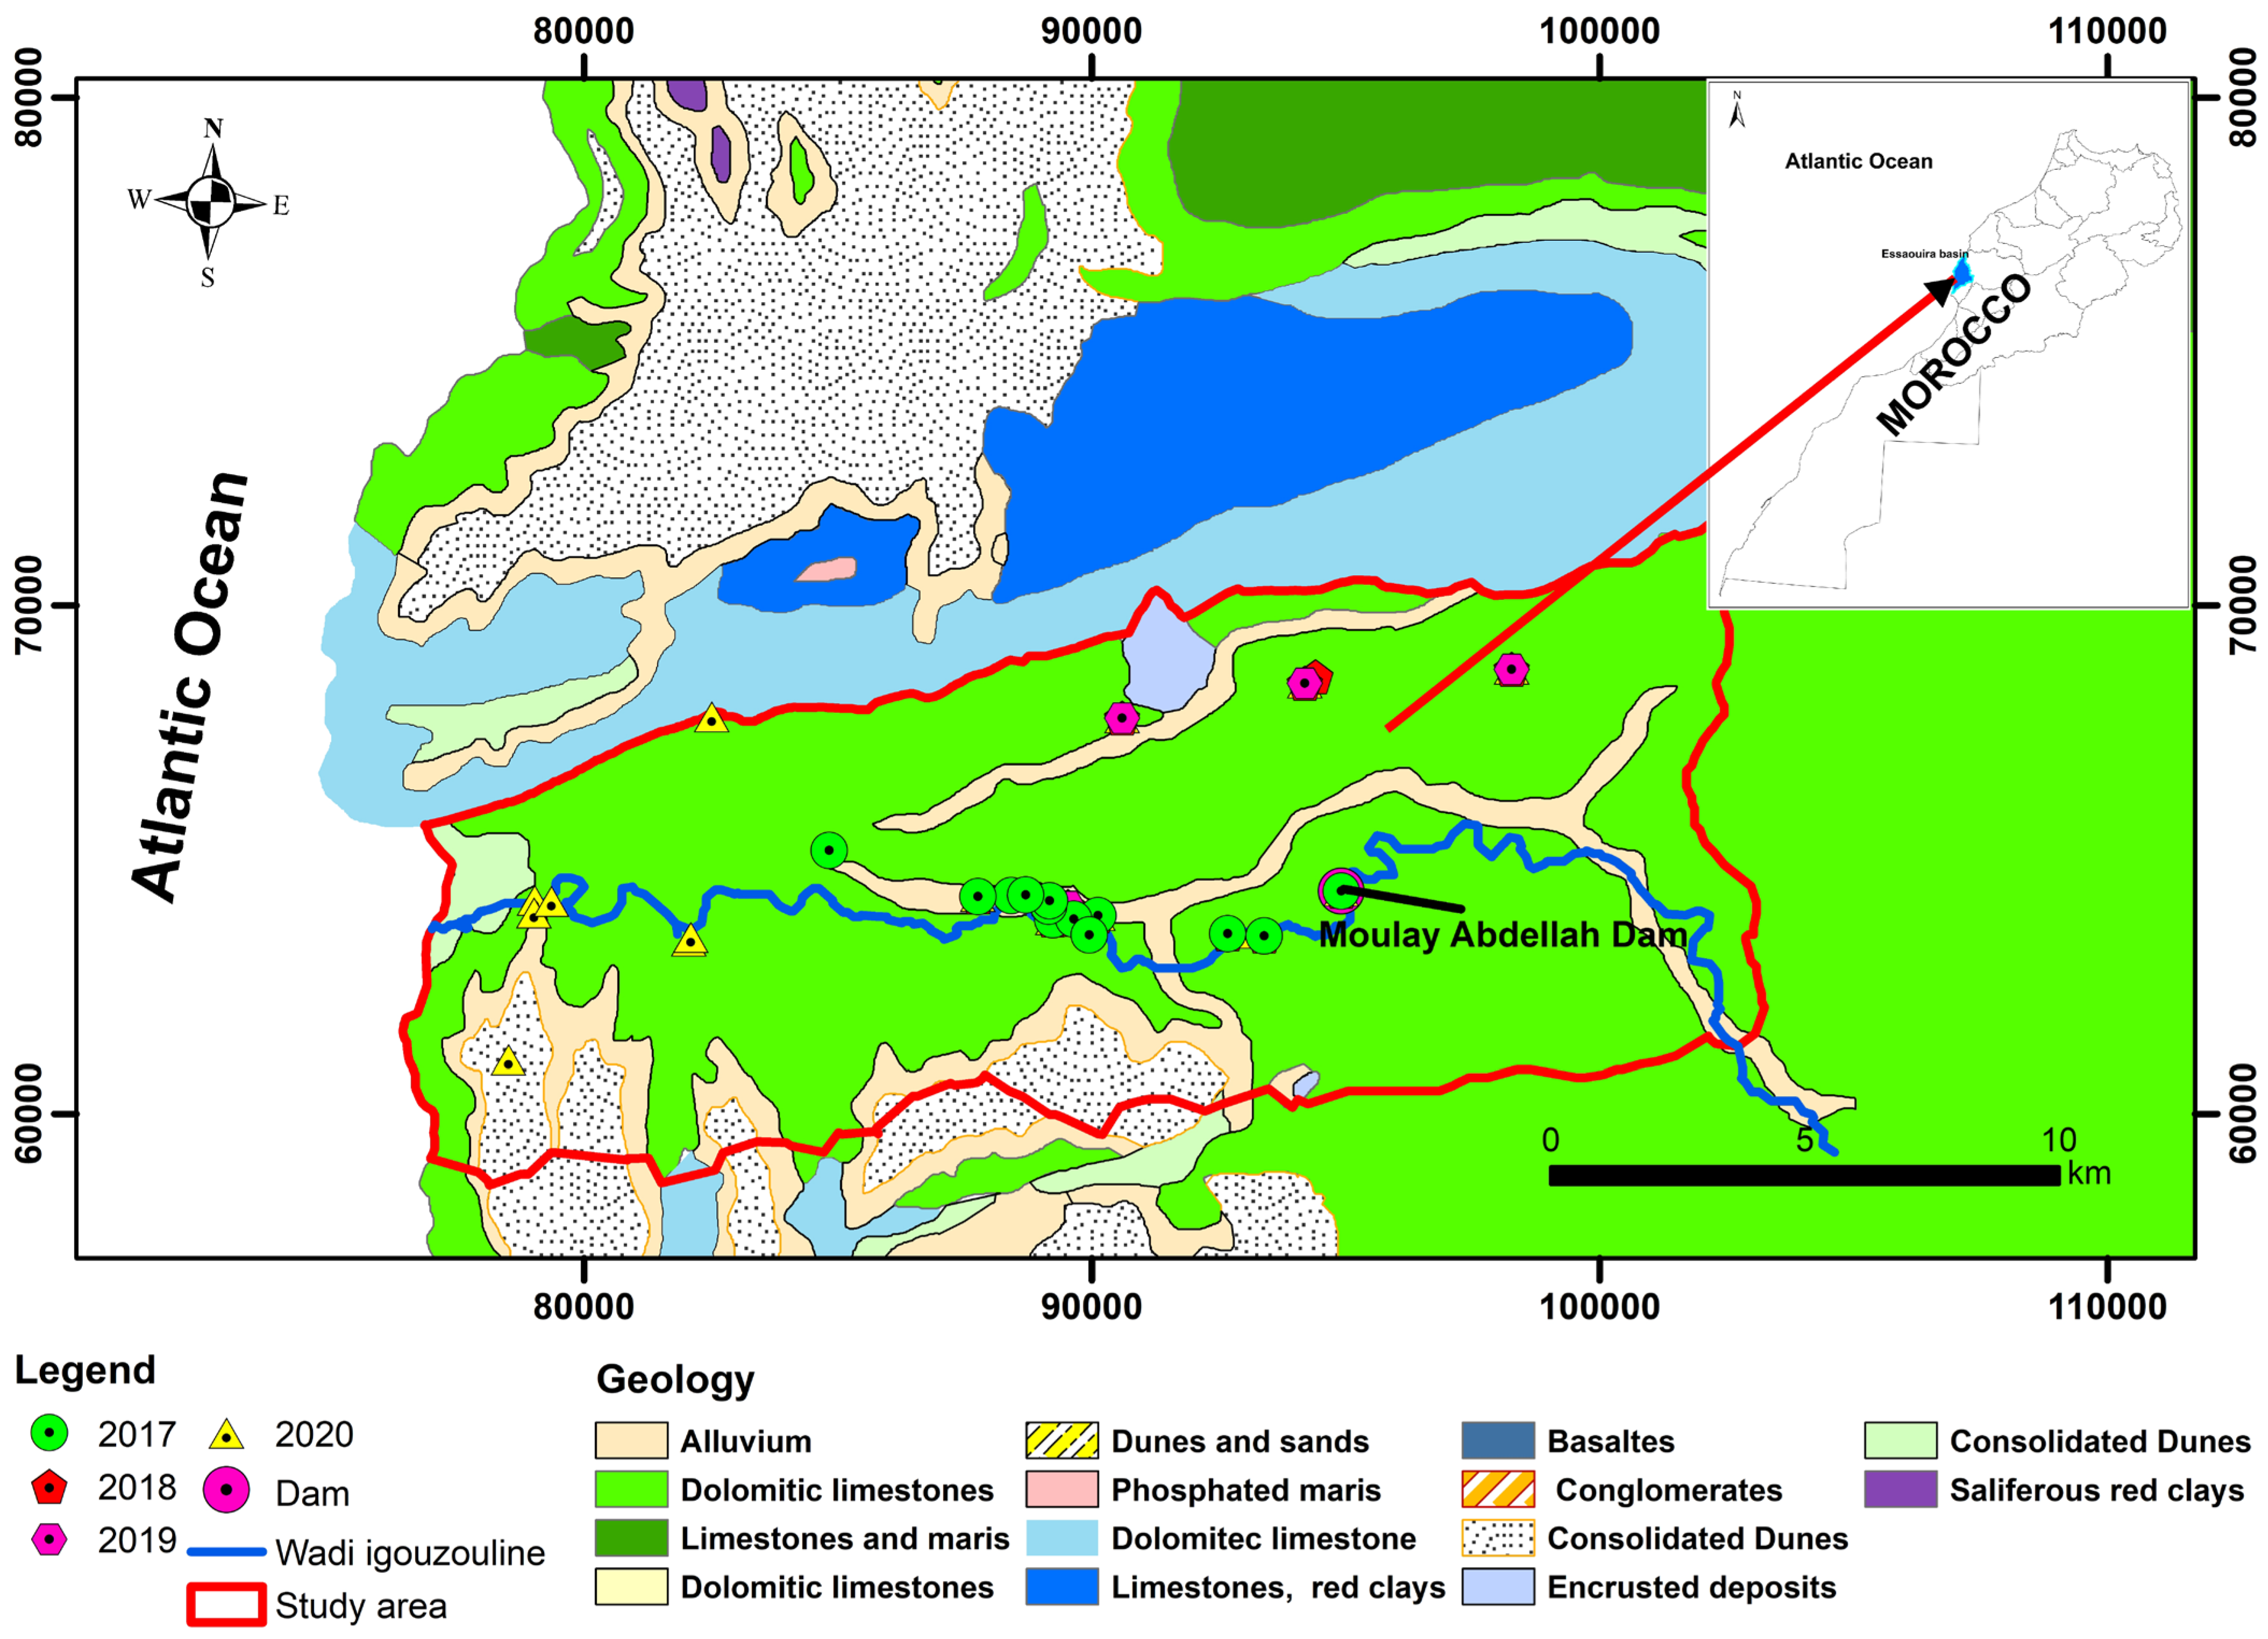
2. Study Area
3. Materials and Methods
3.1. Sample Collection and Physiochemical Analysis
3.2. Drinking Water Quality Index (DWQI)
3.3. Irrigation Water Quality Index (IWQI)
3.4. Data Analysis
- Descriptive statistics: These are used to summarize and describe the characteristics of a dataset. The mean, standard deviation, minimum, and maximum are common measures of central tendency and spread used in descriptive statistics.
- Spearman correlation: This is a non-parametric test used to measure the strength and direction of the relationship between two variables. The Spearman correlation coefficient ranges from −1 to +1, where −1 indicates a perfect negative correlation, +1 indicates a perfect positive correlation, and 0 indicates no correlation [69].
- Principal component analysis (PCA): This is a multivariate statistical technique used to reduce the dimensionality of a dataset by identifying the underlying patterns and relationships among variables. PCA can help to identify the most important variables and can be used to create new variables (components) that capture most of the variation in the original data [70]
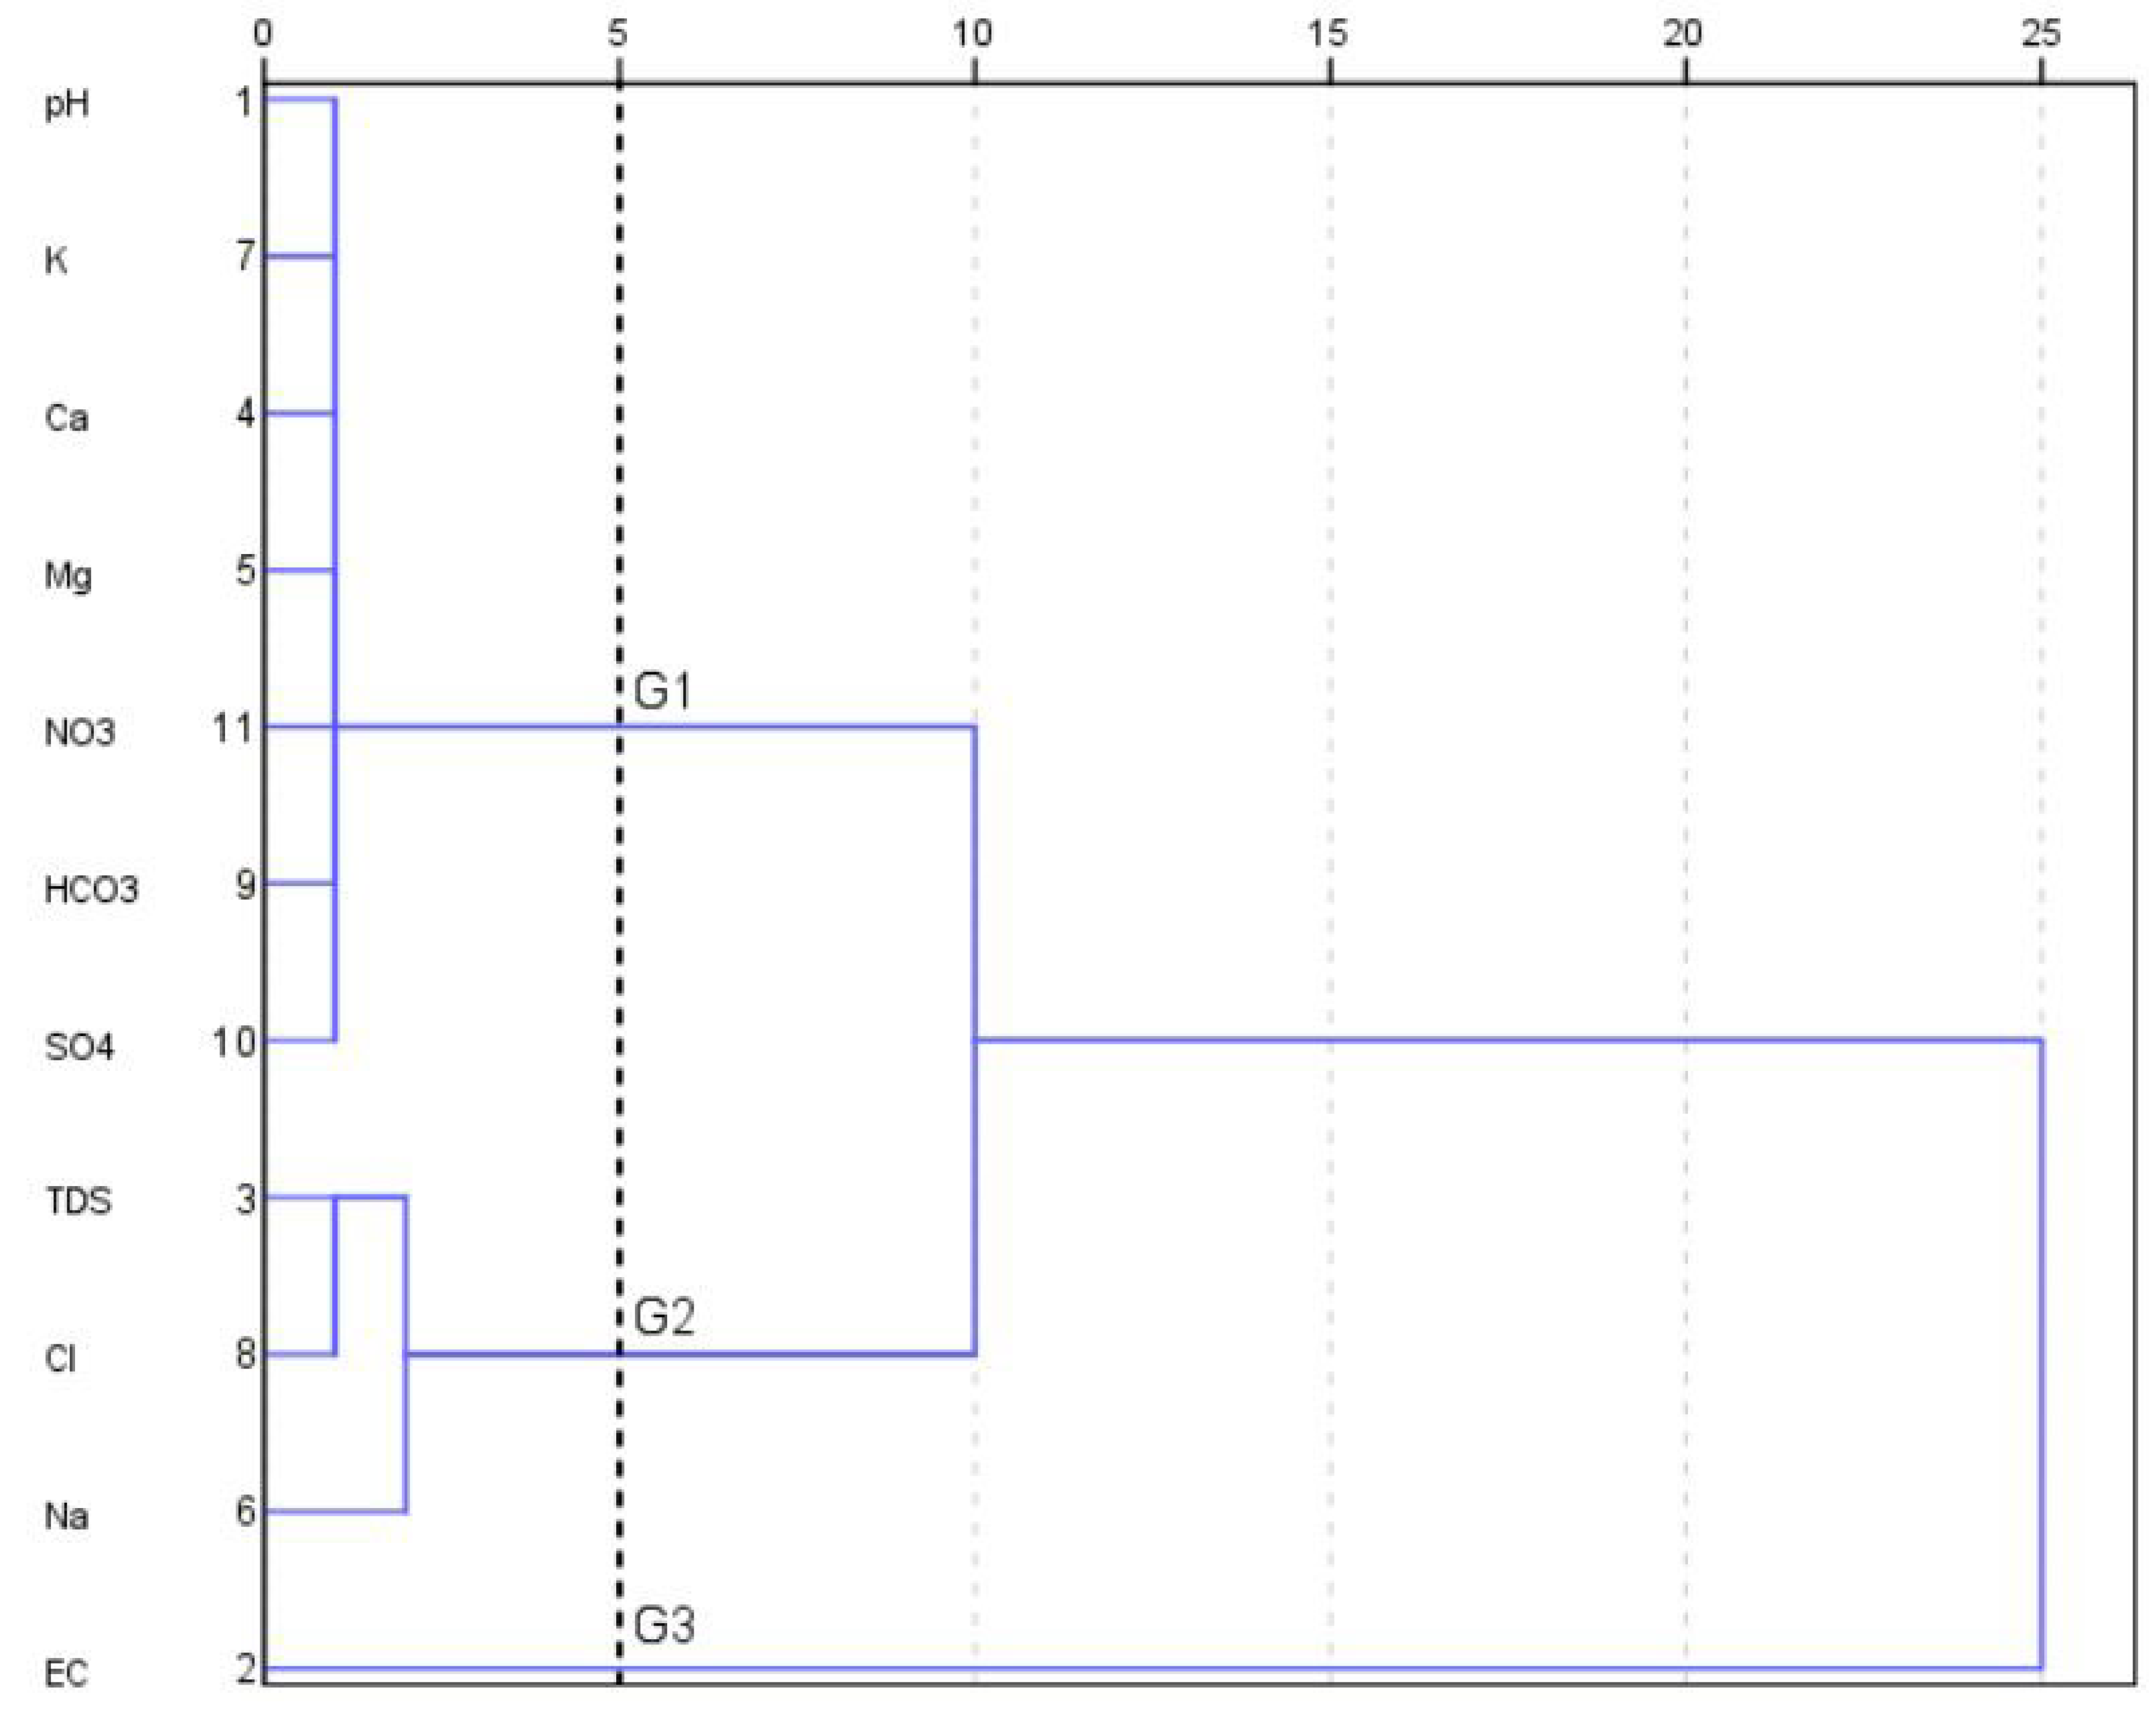
- Cluster analysis (CA): This technique is used to group data objects into clusters based on similarities among them. CA can be used to identify patterns and relationships in the data and help identify subgroups within the data that may be of interest [71].
4. Results and Discussion
4.1. Groundwater Geochemistry
4.2. Multivariate Statistical Analysis
4.2.1. Descriptive Statistics and Pearson’s Correlation Matrix
4.2.2. Hierarchical Cluster Analysis (HCA)
4.2.3. Principal Component Analysis (PCA)
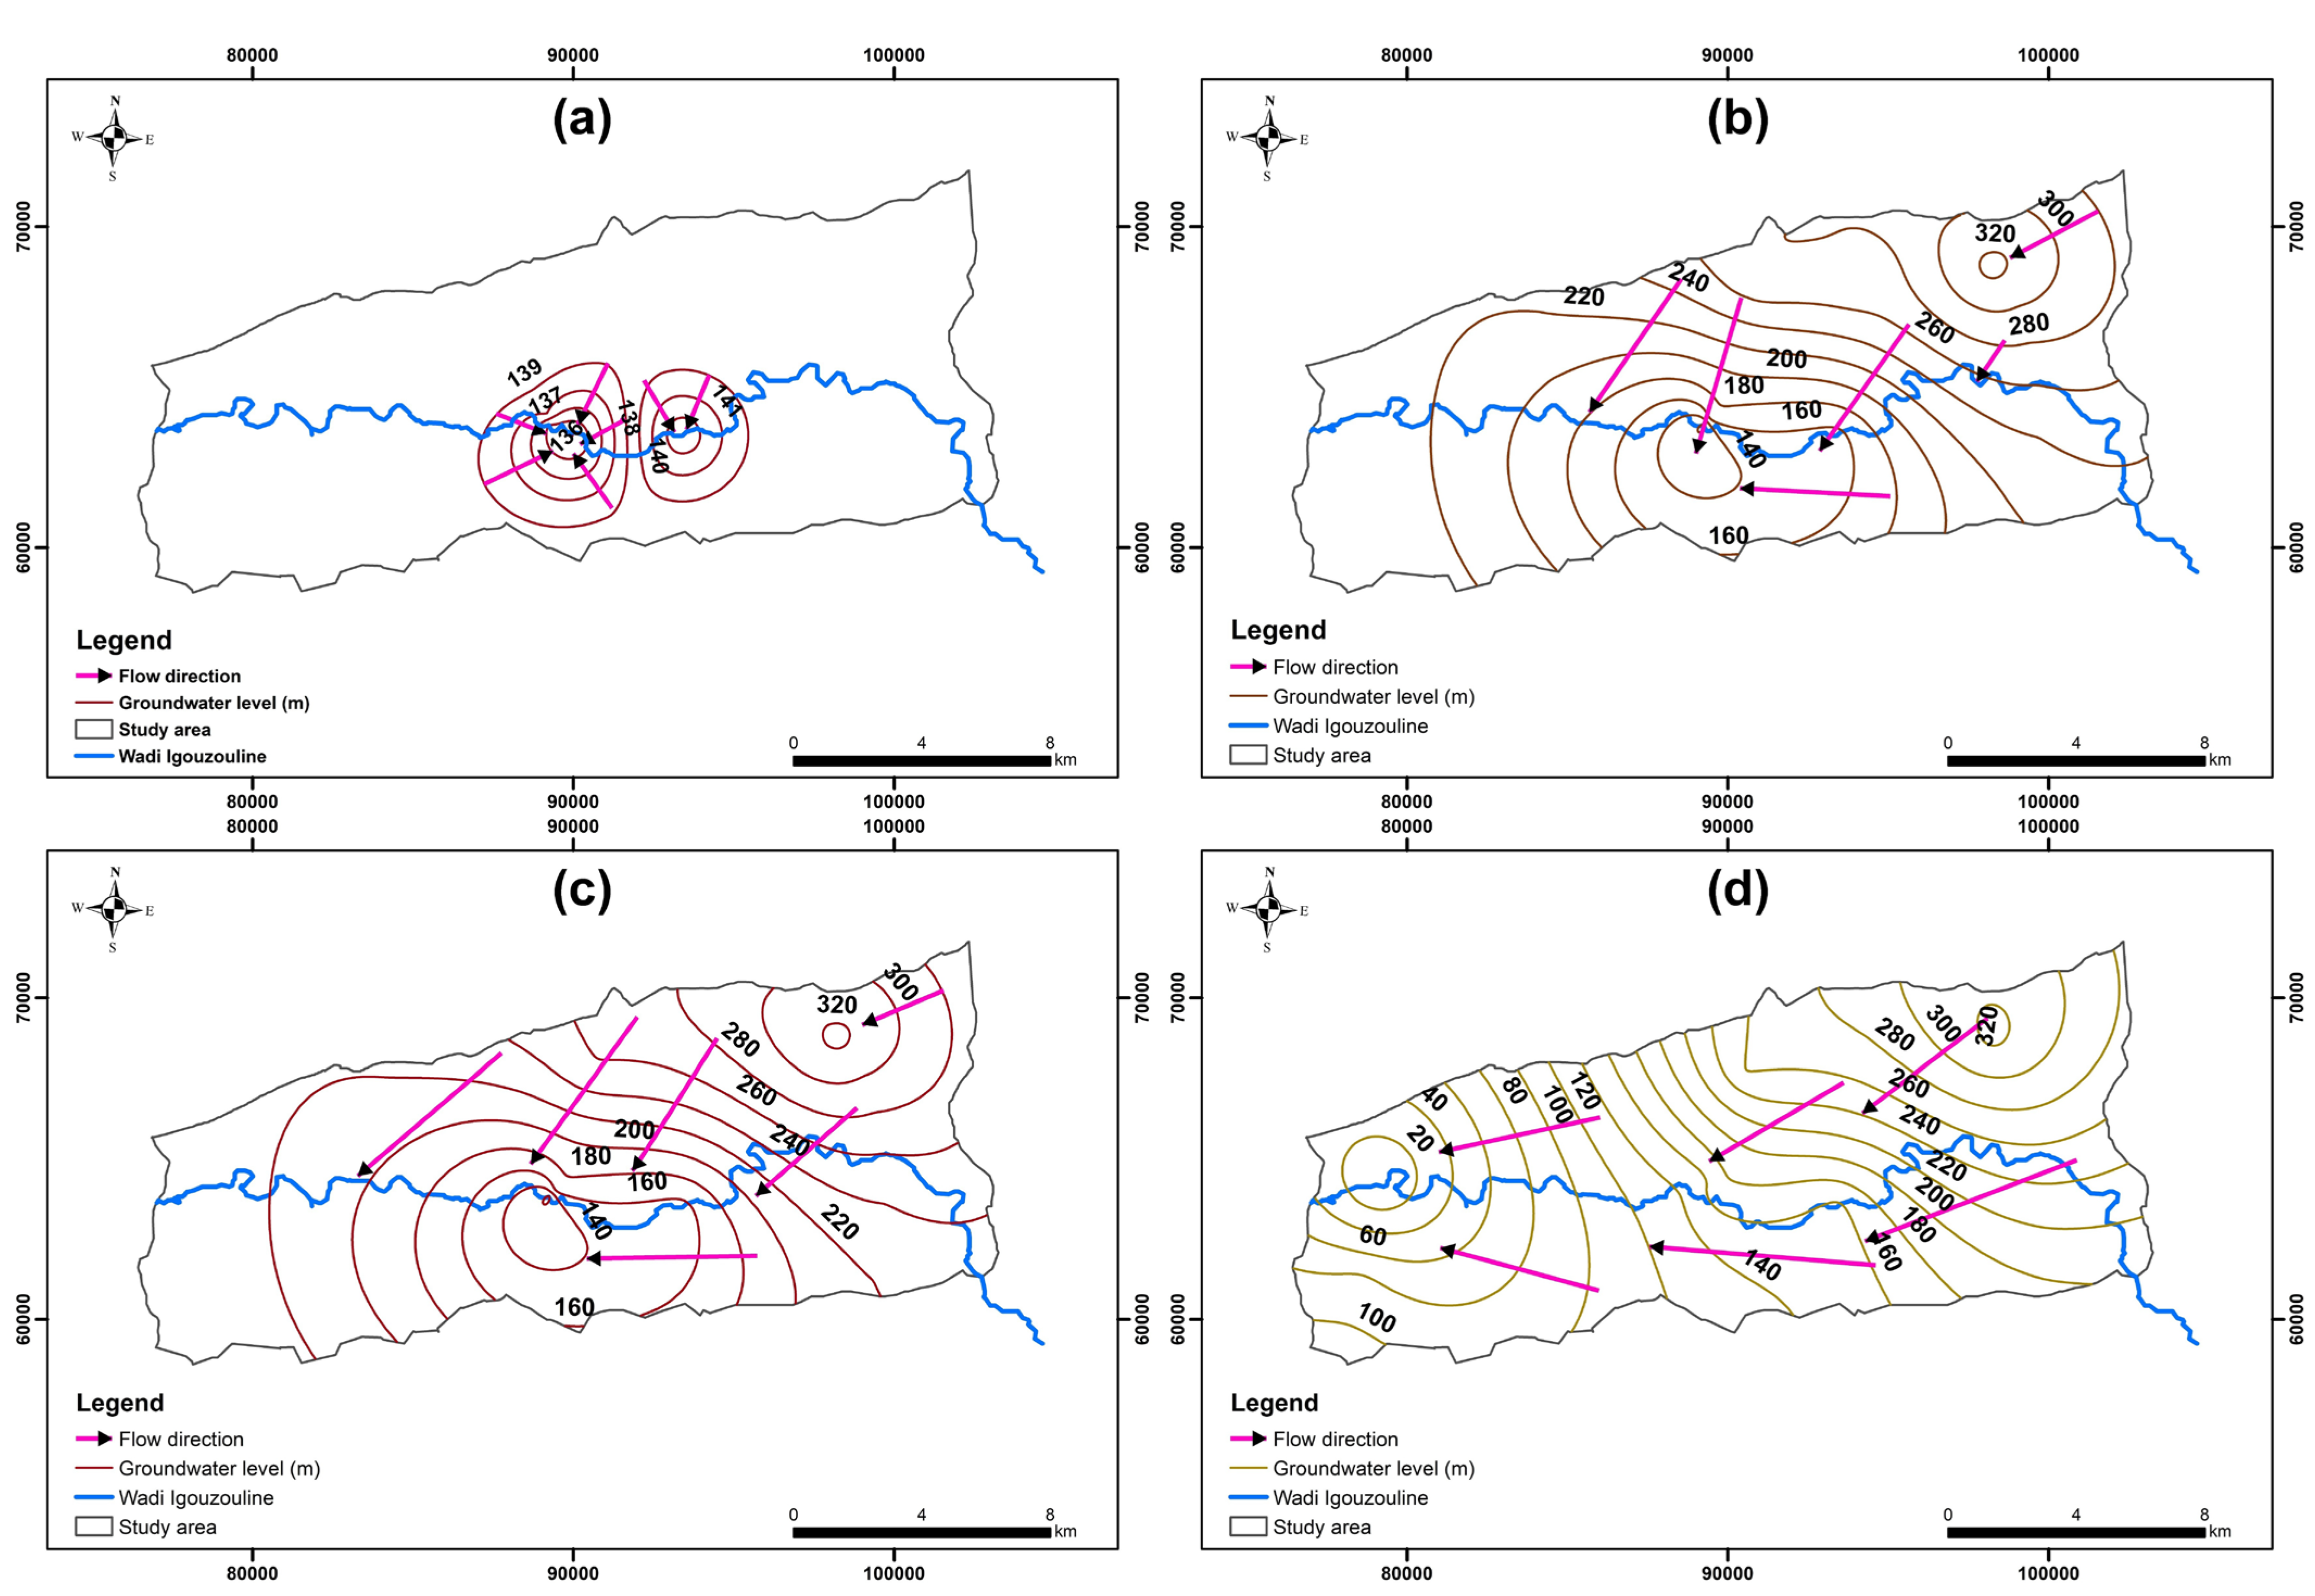
4.3. Groundwater Levels
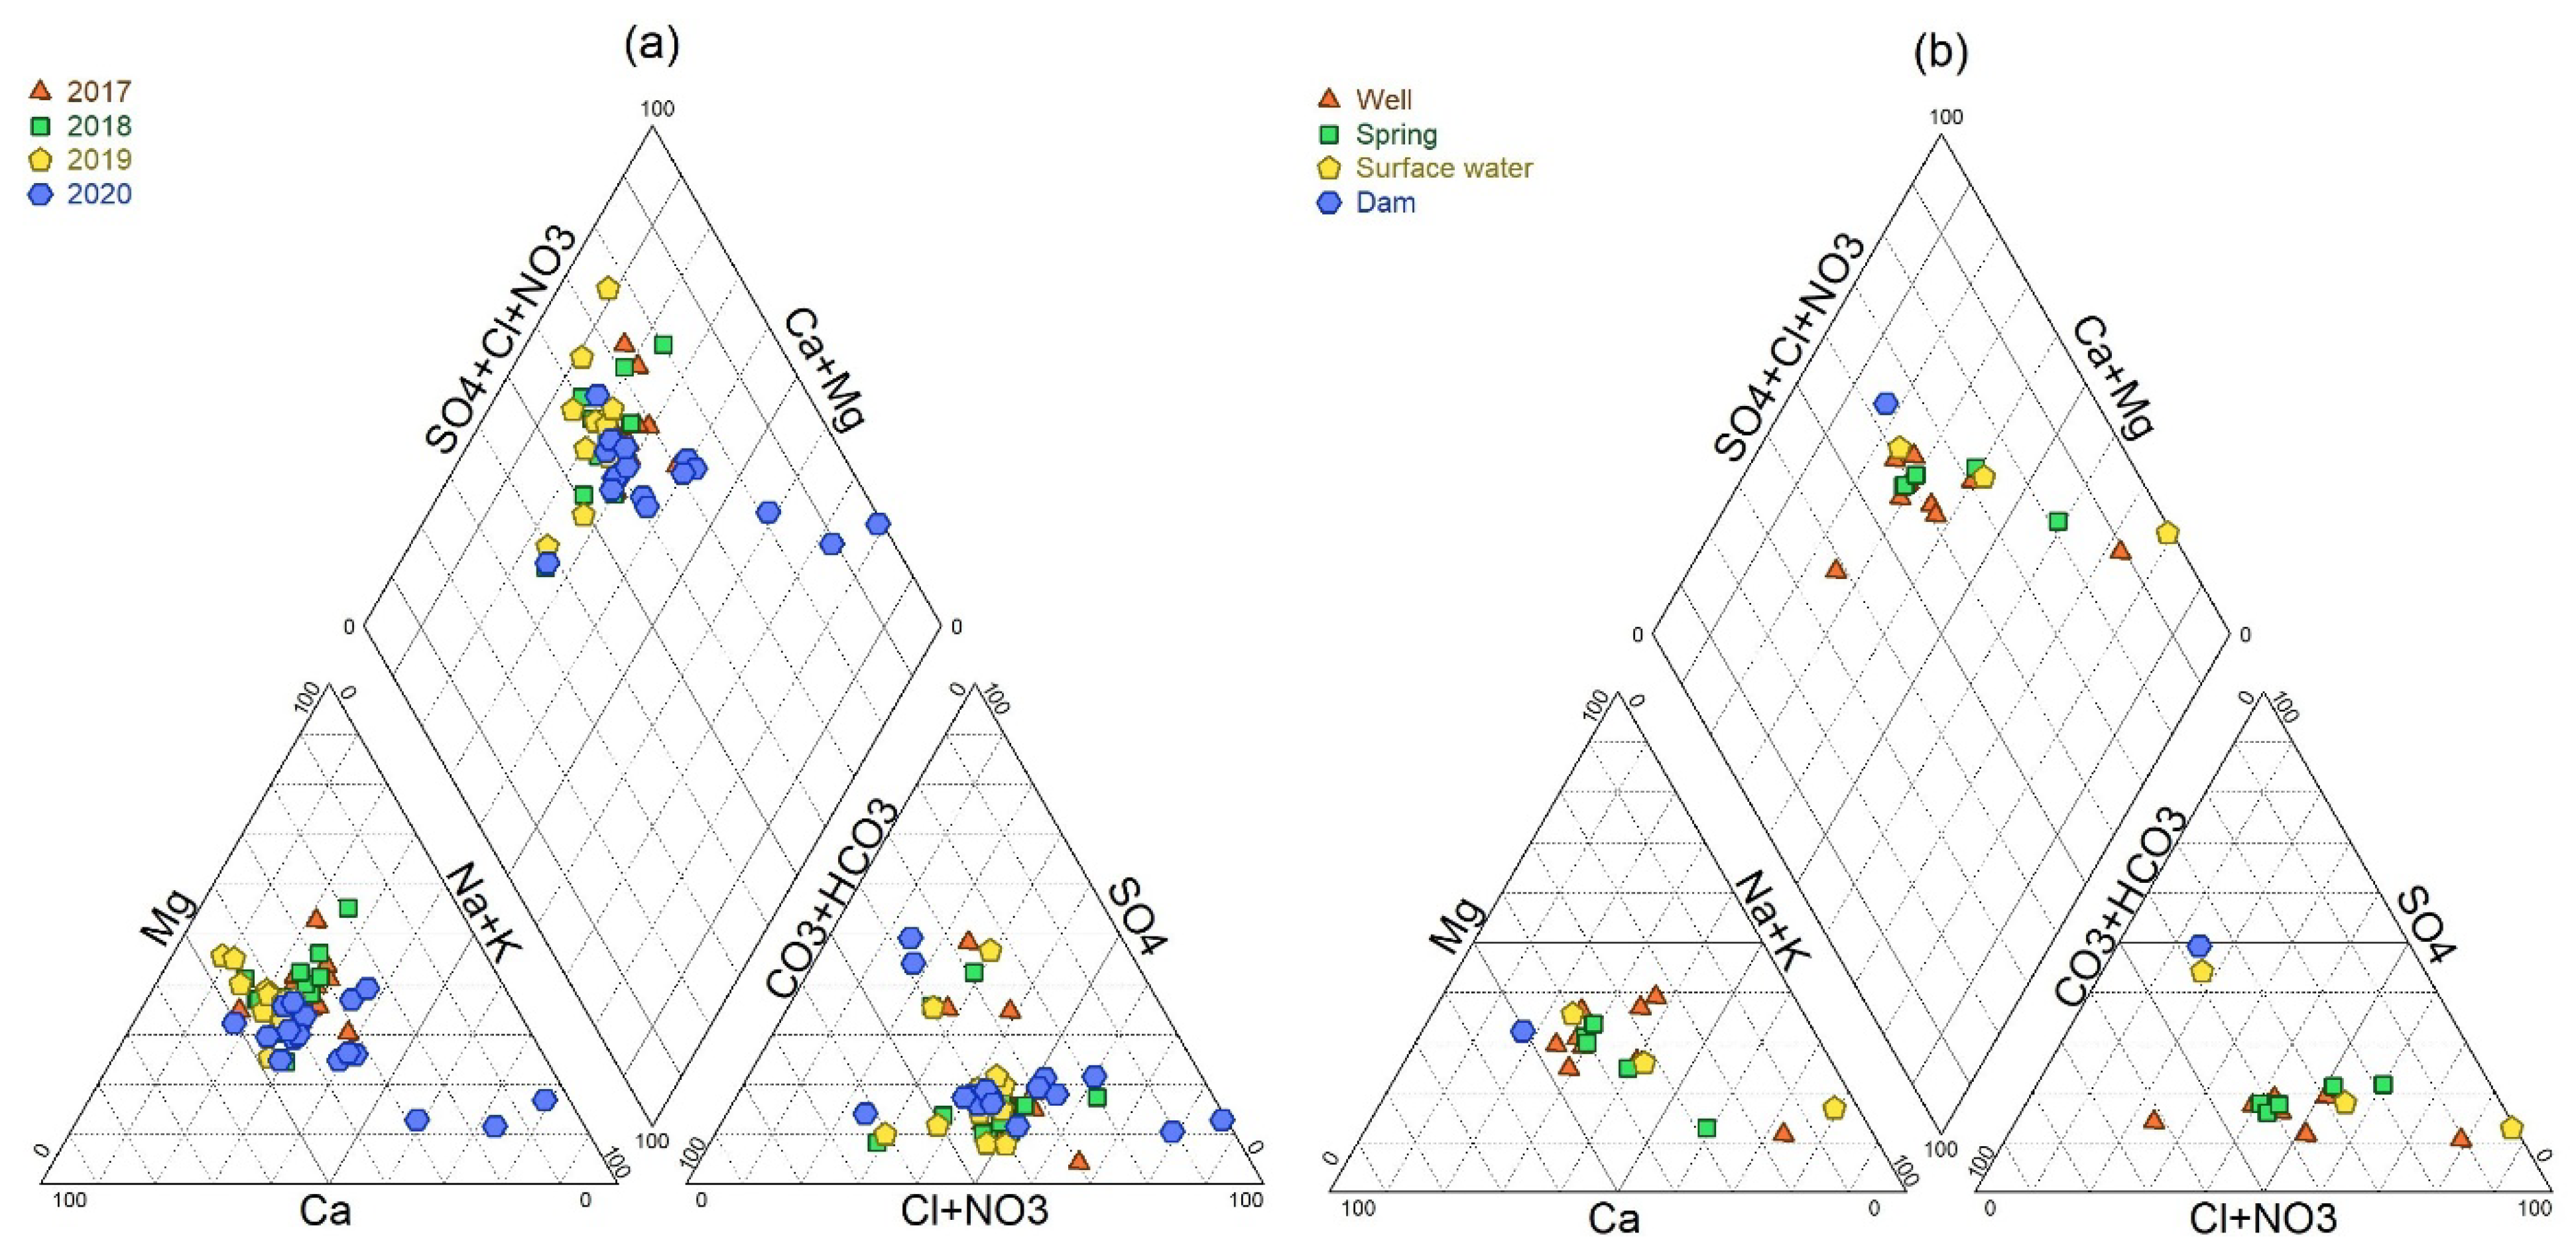
4.4. Hydrochemical Facies
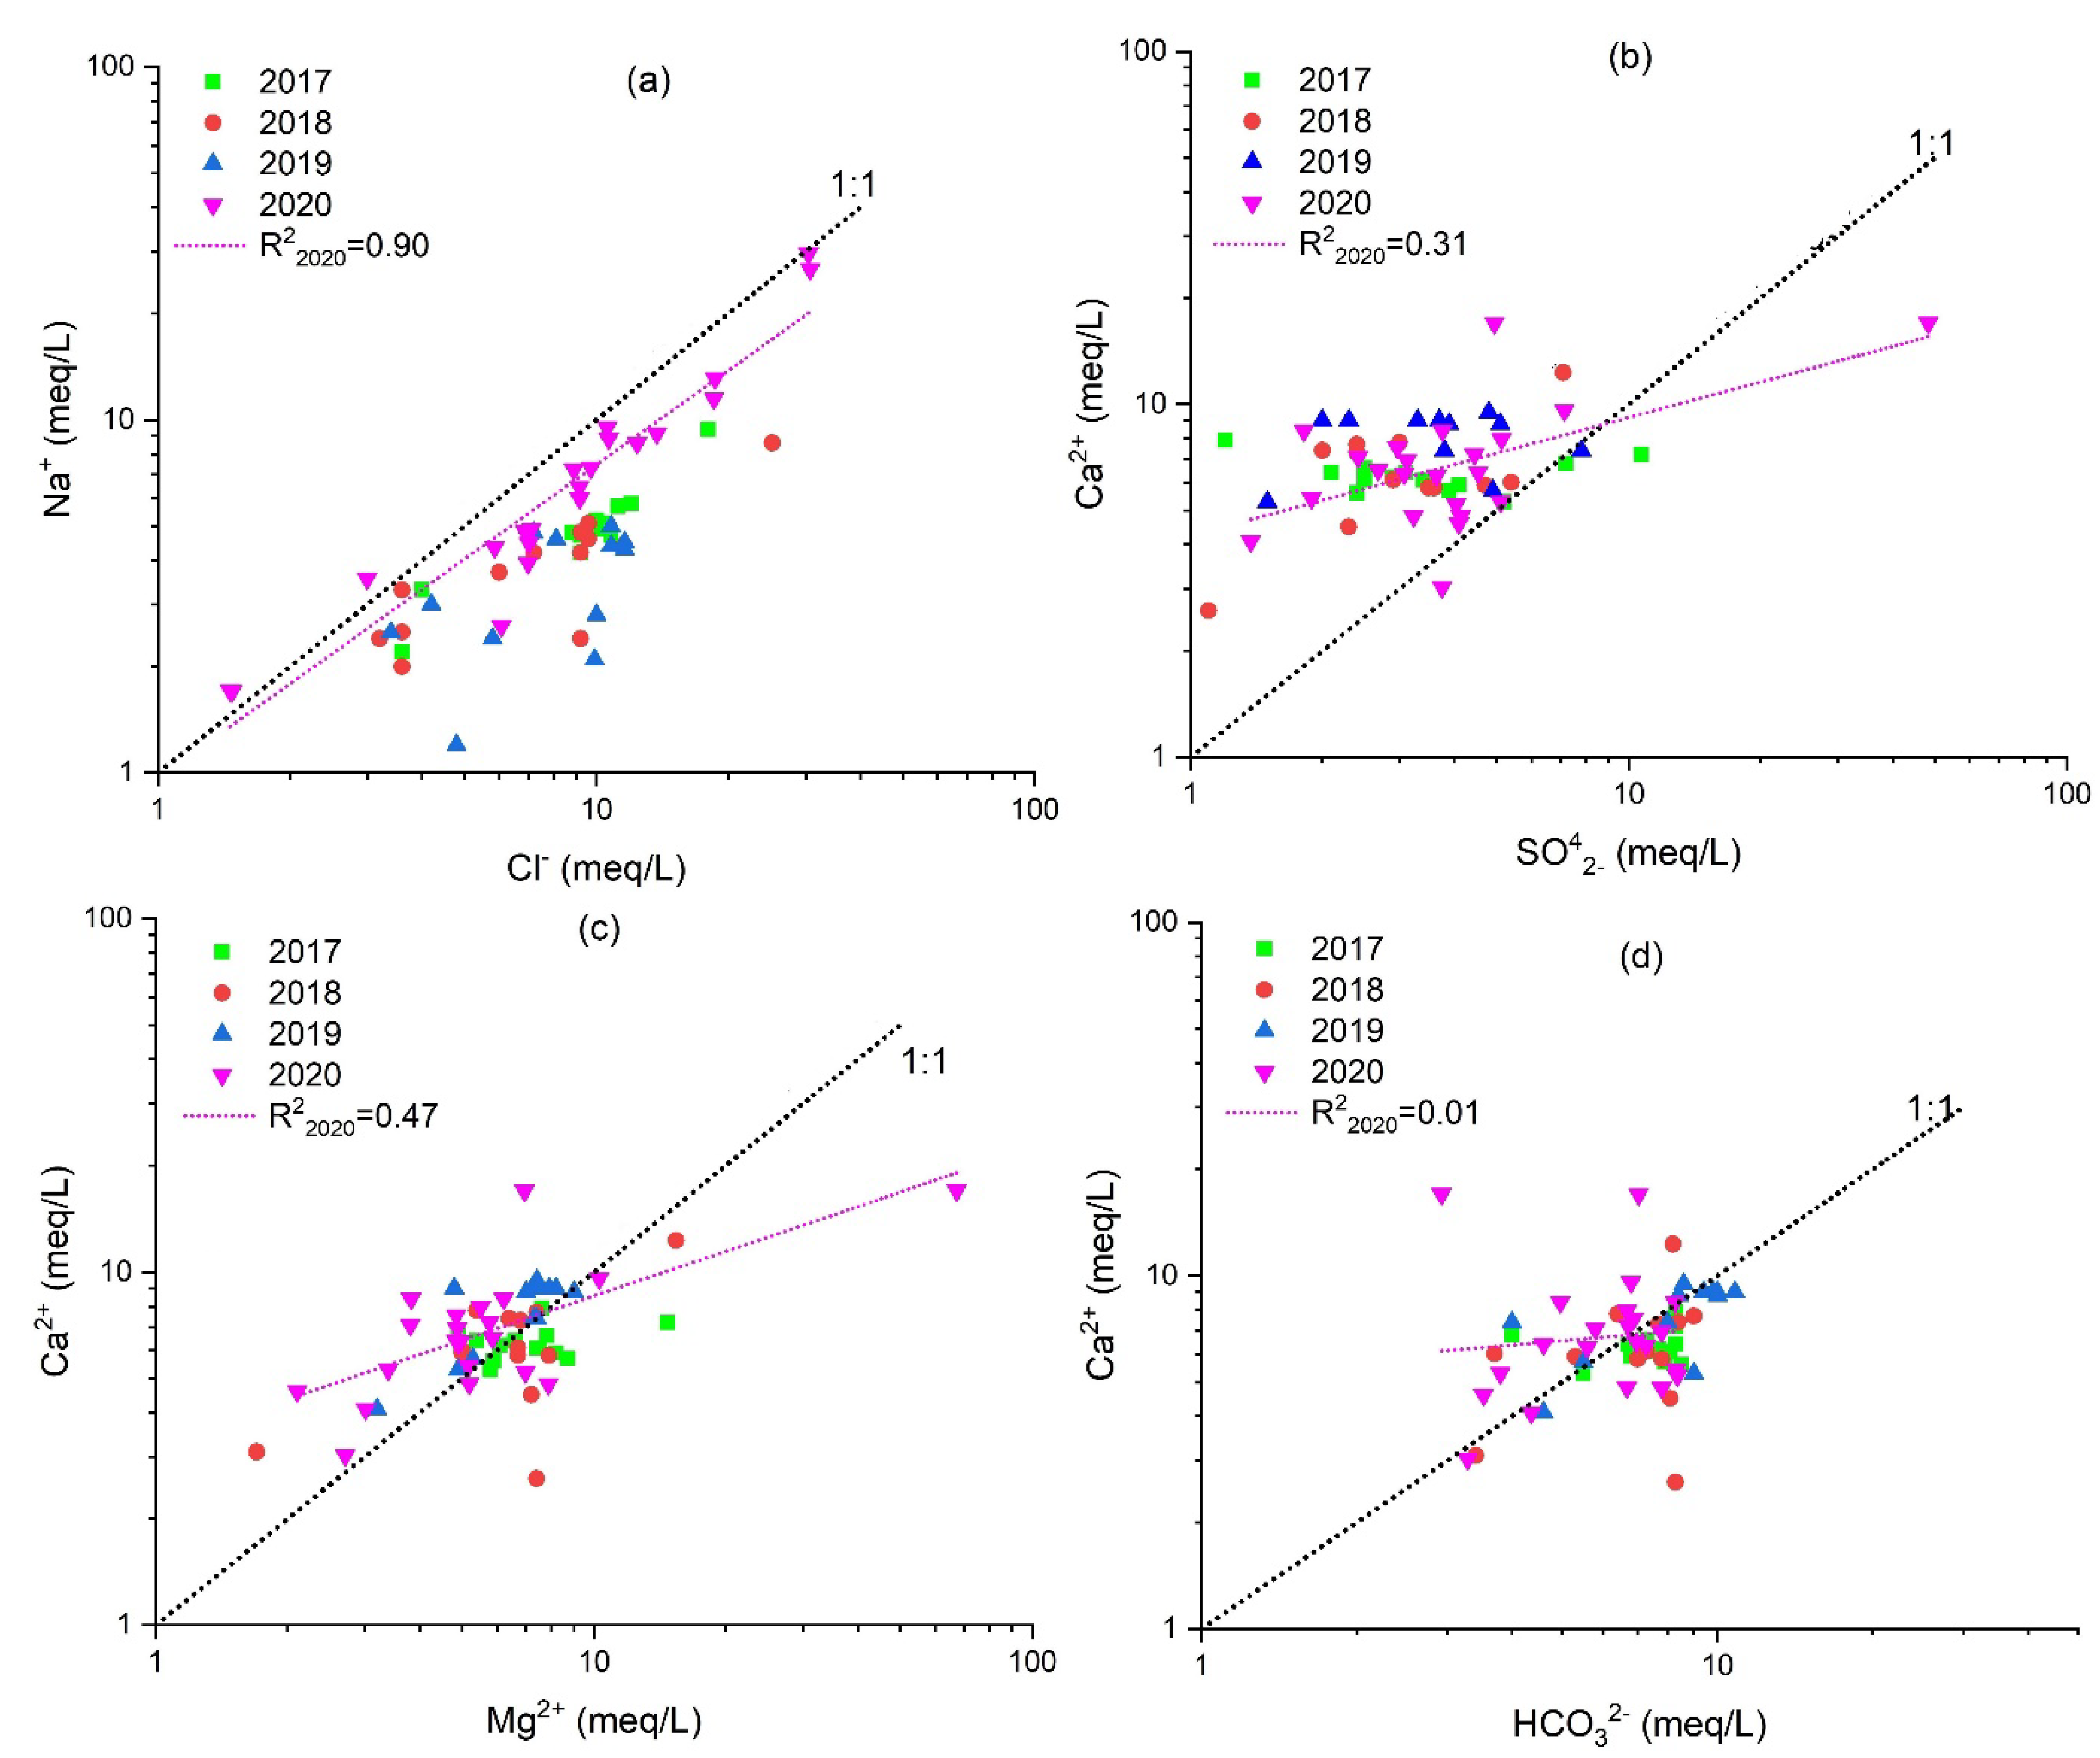
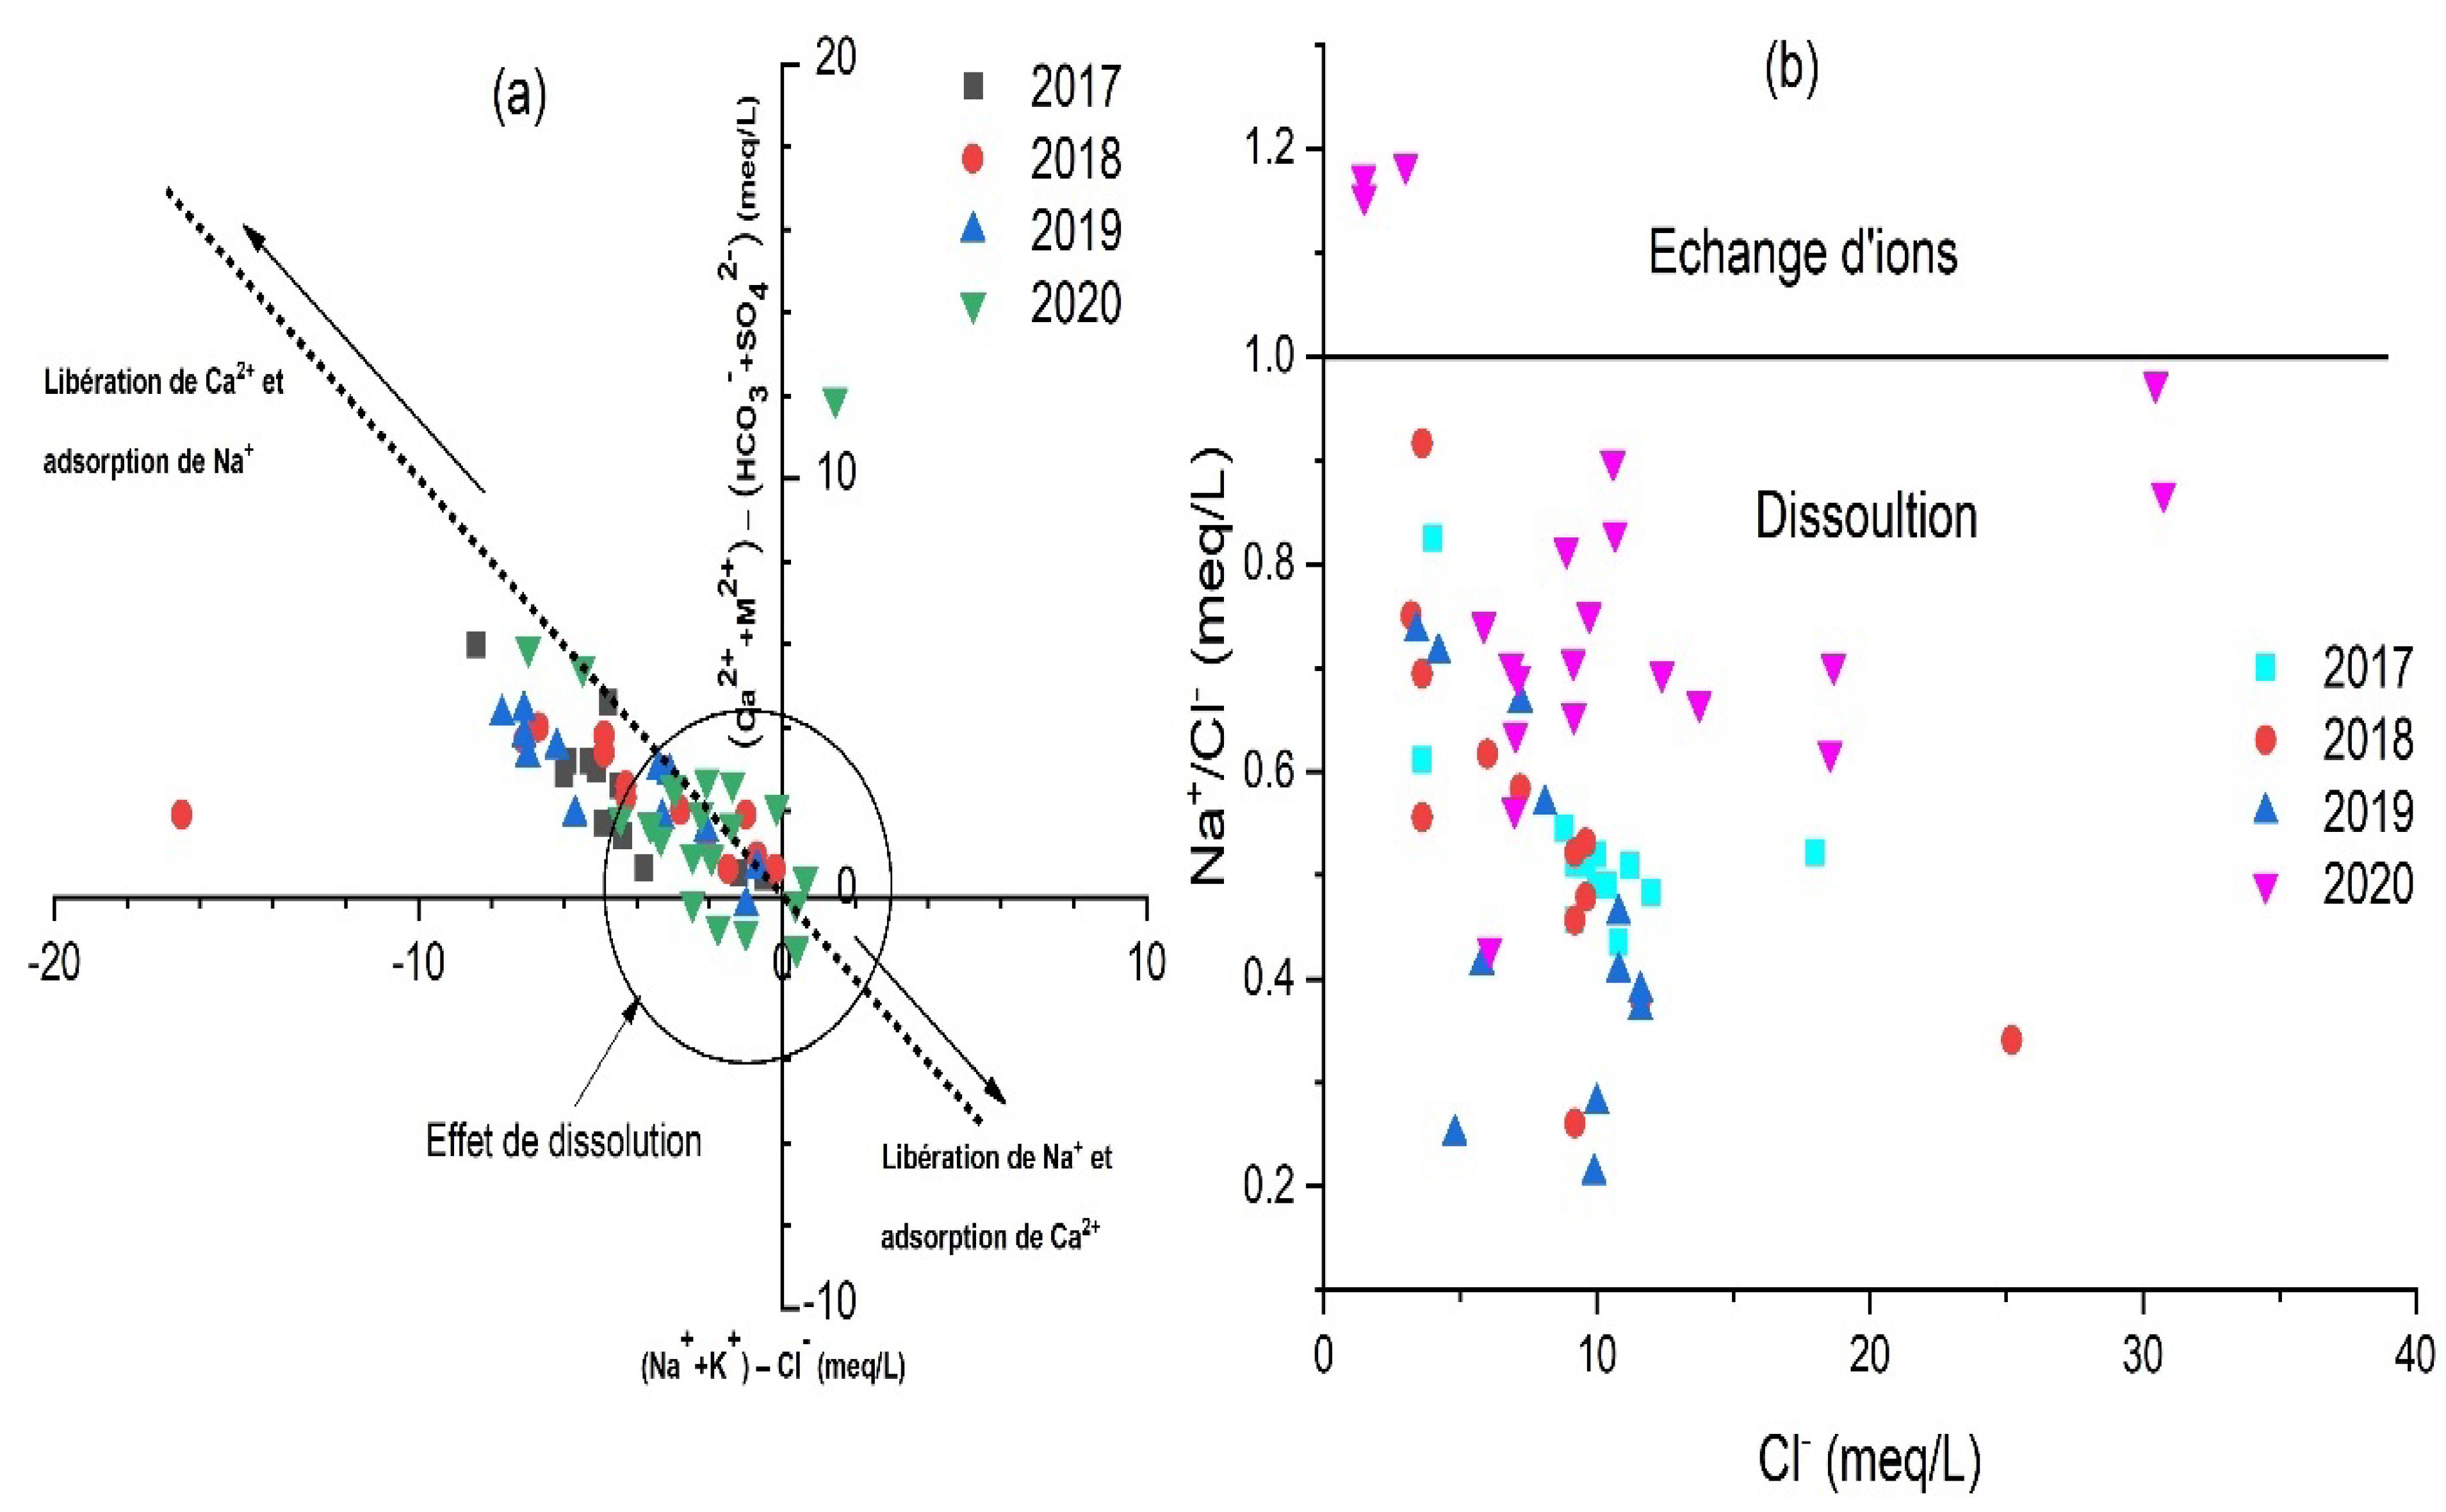
4.5. Ion Ratio and Hydrogeochemical Evolution
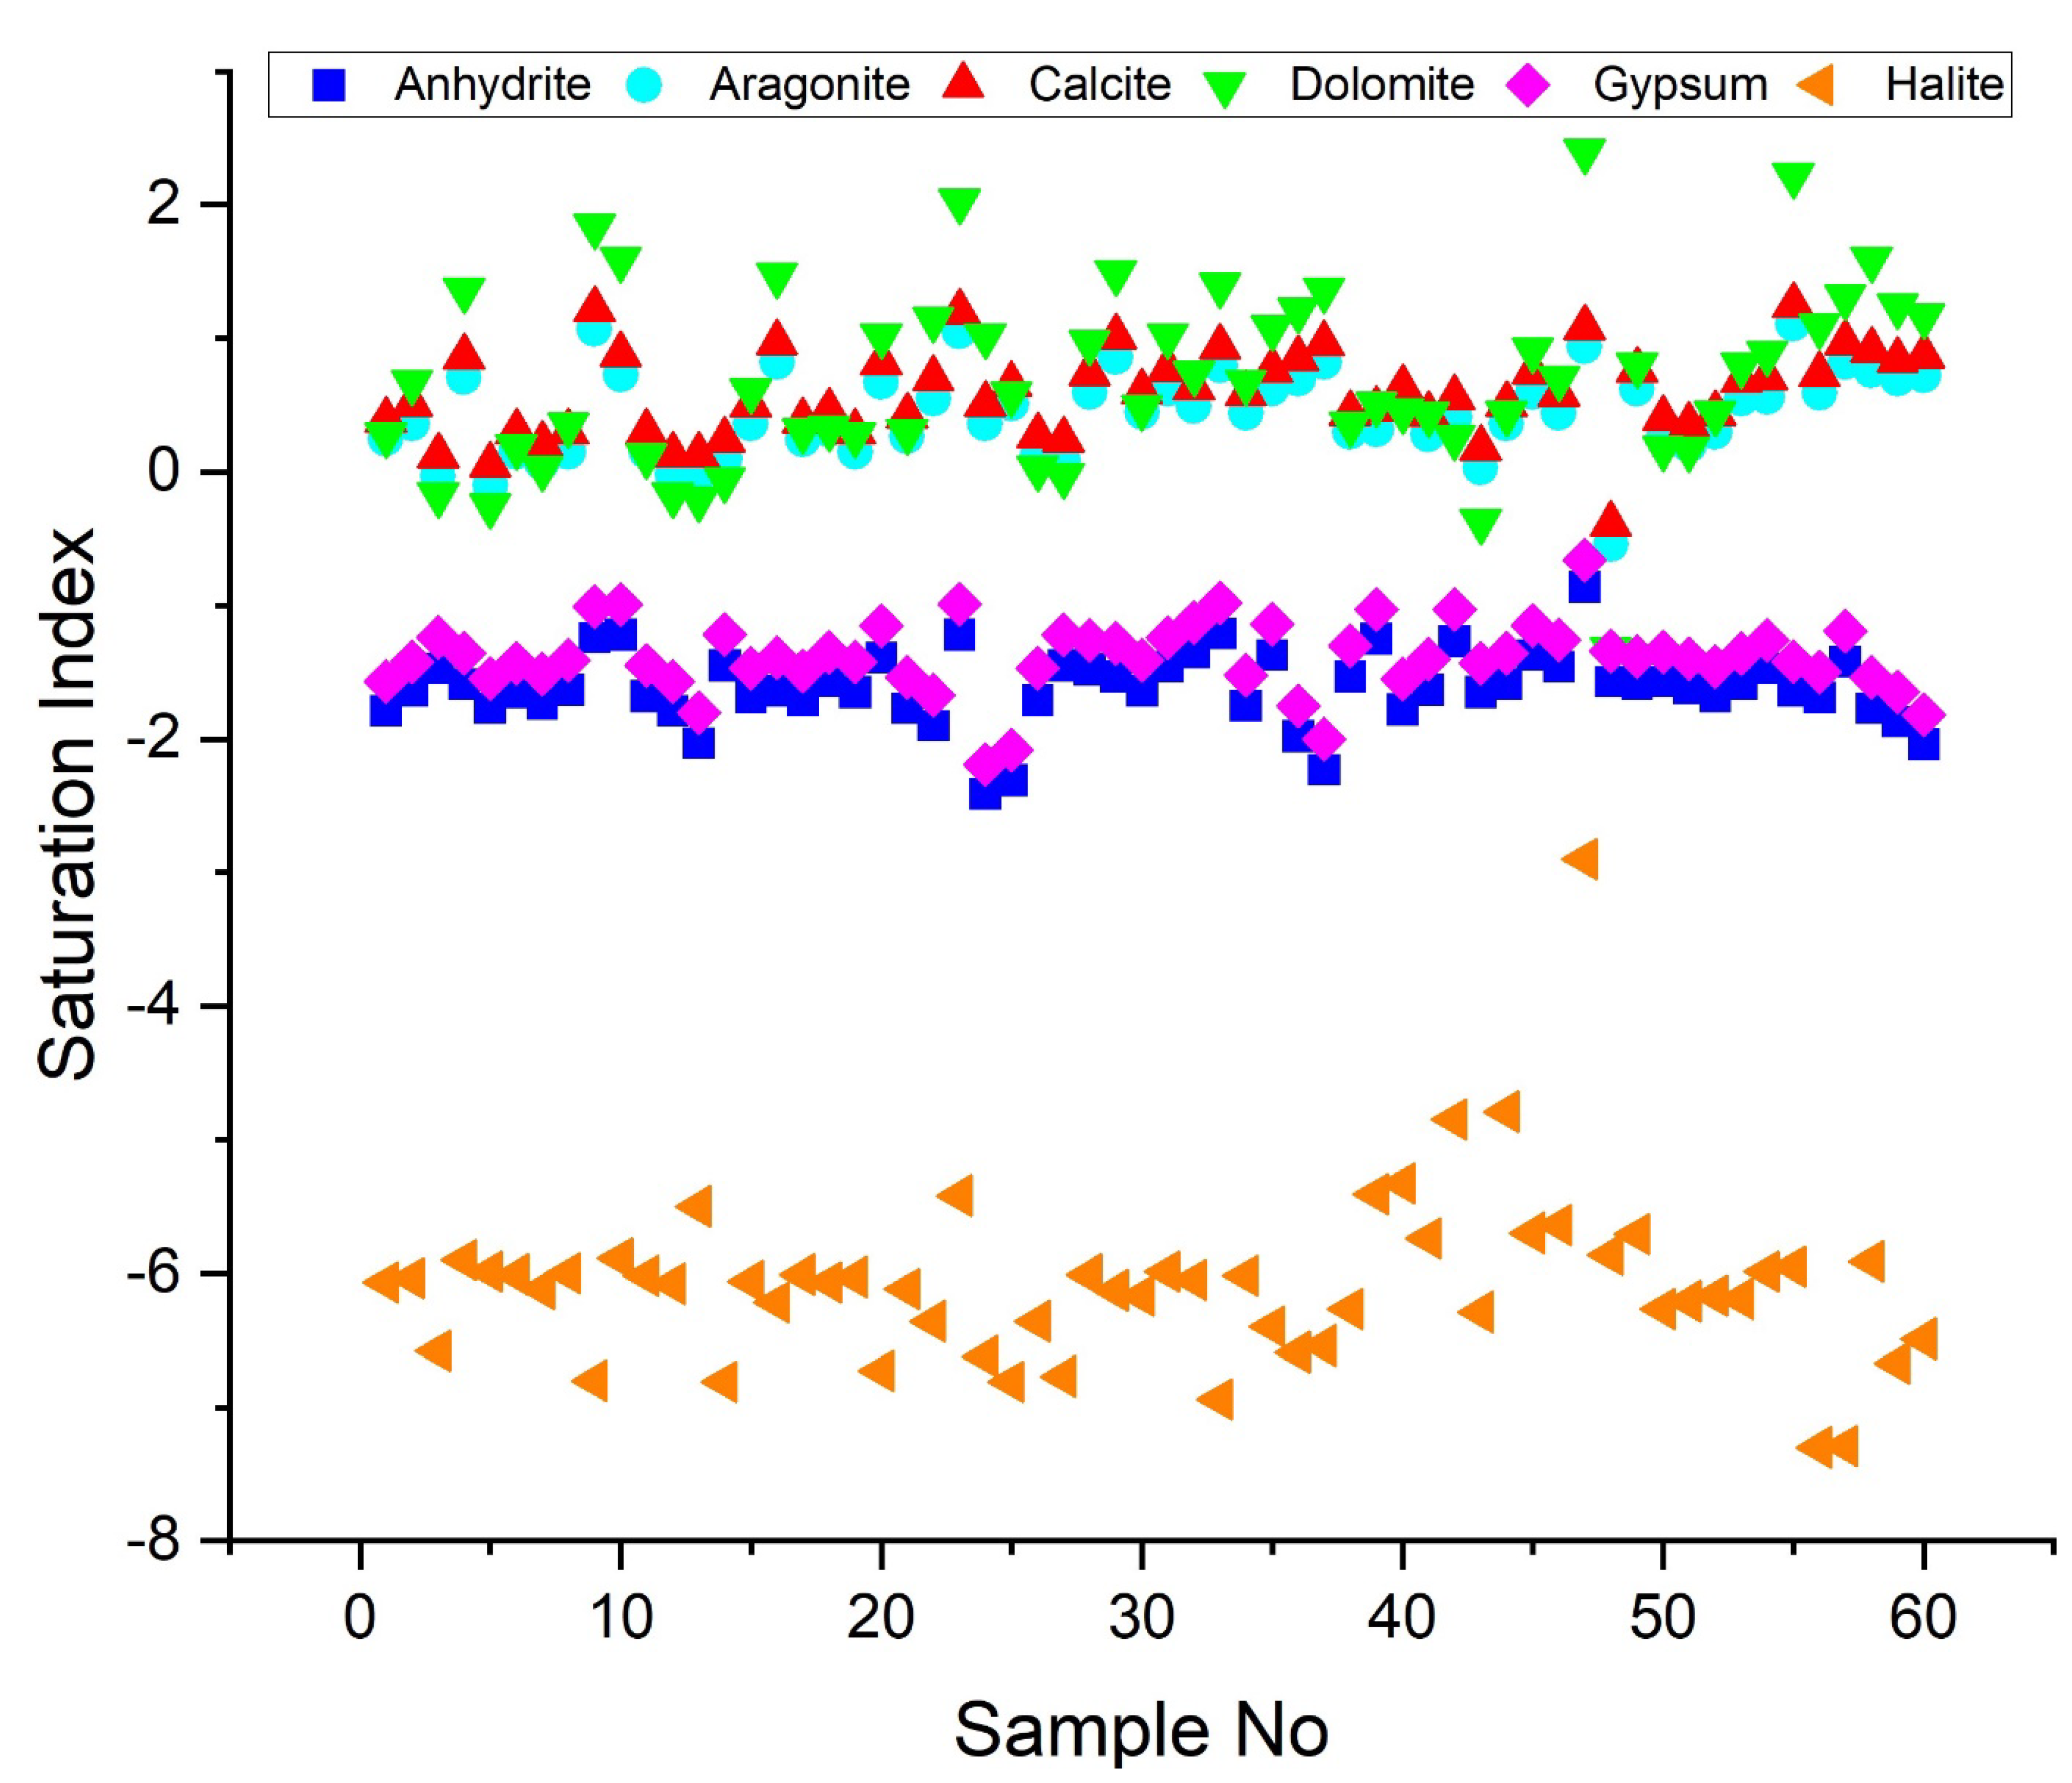
4.6. The Main Geochemical Processes
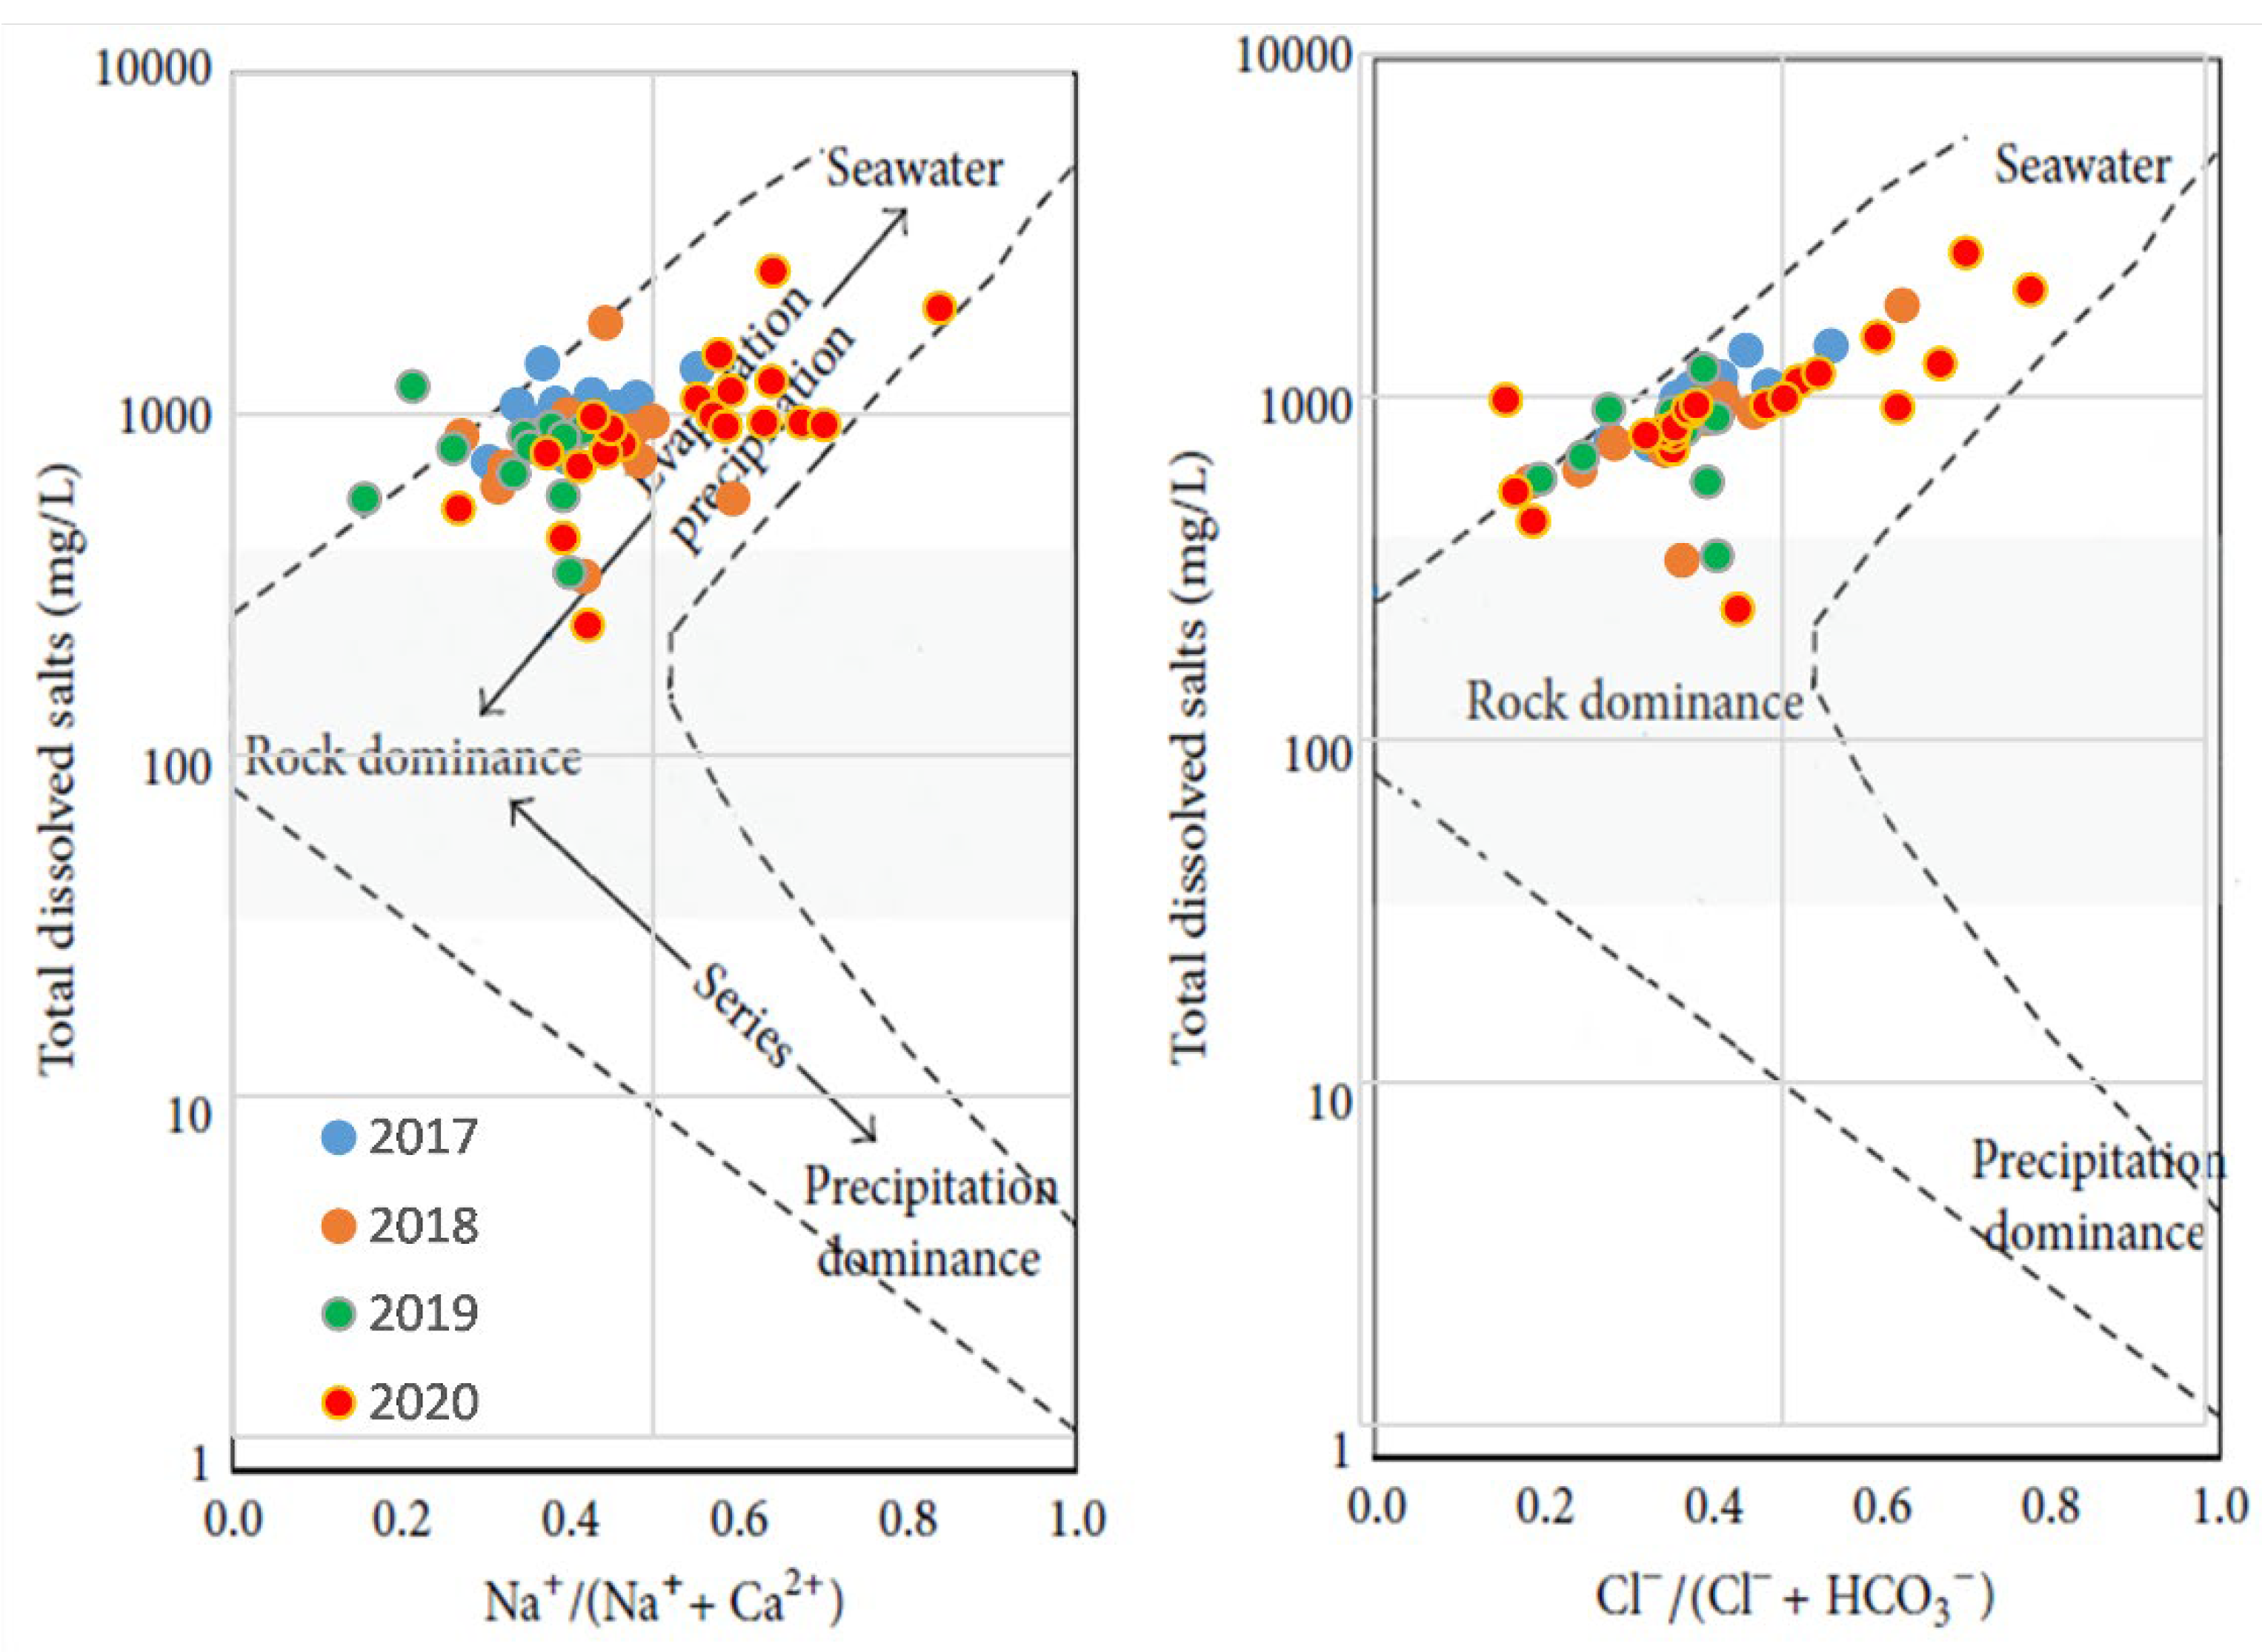
4.7. Water Mineralization
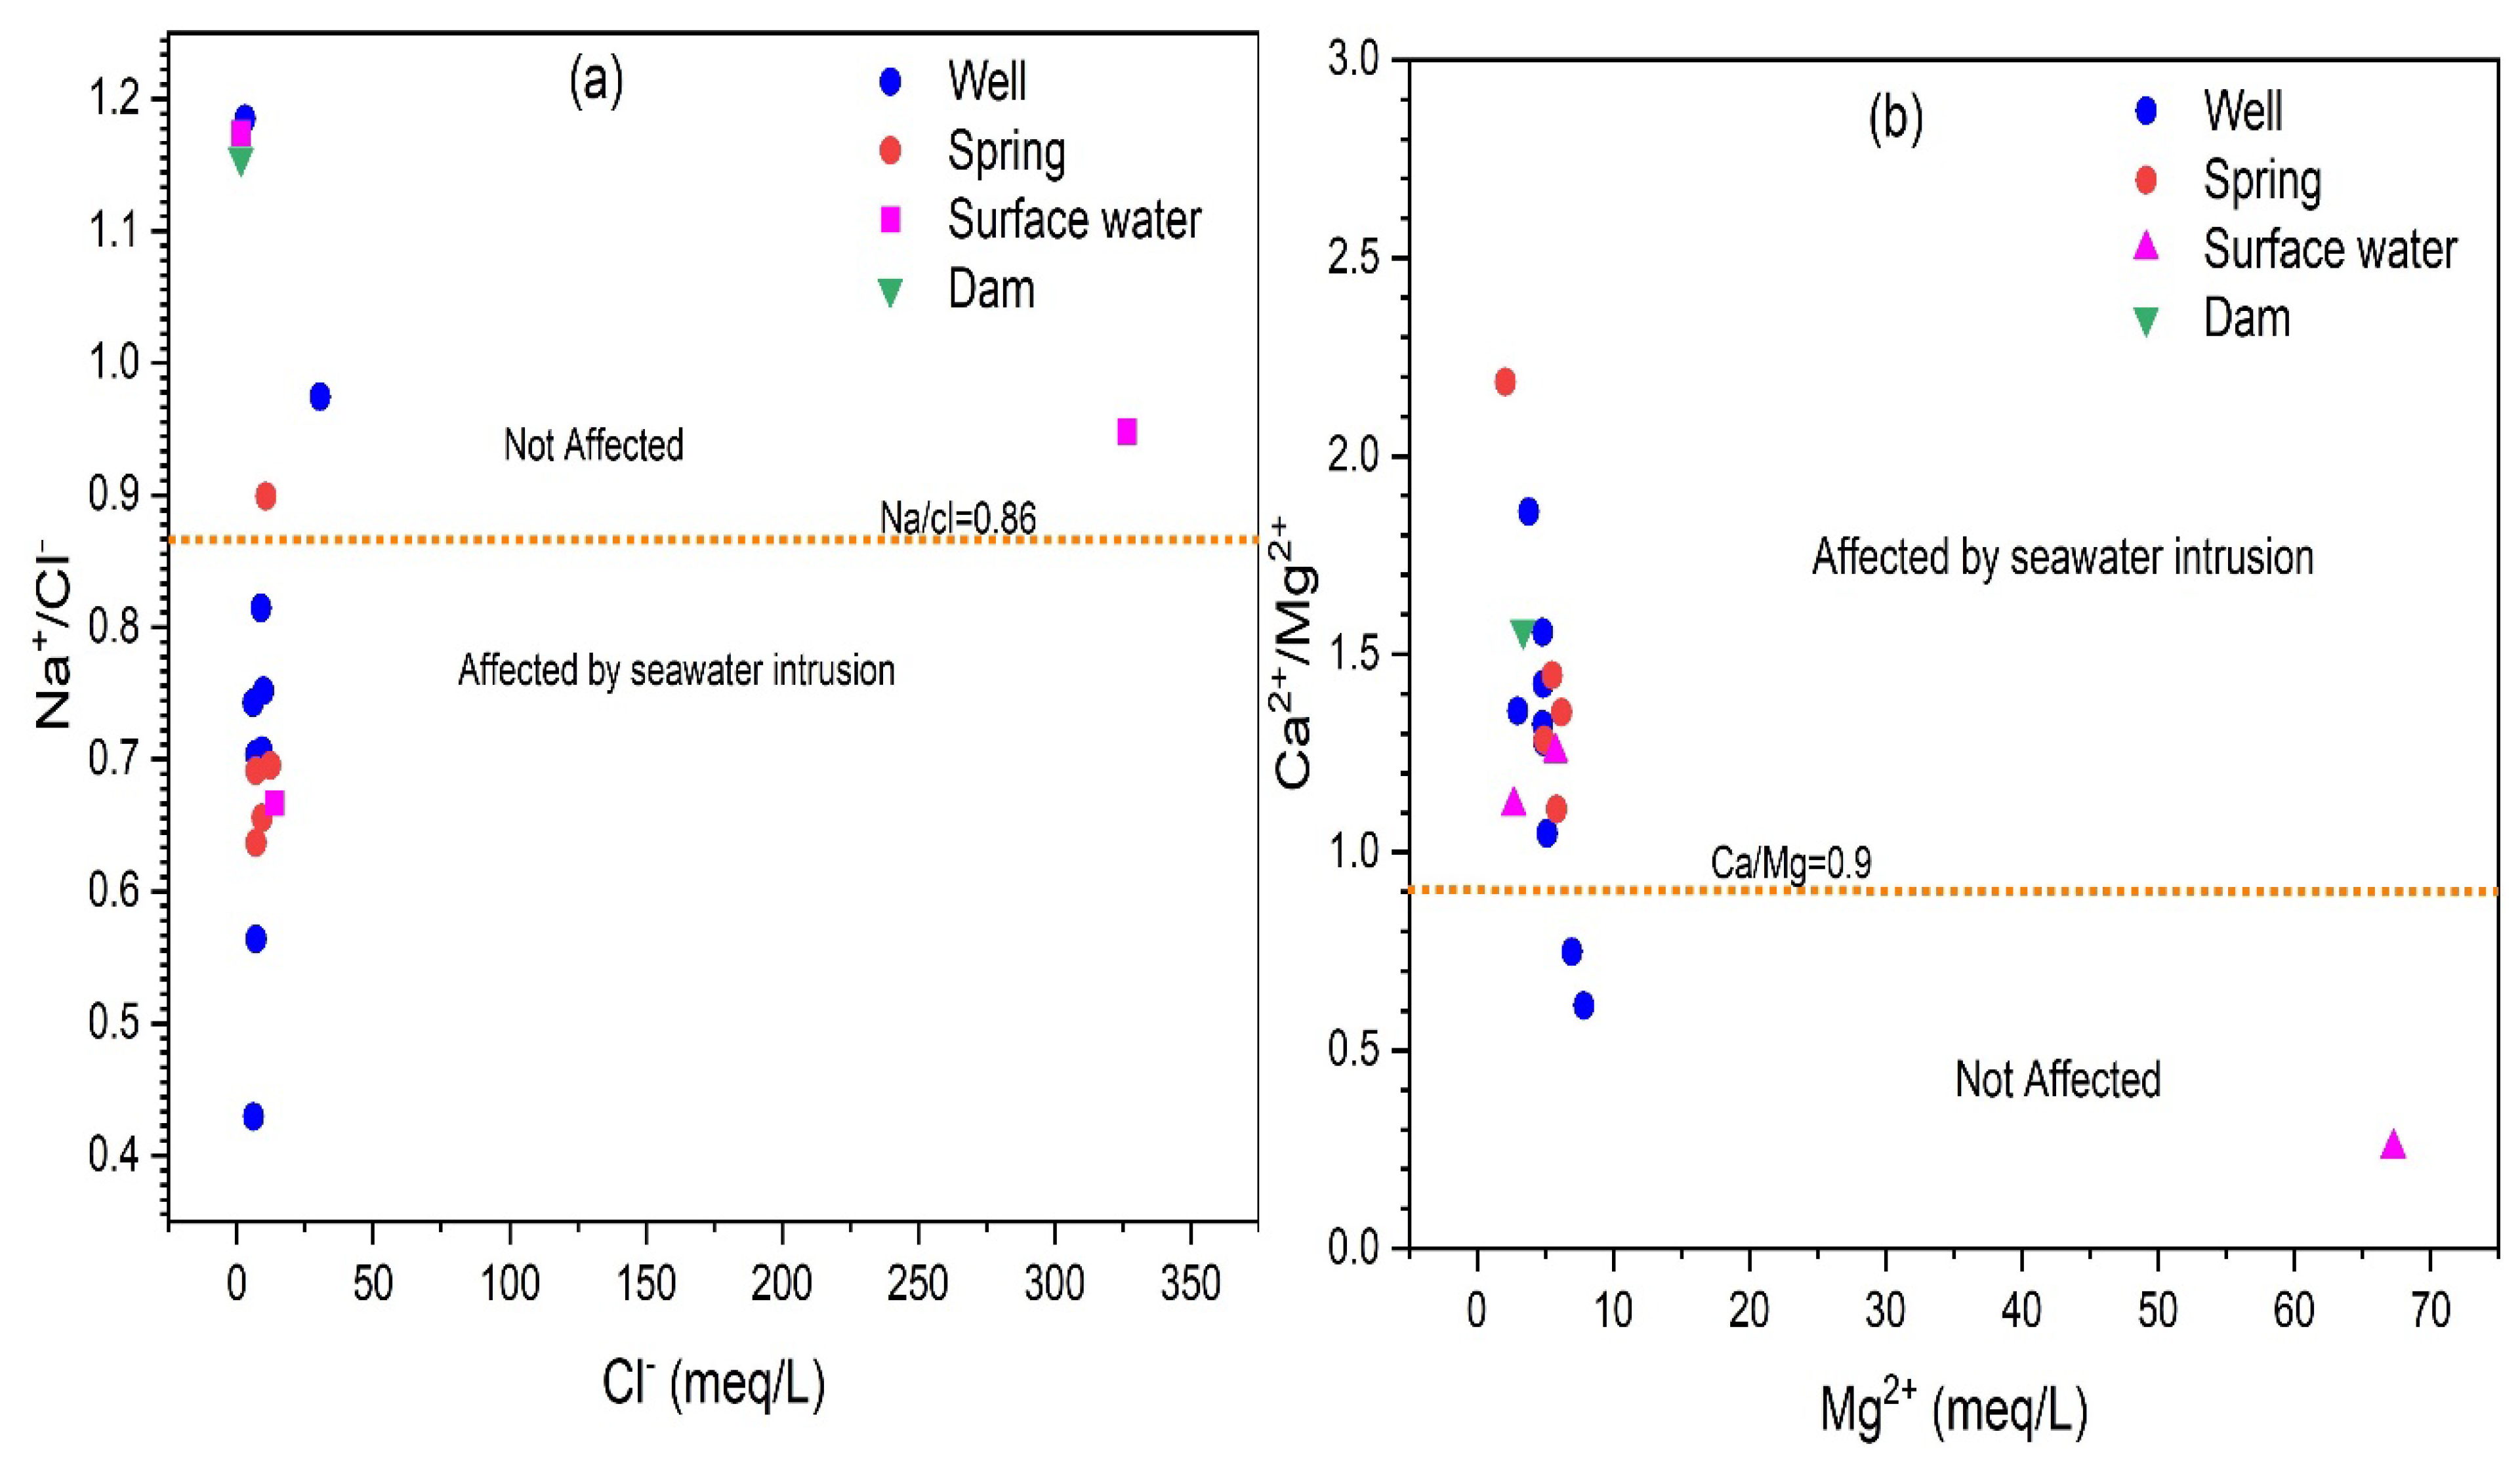
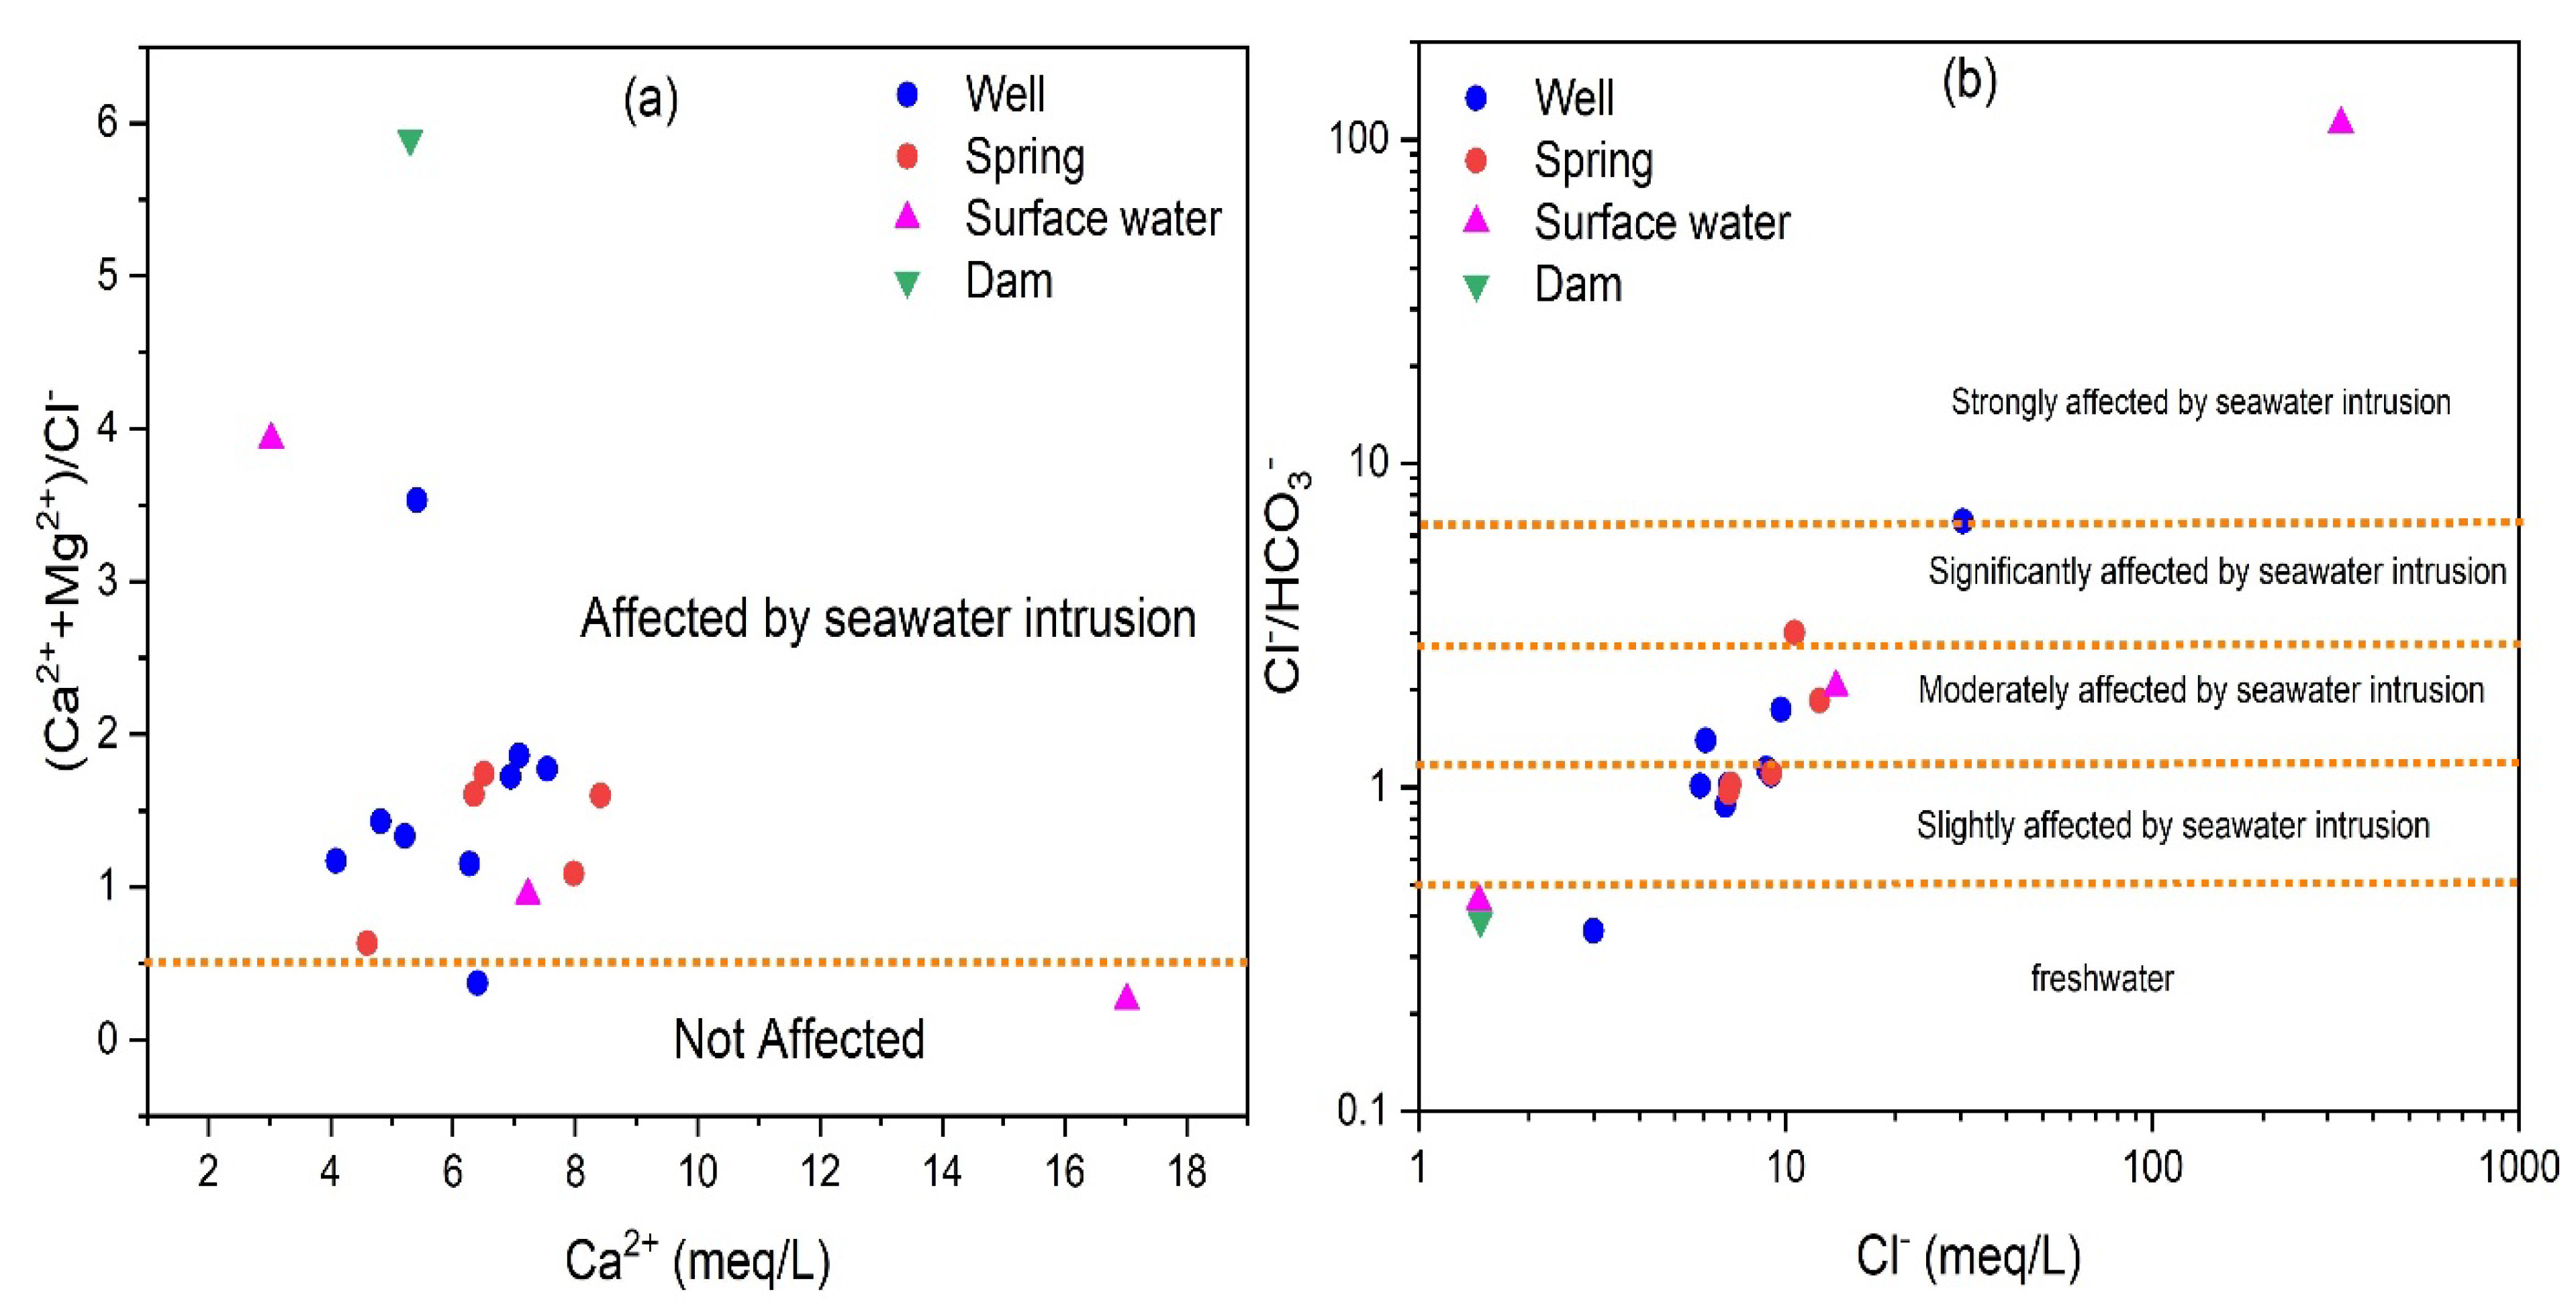
4.8. Groundwater and Saline Water Interaction in the Hauterivian Aquifer
4.9. Groundwater Quality Assessment
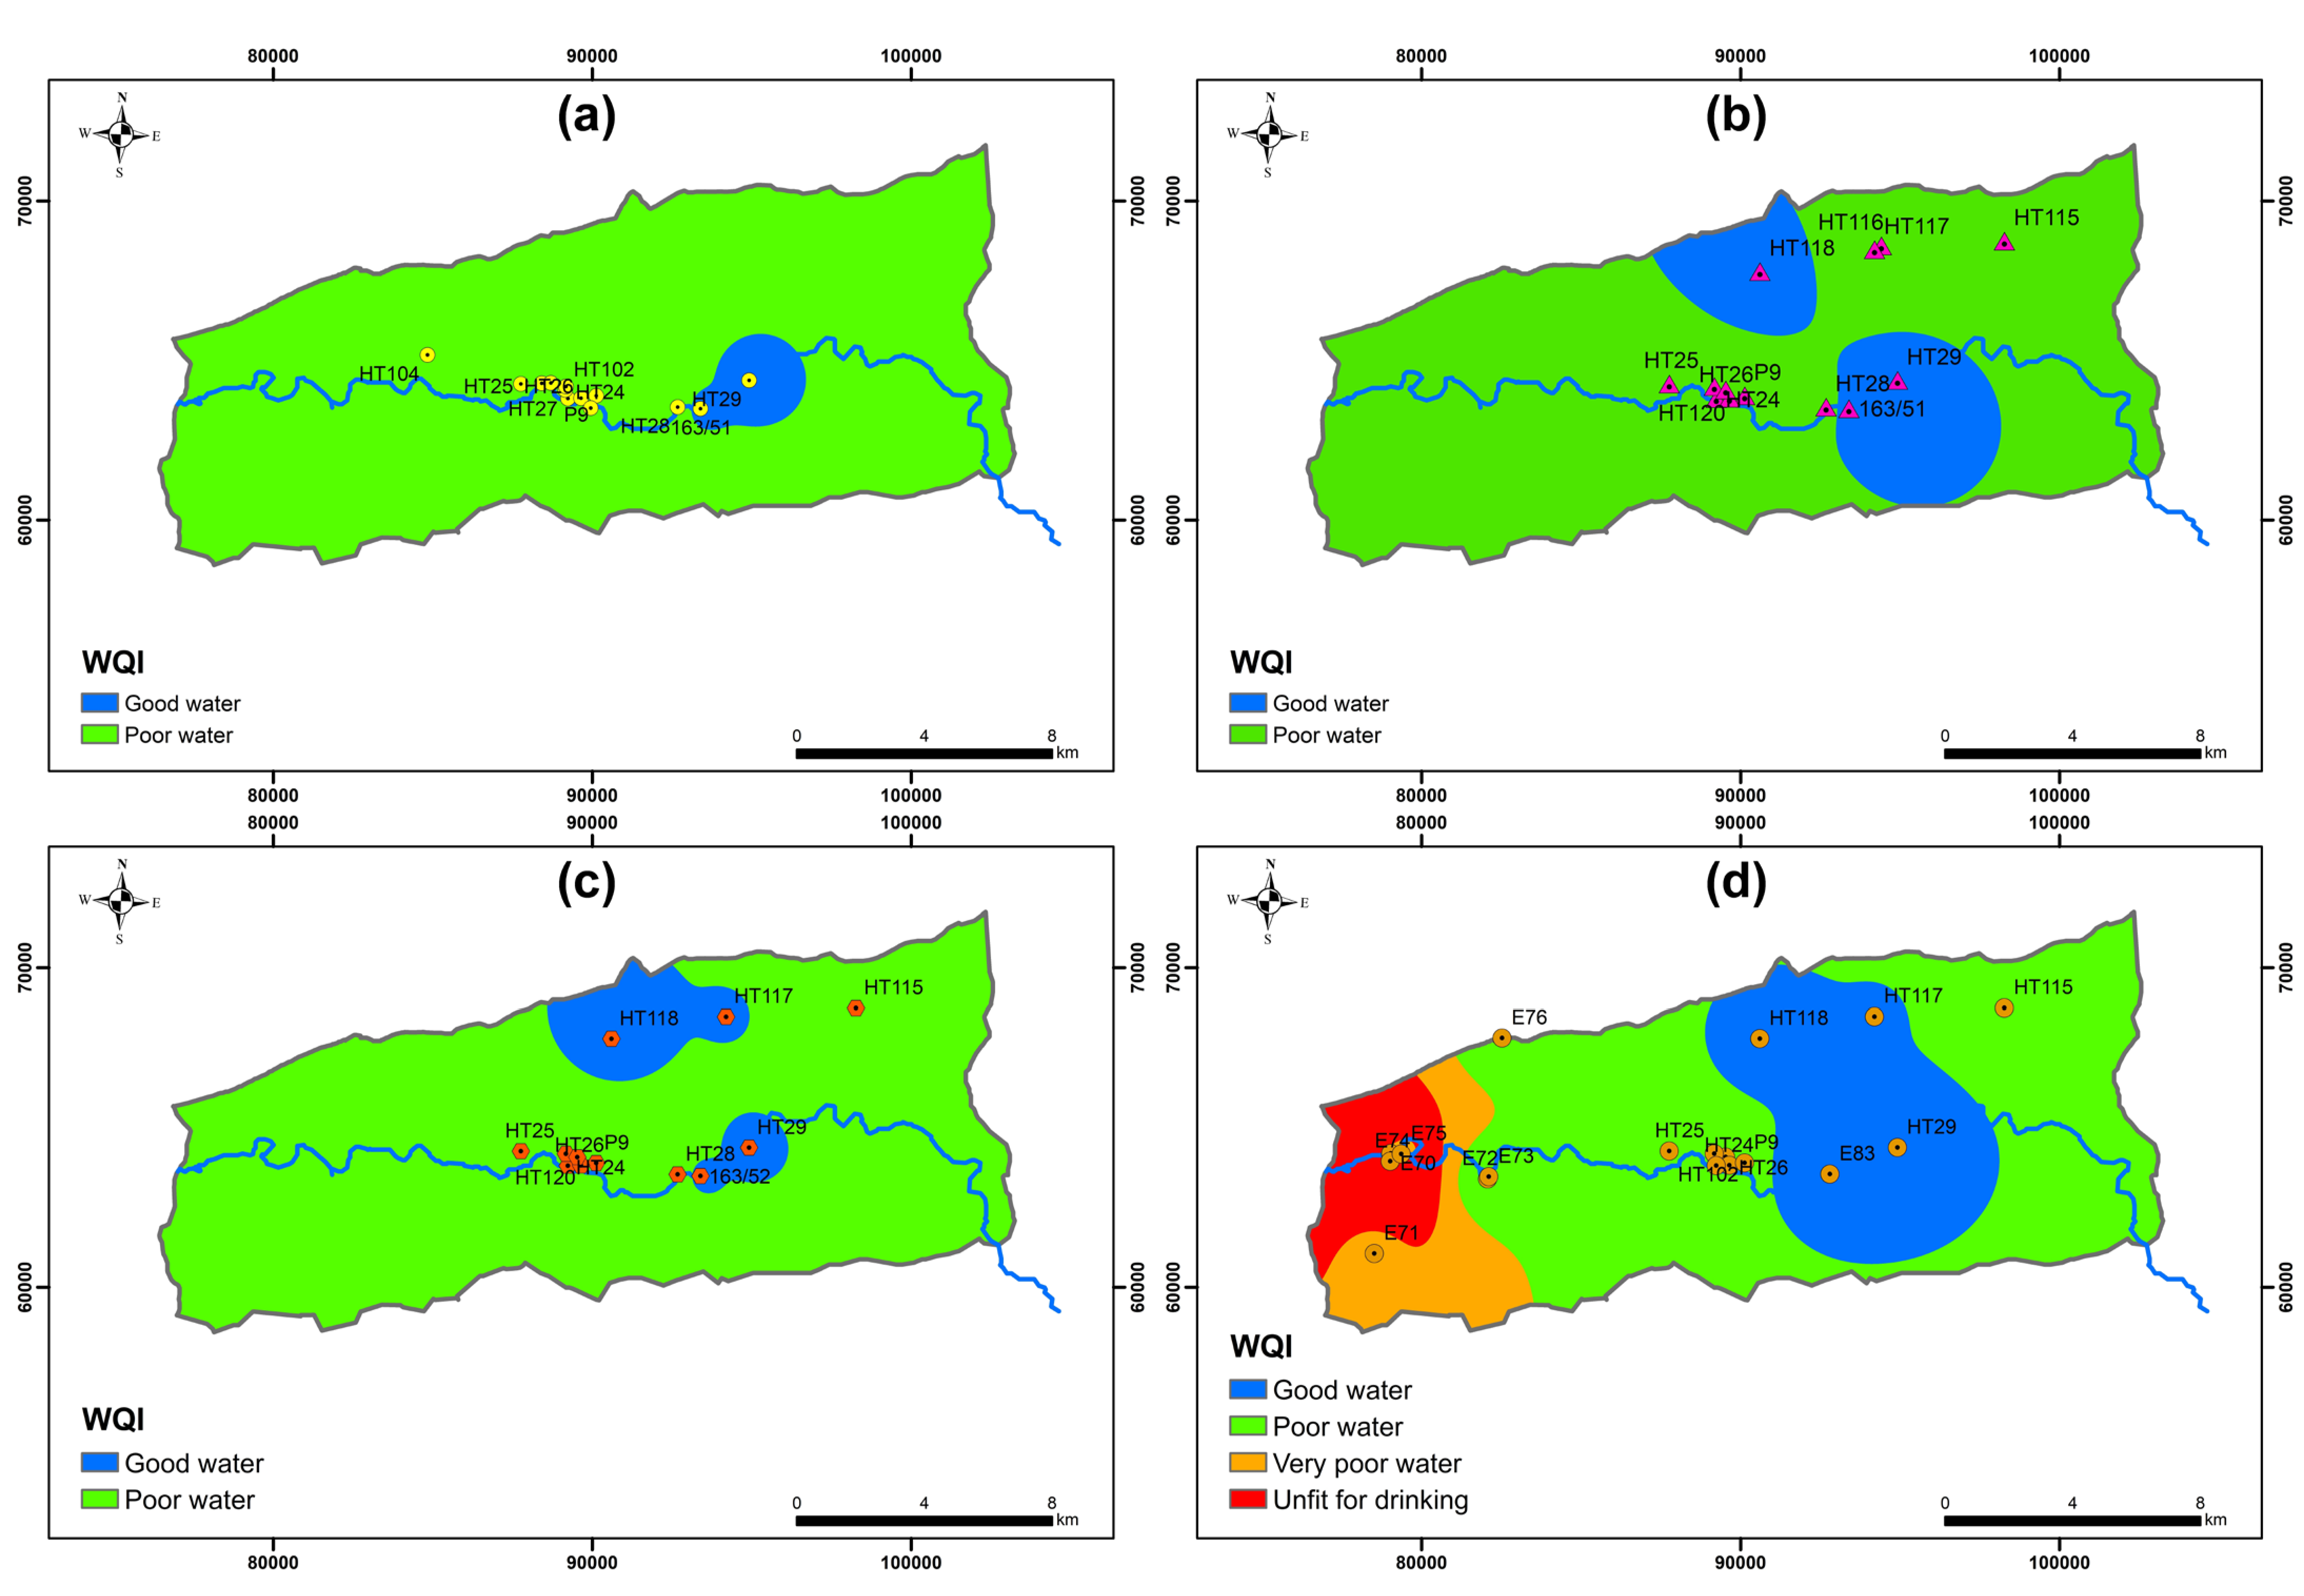
4.9.1. Water Quality for Drinking Purposes
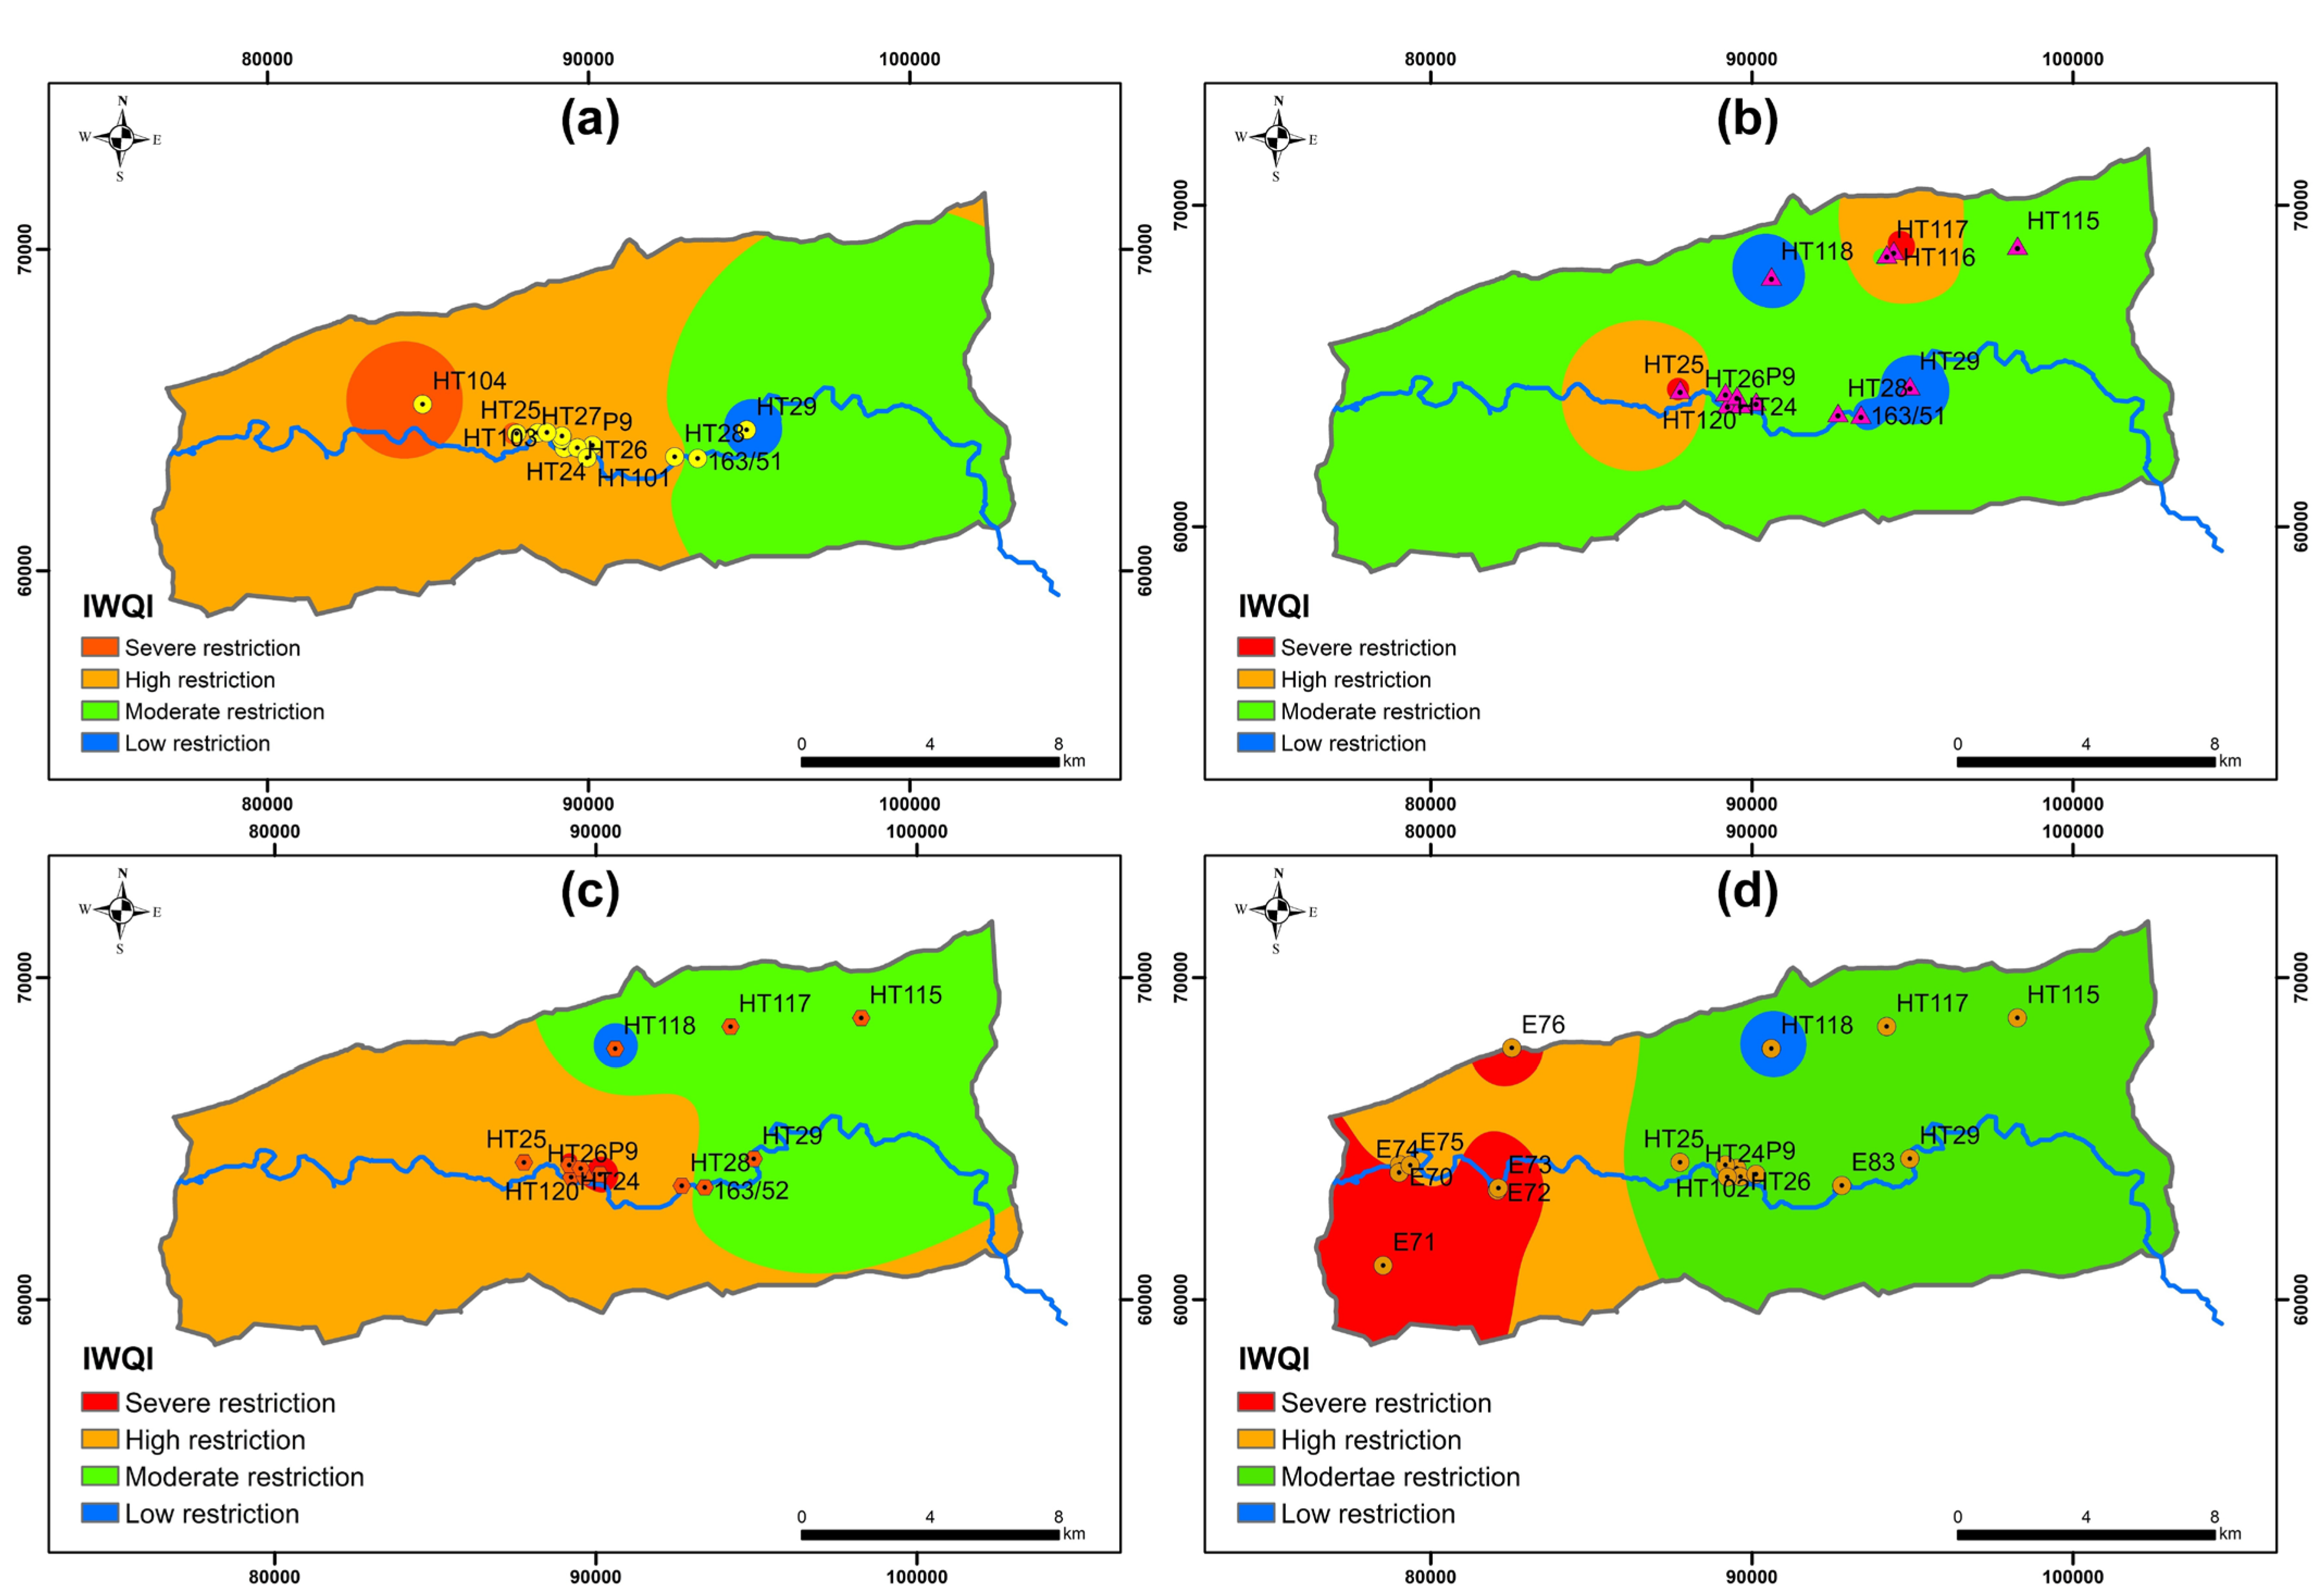
4.9.2. Water Quality for Irrigation Purposes
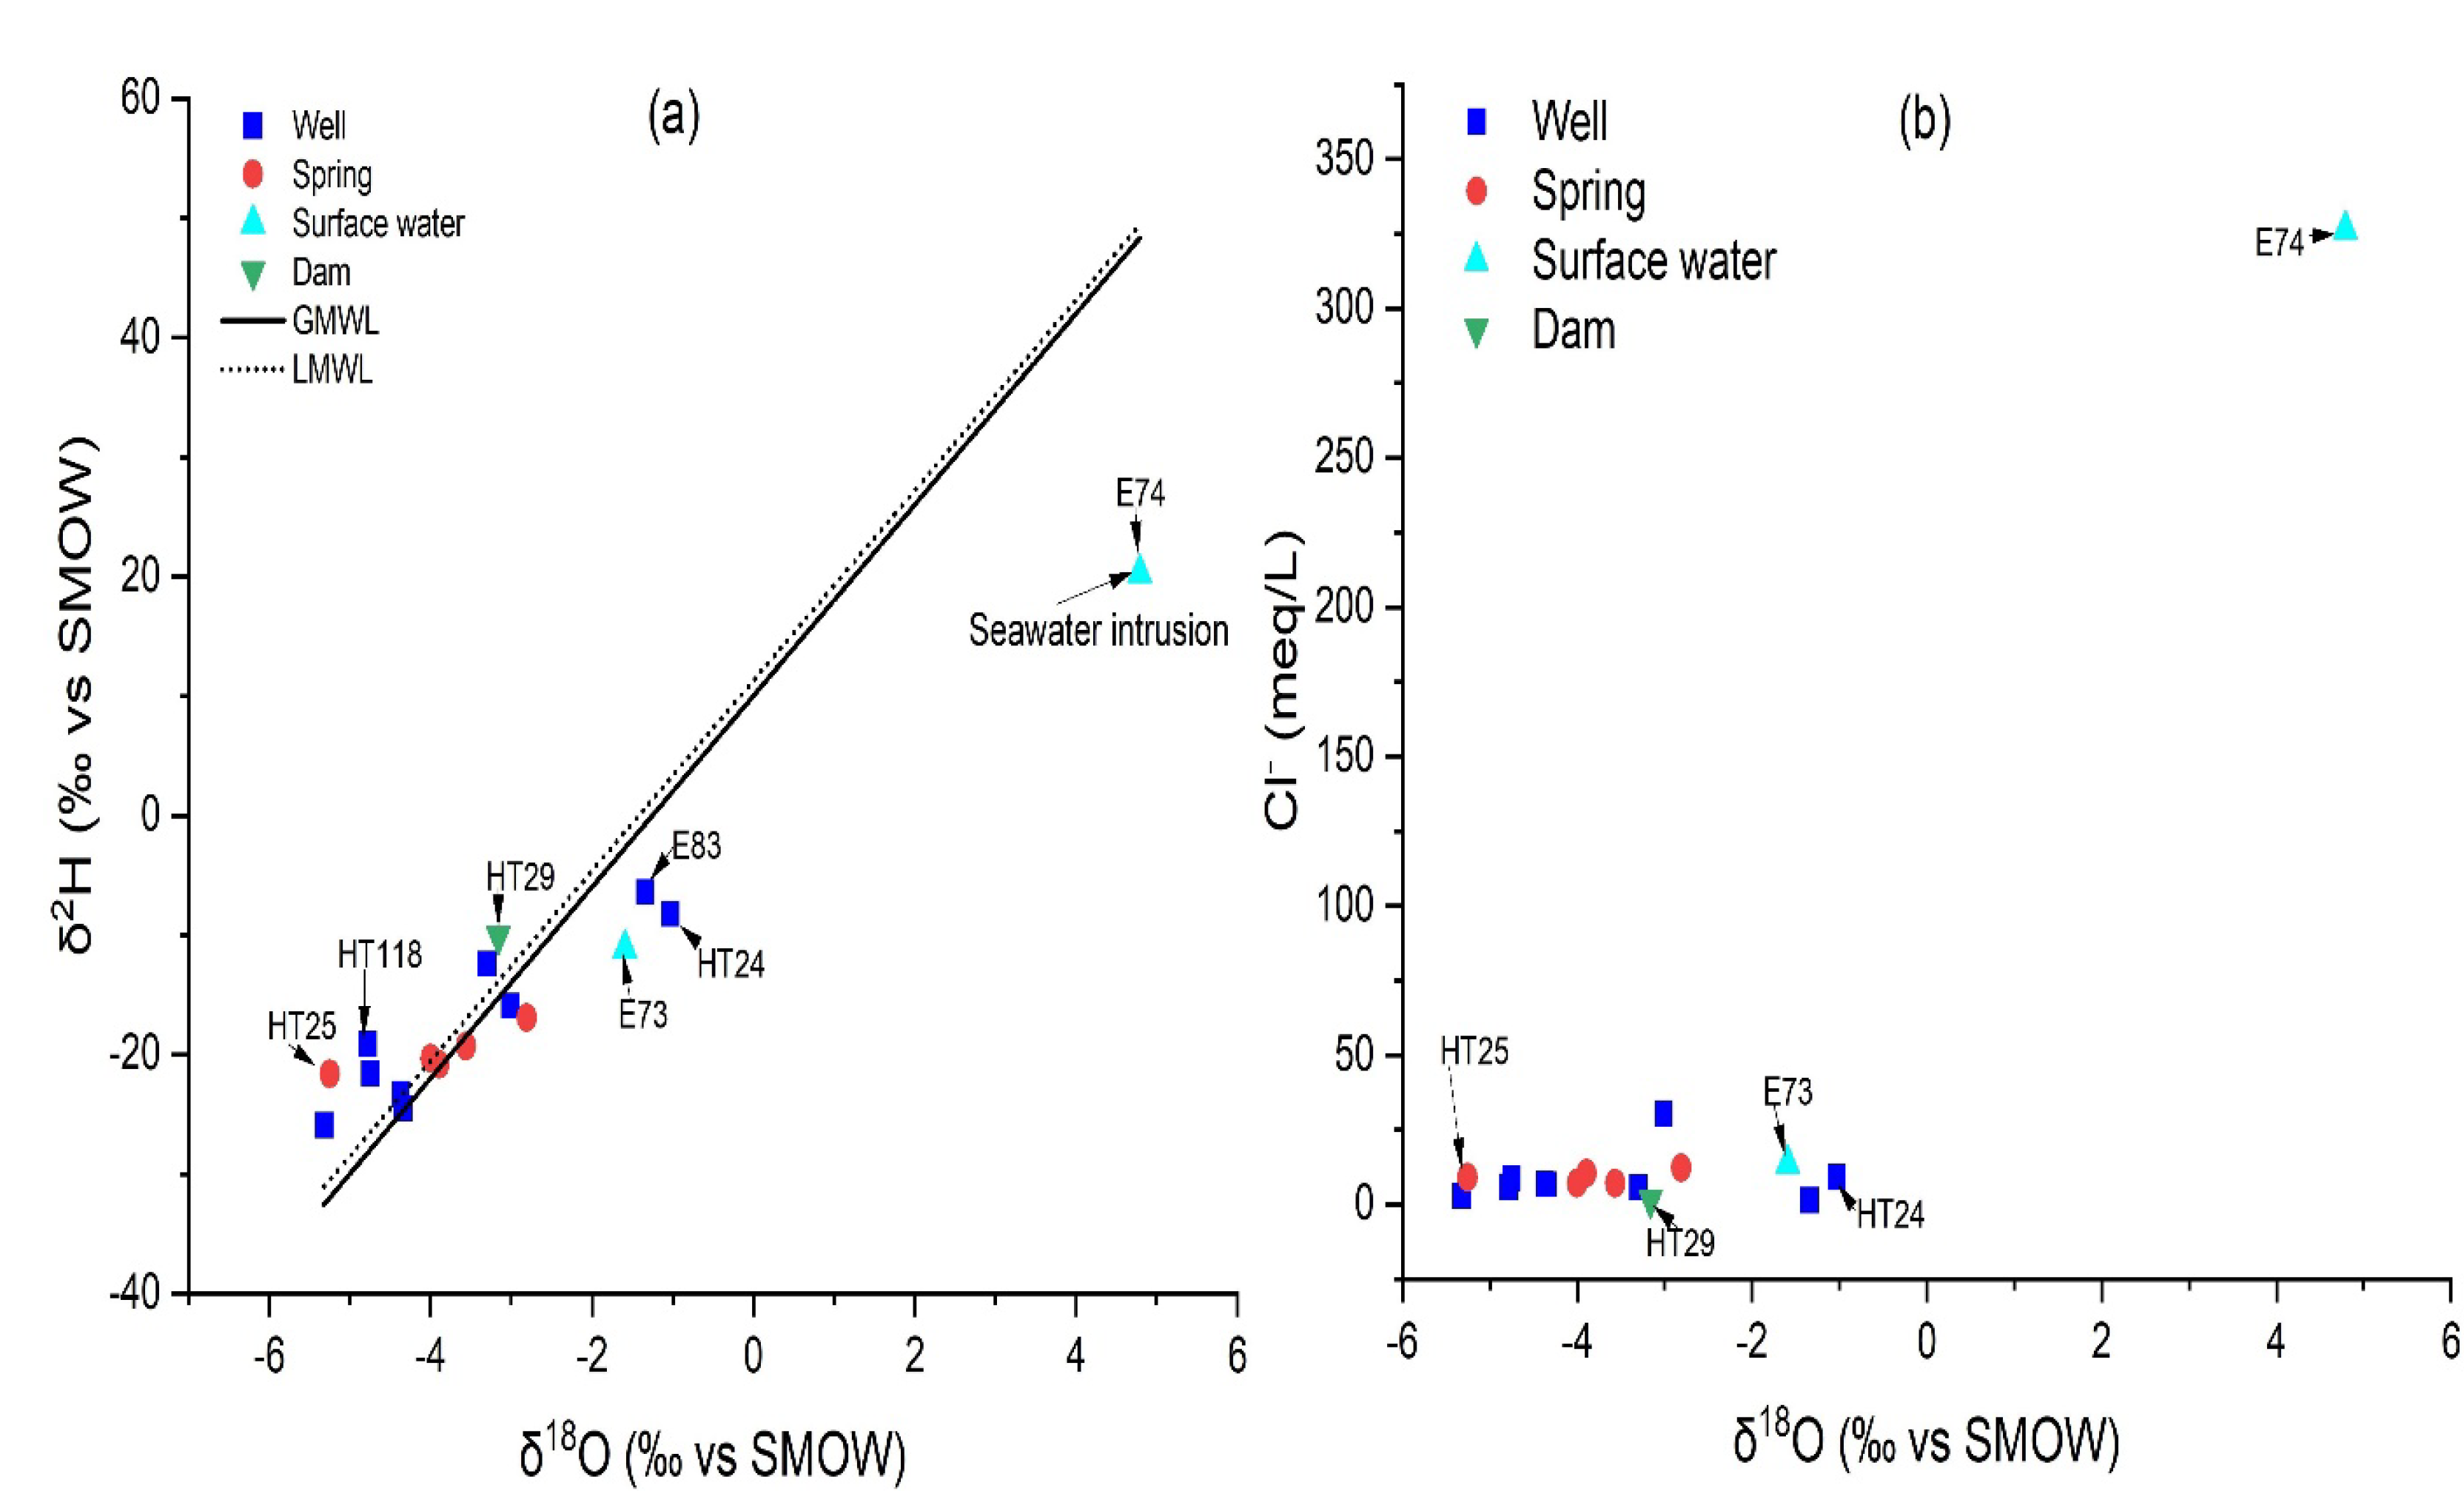
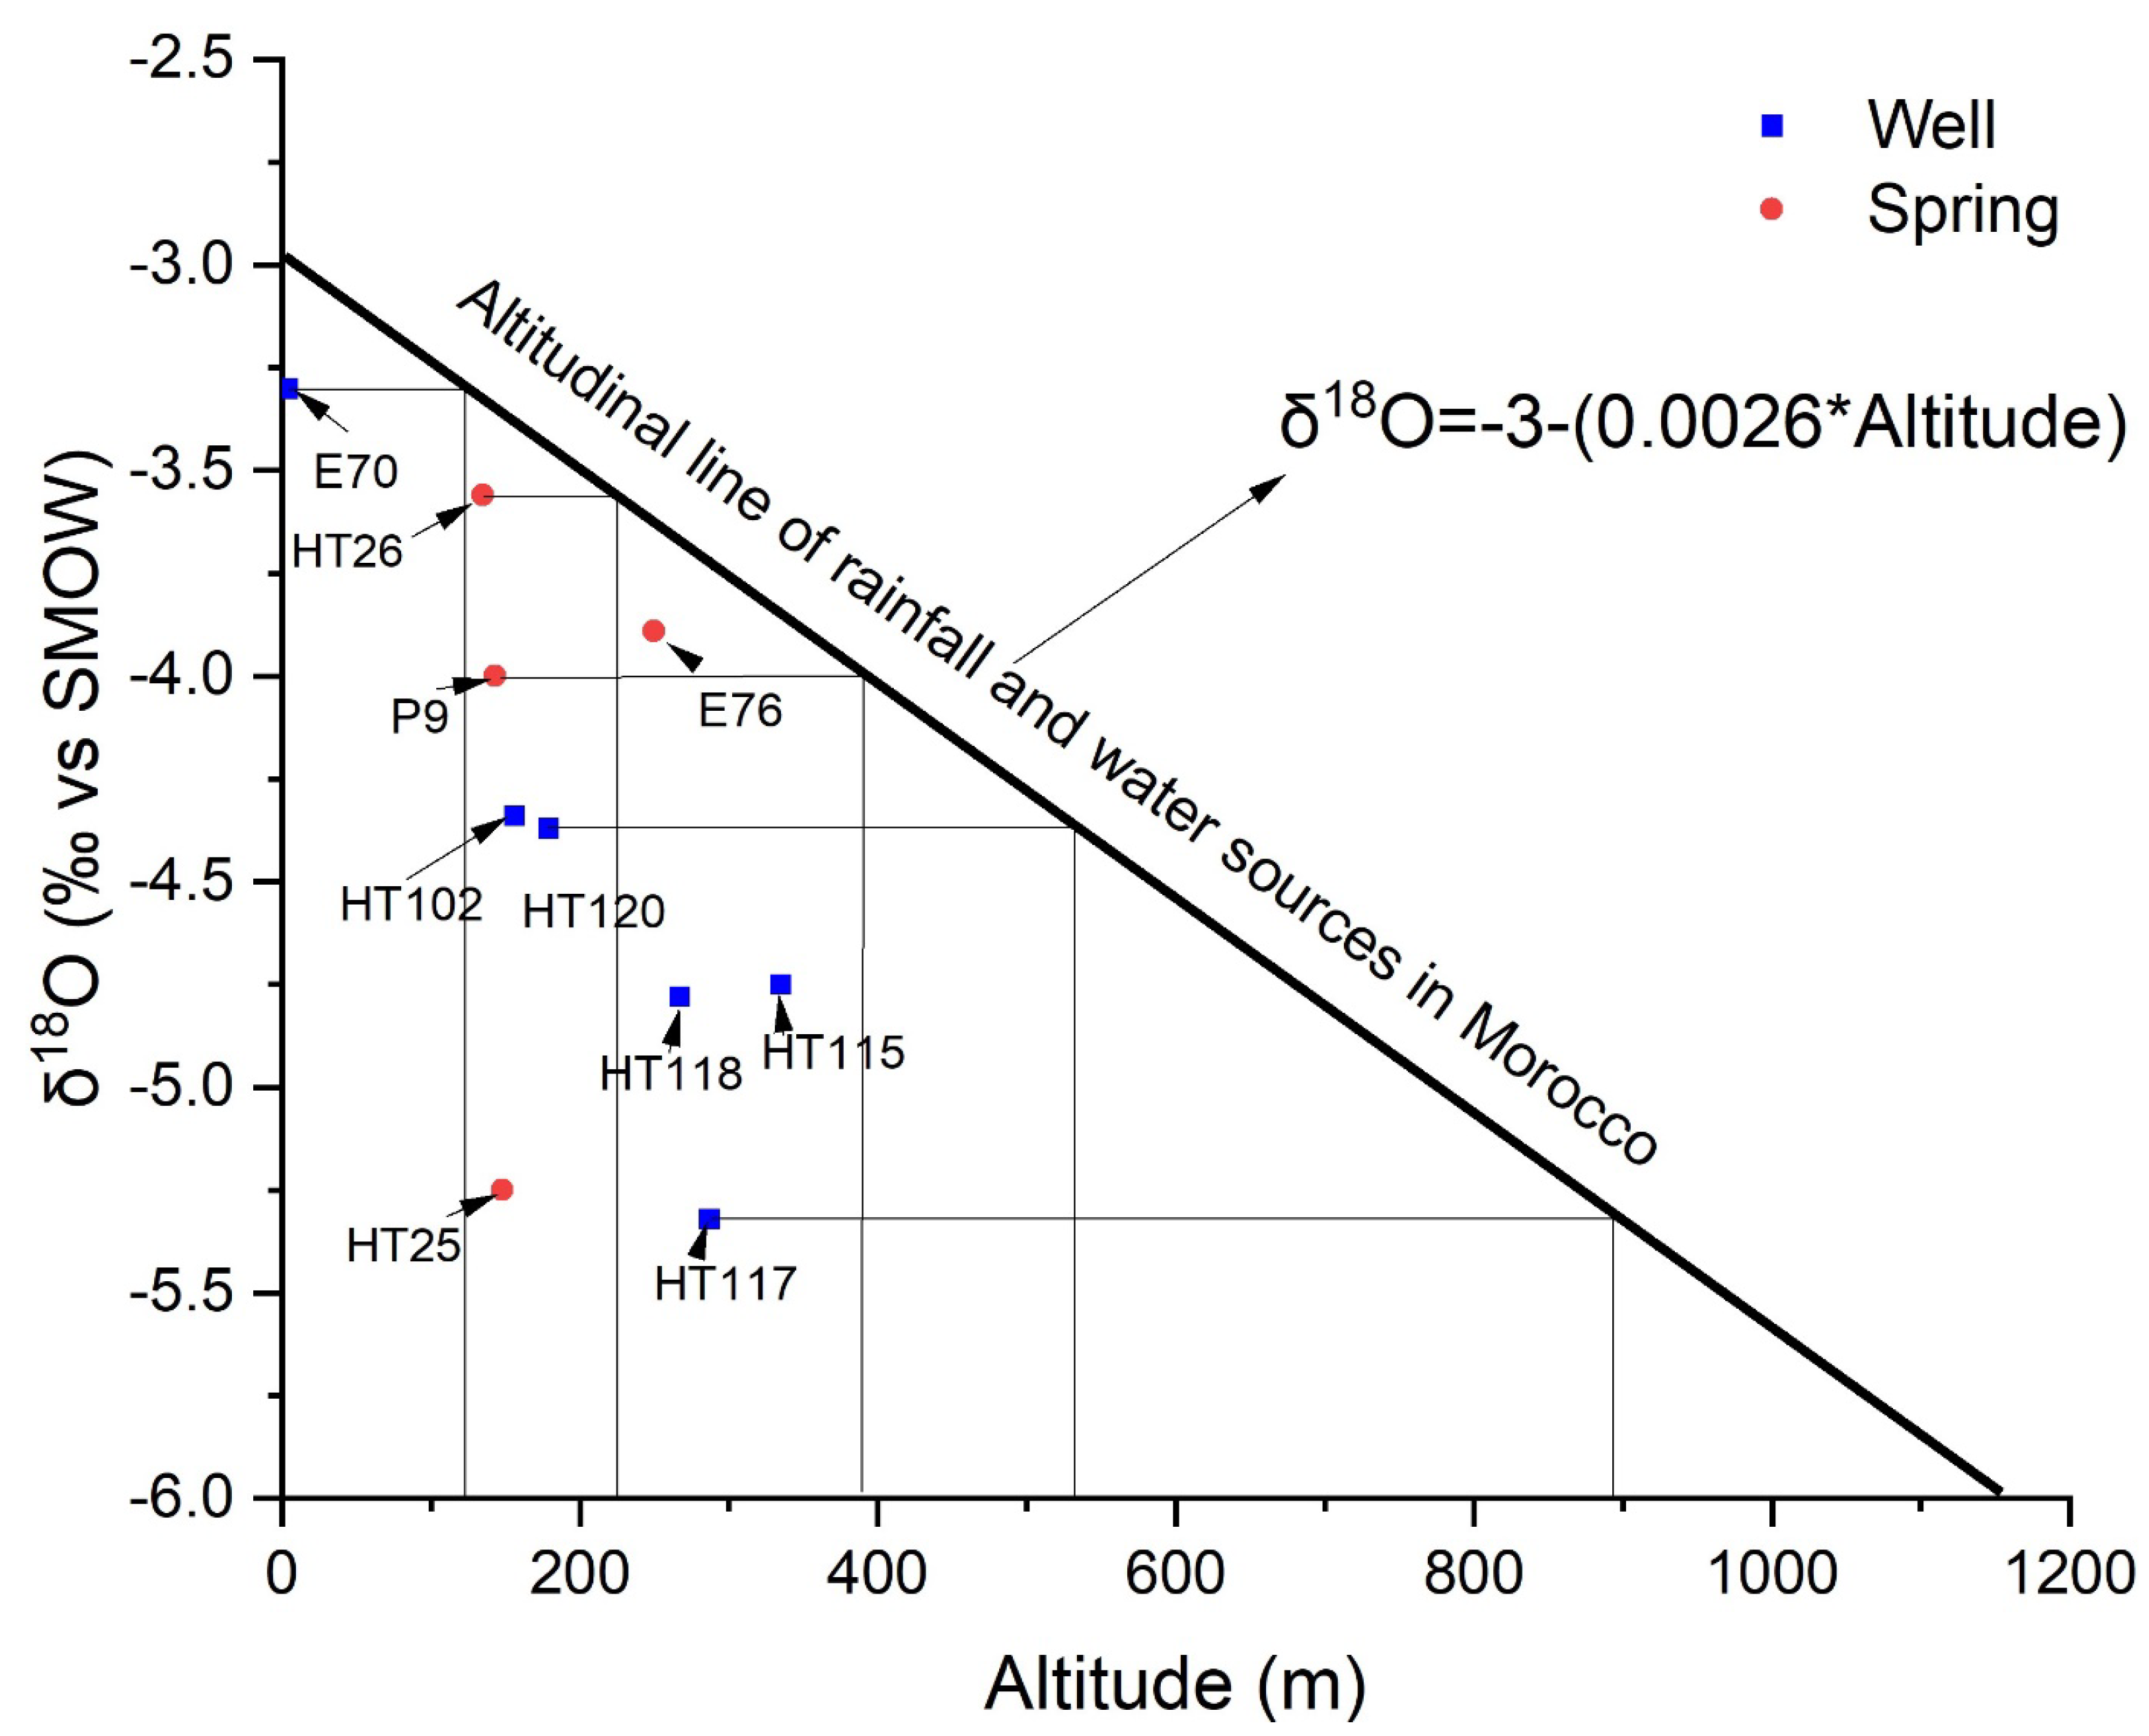
4.10. Origin, Modes, and Elevation of Groundwater Recharge in the Hauterivian Aquifer
5. Conclusions
Supplementary Materials
Author Contributions
Funding
Data Availability Statement
Acknowledgments
Conflicts of Interest
References
- Bahir, M.; Carreira, P.; Da Silva, M.O.; Fernandes, P. Caractérisation hydrodynamique. hydrochimique et isotopique du système aquifère de Kourimat (Bassin d’Essaouira. Maroc). Estud. Geológicos. 2008, 64, 61–73. [Google Scholar] [CrossRef]
- Bahir, M.; El Mountassir, O.; Ouazar, D.; Carreira, P.M. Hydrochemical Analysis and Evaluation of Groundwater Quality in Ouazi Basin (Essaouira. Morocco). In Advances in Geoethics and Groundwater Management: Theory and Practice for a Sustainable Development; Advances in Science, Technology & Innovation (IEREK Interdisciplinary Series for Sustainable Development); Abrunhosa, M., Chambel, A., Peppoloni, S., Chaminé, H.I., Eds.; Springer: Cham, Switzerland, 2021. [Google Scholar] [CrossRef]
- Bahir, M.; EL Mountassir, O.; Chehbouni, A.; El Jiar, H.; Carreira, P.M. Hydrogeochemical and isotopic assessment for characterizing groundwater quality and recharge processes in the Essaouira Basin. Northwestern Morocco. Arab. J. Geosci. 2022, 15, 603. [Google Scholar] [CrossRef]
- Carreira, P.M.; Marques, J.M.; Nunes, D. Source of groundwater salinity in coastline aquifers based on environmental isotopes (Portugal): Natural vs. human interference. A review and reinterpretation. Appl. Geochem. 2017, 41, 163–175. [Google Scholar] [CrossRef]
- El Mountassir, O.; Bahir, M.; Ouazar, D.; Chehbouni, A.; Carreira, P.M. Temporal and spatial assessment of groundwater contamination with nitrate using nitrate pollution index (NPI). groundwater pollution index (GPI). and GIS (case study: Essaouira basin. Morocco). Environ. Sci. Pollut. Res. 2022, 17, 17132–17149. [Google Scholar] [CrossRef]
- El Mountassir, O.; Bahir, M.; Ouazar, D.; Chehbouni, A.; Carreira, P.M. Evaluation of nitrate source and its distribution in the groundwater of Essaouira basin. Water Resour. Manag. 2022, 8, 28. [Google Scholar] [CrossRef]
- Krishan, G.; Sejwal, P.; Bhagwat, A.; Prasad, G.; Yadav, B.K.; Kumar, C.P.; Kansal, M.L.; Singh, S.; Sudarsan, N.; Bradley, A.; et al. Role of ion chemistry and hydro-geochemical processes in aquifer salinization—A case study from a semi-arid region of Haryana, India. Water 2021, 13, 617. [Google Scholar] [CrossRef]
- Krishan, G.; Vashisht, R.; Sudarsan, N.; Rao, M.S. Groundwater salinity and isotope characterization: A case study from South-West Punjab, India. Environ. Earth Sci. 2021, 80, 169. [Google Scholar] [CrossRef]
- Amiri, V.; Sohrabi, N.; Dadgar, M.A. Evaluation of groundwater chemistry and its suitability for drinking and agricultural uses in the Lenjanat plain. central Iran. Environ. Earth Sci. 2015, 74, 6163–6176. [Google Scholar] [CrossRef]
- Meireles, A.; Andrade, E.M.; Chaves, L.; Frischkorn, H.; Crisostomo, L.A. A new proposal of the classification of irrigation water. Rev. Ciência Agronômica. 2010, 41, 349–357. [Google Scholar] [CrossRef]
- Saeedi, M.; Abessi, O.; Sharif, F.; Meraji, H. Development of groundwater quality index. Environ. Monit. Assess. 2010, 163, 327–335. [Google Scholar] [CrossRef]
- Barlow, P.M.; Reichard, E.G. Saltwater intrusion in coastal regions of North America. Hydrogeol. J. 2010, 18, 247–260. [Google Scholar] [CrossRef]
- Behera, A.K.; Chakrapani, G.J.; Kumar, S.; Rai, N. Identification of seawater intrusion signatures through geochemical evolution of groundwater: A case study based on coastal region of the Mahanadi delta. Bay of Bengal. India. Nat. Hazards 2019, 97, 1209–1230. [Google Scholar] [CrossRef]
- Bear, J.; Cheng, A.H.D.; Sorek, S.; Ouazar, D.; Herrera, I. (Eds.) Seawater Intrusion in Coastal Aquifers: Concepts, Methods and Practices; Springer Science & Business Media: Dordrecht, The Netherlands, 1999. [Google Scholar]
- Bahir, M.; El Moukhayar, R.; Chamchati, H.; Youbi, N.; Carreira, P.; Chkir, N. Recharge and hydrogeochemical evolution groundwater in semi-arid zone (Essaouira Basin, Morocco). J. Resour. Dev. Manag.-Open Access Int. J. 2014, 3, 30–48. [Google Scholar]
- Chamchati, H.; Bahir, M. Contributions of climate change on water resources in semi-arid areas; example of the Essaouira Basin (Morocco) ”. Am. J. Sci. Ind. Res. (AJSIR) 2011, 2, 209–215. [Google Scholar] [CrossRef]
- Chamchati, H.; Bahir, M. Potential hydrogeological, environment and vulnerability to pollution of the Plio-Quaternary aquifers of the coastal basin of Essaouira (Morocco). J. Environ. Earth Sci. 2013, 3, 170–185. [Google Scholar]
- Bahir, M.; Chkir, N.; Trabelsi, R.; Hadjammar, F.; Zouari, K.; Chamchati, H. Hydro-geochemical behaviour of two coastal aquifers under severe climatic and human constraints: Comparative study between Essaouira basin in Morocco and Jeffara basin in Tunisia. Int. J. Hydrol. Sci. Tech. 2012, 2, 75–100. [Google Scholar] [CrossRef]
- El Mountassir, O.; Ouazar, D.; Bahir, M.; Chehbouni, A.; Carreira, P.M. GIS-based assessment of aquifer vulnerability using DRASTIC model and stable isotope: A case study on Essaouira basin. Arab. J. Geosci. 2021, 14, 321. [Google Scholar] [CrossRef]
- El Mountassir, O.; Bahir, M.; Ouazar, D.; Carreira, P.M. Nitrate pollution in groundwater of the Ouazi Basin: Case of Essaouira (Southwestern Morocco). In Advances in Geoethics and Groundwater Management: Theory and Practice for a Sustainable Development; Springer: Cham, Switzerland, 2021; pp. 239–245. [Google Scholar] [CrossRef]
- El Mountassir, O.; Bahir, M.; Ouazar, D.; Carreira, P.M. For a better understanding of recharge and salinization mechanism of a Cenomanian–Turonian aquifer. In Advances in Geoethics and Groundwater Management: Theory and Practice for a Sustainable Development; Springer: Cham, Switzerland, 2021; pp. 201–206. [Google Scholar] [CrossRef]
- EL Mountassir, O.; Bahir, M.; Ouazar, D.; Chehbouni, A.; Carreira, P.M. Geochemical and isotopic evidence of groundwater salinization processes in the Essaouira region. north-west coast. Morocco. SN Appl. Sci. 2021, 3, 698. [Google Scholar] [CrossRef]
- Brown, R.M.; McClelland, N.I.; Deininger, R.A.; Tozer, R.G. A water quality index-do we dare. Water Sew. Work. 1970, 117, 10. [Google Scholar]
- Kaushal, S.S.; Groffman, P.M.; Likens, G.E.; Belt, K.T.; Stack, W.P.; Kelly, V.R.; Band, L.E.; Fisher, G.T. Increased salinization of fresh water in the northeastern United States. Proc. Natl. Acad. Sci. USA 2005, 102, 13517–13520. [Google Scholar] [CrossRef]
- Williams, W.D. Anthropogenic salinisation of inland waters. In Saline Lakes; Springer: Dordrecht, The Netherlands, 2001; pp. 329–337. [Google Scholar]
- Kumar, B. Integrated hydrogeochemical. isotopic and geomorphological depiction of the groundwater salinization in the aquifer system of Delhi. India. J. Asian Earth Sci. 2015, 111, 936–947. [Google Scholar] [CrossRef]
- Bouaicha, F.; Dib, H.; Belkhiri, L.; Manchar, N.; Chabour, N. Hydrogeochemistry and geothermometry of thermal springs from the Guelma region. Algeria. J. Geol. Soc. India. 2017, 90, 226. [Google Scholar] [CrossRef]
- Bouchaou, L.; Michelot, J.L.; Chauve, P.; Mania, J.; Mudry, J. Apports des isotopes stables à l’étude des modalités d’alimentation des aquifères du Tadla (Maroc) sous climat semi-aride. Comptes Rendus L’académie Sci. Série 2 Sci. Terre Planètes 1995, 320, 95–101. [Google Scholar]
- Jamaa, H.; El Achheb, A.; Namr, K.I. Spatial variation of groundwater quality and assessment of water table fluctuations in Plio-Quaternary aquifer formations in Doukkala Plain. Morocco. Groundw. Sustain. Dev. 2020, 11, 100398. [Google Scholar] [CrossRef]
- El Yousfi, Y.; Himi, M.; El Ouarghi, H.; Elgettafi, M.; Benyoussef, S.; Gueddari, H.; Aqnouy, M.; Salhi, A.; Alitane, A. Hydrogeochemical and statistical approach to characterize groundwater salinity in the Ghiss-Nekkor coastal aquifers in the Al Hoceima province. Morocco. Groundw. Sustain. Dev. 2022, 19, 100818. [Google Scholar] [CrossRef]
- Bouaissa, M.; Gharibi, E.; Ghalit, M.; Taupin, J.D.; El Khattabi, J. Identifying the origin of groundwater salinization in the Bokoya massif (central Rif. northern Morocco) using hydrogeochemical and isotopic tools. Groundw. Sustain. Dev. 2021, 14, 100646. [Google Scholar] [CrossRef]
- Berdai, H. Synthèse des Travaux Réalisés au Maroc sur la Pollution Nitrique des Eaux Souterraines; Division des Etudes. Service des Expérimentations des Essais et de la Normalisation: Rabat, Morocco, 1997. [Google Scholar]
- Belkhiri, L.; Boudoukha, A.; Mouni, L.; Baouz, T. Multivariate statistical characterization of groundwater quality in Ain Azel plain. Algeria. Afr. J. Environ. Sci. Technol. 2010, 4, 526–535. [Google Scholar]
- Taiwo, A.M. Source identification and apportionment of pollution sources to groundwater quality in major cities in Southwest. Nigeria. Geofizika 2012, 29, 157–174. [Google Scholar]
- Awomeso, J.A.; Taiwo, A.M.; Alade-Dauda, O.F.; Ojekunle, Z.O.; Oyebanji, F.F.; Ayantobo, O.O.; Taiwo, O.T. Pollution sources of groundwater quality in the basement rocks in Oyo State. Nigeria. using multivariate statistics. Fresenius Environ. Bull. 2016, 25, 2284–2291. [Google Scholar]
- Varol, M.; Gökot, B.; Bekleyen, A.; Sen, B. Water quality assessment and apportionment of pollution sources of Tigris river (turkey) using multivariate statistical techniques: A case study. River Resour. Appl. 2012, 28, 1428–1438. [Google Scholar] [CrossRef]
- Krishan, G.; Rao, M.S.; Vashisht, R.; Chaudhary, A.; Singh, J.; Kumar, A. Isotopic assessment of groundwater salinity: A case study of the Southwest (SW) Region of Punjab, India. Water 2022, 14, 133. [Google Scholar] [CrossRef]
- Krishan, G.; Kumar, B.; Sudarsan, N.; Rao, M.S.; Ghosh, N.C.; Taloor, A.K.; Bhattacharya, P.; Singh, S.; Kumar, C.P.; Sharma, A.; et al. Isotopes (δ18O, δD and 3H) variations in groundwater with emphasis on salinization in the state of Punjab, India. Sci. Total Environ. 2021, 789, 148051. [Google Scholar] [CrossRef] [PubMed]
- Krishan, G.; Prasad, G.; Kumar, C.P.; Patidar, N.; Yadav, B.K.; Kansal, M.L.; Singh, S.; Sharma, L.M.; Bradley, A.; Verma, S.K. Identifying the seasonal variability in source of groundwater salinization using deuterium excess-a case study from Mewat, Haryana, India. J. Hydrol. Reg. Stud. 2020, 31, 100724. [Google Scholar] [CrossRef]
- El Mountassir, O.; Bahir, M.; Chehbouni, A.; Dhiba, D.; El Jiar, H. Assessment of Groundwater Quality and the Main Controls on Its Hydrochemistry in a Changing Climate in Morocco (Essaouira Basin). Sustainability 2022, 14, 8012. [Google Scholar] [CrossRef]
- Bahir, M.; EL Mountassir, O.; Ouazar, D.; Chehbouni, A.; Carreira, P.M. Stable isotope and quality of groundwater around Ksob sub-basin, Essaouira, Morocco. Sustain. Water Resour. Manag. 2021, 7, 73. [Google Scholar] [CrossRef]
- Bahir, M.; El Mountassir, O.; Dhiba, D.; Chehbouni, A.; Carreira, P.M.; Elbiar, H. Combining stable isotope and WQI methods to study the groundwater quality: A case study in Essaouira city, Morocco. SN Appl. Sci. 2022, 4, 317. [Google Scholar] [CrossRef]
- Rachida, L.; Mohamed, A.H.; Jaouad, F.M.; Mohammed, B. The modelling of water-logging and salinization in Mediterranean area. Euro. -Mediterr. J. Environ. Integr. 2020, 5, 42. [Google Scholar] [CrossRef]
- Youbi, N.; Mata, J.; Bellieni, G.; Marzoli, A.; Callegaro, S.; Bertrand, H.; Bensalah, K.; Font, E.; Dal Corso, J.; Bahir, M.; et al. Assessing the causes of the End-Triassic biotic crisis, a review. Comun. Geológicas J. 2014, 101, 1473–1476. [Google Scholar]
- Fernandes, P.G.; Carreira, P.; Bahir, M. Mass balance simulation and Principal Components Analysis applied to groundwater resources: Essaouira basin (Morocco). Environ. Earth Sci. 2009, 59, 1475–1484. [Google Scholar] [CrossRef]
- Chkir, N.; Trabelsi, R.; Bahir, M.; Friha, H.A.; Zouari, K.; Chamchati, H.; Monteiro, J.P. Vulnérabilité des ressources en eaux des aquifères côtiers en zones semi-arides—Etude comparative entre les bassins d’Essaouira (Maroc) et de la jeffara (Tunisie). Commun. Geol. 2008, 95, 107–121. [Google Scholar]
- Bouya, B.; Faouzi, M.; Ben Abbou, M.; Essahlaoui, A.; Bahir, M.; Youbi, N.; Hessane, M. The coastal aquifer of Mnasra (Gharb, Morocco): Hydrogeology and hydrodynamic modelling”. Commun. Geol. 2011, 98, 73–81. [Google Scholar]
- Kaid Rassou, K.; Fakir, Y.; Bahir, M.; Zouari, K.; Marah, M.; Monteiro, J.P. Apport des isotopes de l’environnement à la compréhension du fonctionnement des aquifères côtiers du bassin hydrologique de la lagune d’oualidia (littoral atlantique). Commun. Geol. 2006, 92, 129–142. [Google Scholar]
- Laftouhi, N.; Vanclooster, M.; Jalal, M.; Witam, O.; Aboufirassi, M.; Bahir, M.; Persoons, E. Problematic of nitrates groundwater pollution in the Essaouira Basin (Morocco)”. Comptes Rendus L’académie Sci. 2003, 335, 307–317. [Google Scholar]
- Mennani, A.; Blavoux, B.; Bahir, M.; Bellion, Y.; Jalal, M.; Et Daniel, M. Apports des analyses chimiques et isotopiques à la connaissance du fonctionnement des aquifères plio-quaternaire et turonien de la zone synclinale d’Essaouira (Maroc occidental). J. Afr. Earth Sci. 2001, 32, 819–835. [Google Scholar] [CrossRef]
- Jalal, M.; Blavoux, B.; Bahir, M.; Bellion, Y.; Laftouhi, N.E.; Puig, J.M.; Mennani, A.; Daniel, M. Etude du fonctionnement du système aquifère karstique Cénomano-Turonien de l’oued Igrounzar (Bassin d’Essaouira, Maroc). J. Afr. Earth Sci. 2001, 32, 803–817. [Google Scholar] [CrossRef]
- Rassou, K.K.; Fakir, Y.; Bahir, M.; Zouari, K.; Marah, M. Origine et datation des eaux souterraines du bassin hydrologique de la lagune d’Oualidia. Estud. Geol. 2005, 61, 191–196. [Google Scholar] [CrossRef]
- Bahir, M.; Mennani, A.; Jalal, M.; Youbi, N. Contribution à l’étude des ressources hydriques du bassin synclinal d’Essaouira (Maroc). Estud. Geol. 2000, 56, 185–195. [Google Scholar] [CrossRef]
- Rey, J.; Canérot, J.; Peybernès, B.; Taj-Eddine, K.; Thieuloy, J.P. Lithostratigraphy, biostratigraphy and sedimentary dynamics of the Lower Cretaceous deposits on the northern side of the western High Atlas (Morocco). Cretac. Res. 1988, 9, 141–158. [Google Scholar] [CrossRef]
- Bahir, M.; Jalal, M.; Mennani, A. Pollution nitratée des eaux souterraines du bassin synclinal d’Essaouira. J. Environmental Hydrology 2001, 9, 1–9. [Google Scholar]
- DUFFAUD, F. Contribution à l’étude stratigraphique du bassin secondaire du Haut Atlas Occidental (Maroc). Bull. Société Géologique Fr. 1960, 7, 728–734. [Google Scholar] [CrossRef]
- Rodier, J.; Legube, B.; Merlet, N.; Brunet, R. L’analyse de L’eau [Water Analysis]; Dunod: Paris, France, 2009. [Google Scholar]
- Friedman, I. Deuterium content of natural waters and other substances. Geochim. Cosmochim. Acta. 1953, 4, 83–103. [Google Scholar] [CrossRef]
- Epstein, S.; Mayeda, T.K. Variations of the 18o/16O ratio in natural water. Geochim. Cosmochim. Acta. 1953, 4, 213–220. [Google Scholar] [CrossRef]
- Clark, I.D.; Fritz, P. Environmental Isotopes in Hydrogeology. Lewis Publishers: New York, NY, USA, 1997. [Google Scholar]
- Kachroud, M.; Trolard, F.; Kefi, M.; Jebari, S.; Bourrié, G. Water quality indices: Challenges and application limits in the literature. Water 2019, 11, 361. [Google Scholar] [CrossRef]
- Gad, M.; El Osta, M. Geochemical controlling mechanisms and quality of the groundwater resources in El Fayoum Depression. Egypt. Arab. J. Geosci. 2020, 13, 861. [Google Scholar] [CrossRef]
- Adimalla, N.; Li, P.; Venkatayogi, S. Hydrogeochemical evaluation of groundwater quality for drinking and irrigation purposes and integrated interpretation with water quality index studies. Environ. Process. 2018, 5, 363–383. [Google Scholar] [CrossRef]
- Adimalla, N.; Qian, H. Groundwater quality evaluation using water quality index (WQI) for drinking purposes and human health risk (HHR) assessment in an agricultural region of Nanganur. south India. Ecotoxicol. Environ. Saf. 2019, 176, 153–161. [Google Scholar] [CrossRef]
- Boateng, T.K.; Opoku, F.; Acquaah, S.O.; Akoto, O. Groundwater quality assessment using statistical approach and water quality index in Ejisu-Juaben Municipality, Ghana. Environ. Earth Sci. 2016, 75, 489. [Google Scholar]
- Tripaty, J.K.; Sahu, K.C. Seasonal hydrochemistry of groundwater in the Barrier Spit system of the Chilika Lagoon, India. J Environ. Hydrol. 2005, 13, 1–9. [Google Scholar]
- WHO. Guidelines for Drinking Water Quality, 4th ed.; WHO: Geneva, Switzerland, 2017; pp. 307–441. ISBN 9789241548151. [Google Scholar]
- Ayers, R.S.; Westcot, D.W. Food, agriculture organization of the United Nations (FAO), water quality for agriculture. Irrig. Drain. Rome Pap. 1994, 29, 77044–77052. [Google Scholar]
- Rosner, B. Fundamentals of Biostatistics, 8th ed.; Cengage Learning: Boston, MA, USA, 2015. [Google Scholar]
- Taiwo, O.A. Principal Component Analysis: A Review. J. Emerg. Trends Comput. Inf. Sci. 2013, 4, 710–719. [Google Scholar]
- Roy, S.G.; Chakrabarti, A.A. A novel graph clustering algorithm based on discrete-time quantum random walk. In Quantum Inspired Computational Intelligence; Morgan Kaufmann: Burlington, MA, USA, 2017; pp. 361–389. [Google Scholar]
- Tabachnick, B.G.; Fidell, L.S. Using Multivariate Statistics, 7th ed. Pearson: Boston, MA, USA, 2019. [Google Scholar]
- Helena, B.; Pardo, R.; Vega, M.; Barrado, E.; Fernandez, J.; Fernandez, L. Temporal evolution of groundwater composition in an alluvial aquifer (Pisuerga River. Spain) by principal component analysis. Water Res. 2000, 34, 807–816. [Google Scholar] [CrossRef]
- Khan, T.A. Multivariate analysis of hydrochemical data of the groundwater in parts of Karwan-Sengar sub-basin. Central Ganga basin. India. Glob. NEST J. 2011, 13, 229–236. [Google Scholar]
- Sneath, P.H.A.; Sokal, R.R. Numerical Taxonomy: The Principles and Practice of Numerical Classification; A Series of Books in Biology; W. H. Freeman: San Francisco, CA, USA, 1973; ISBN 978-0-7167-0697-7. [Google Scholar]
- Khanoranga; Khalid, S. An assessment of groundwater quality for irrigation and drinking purposes around brick kilns in three districts of Balochistan province, Pakistan, through water quality index and multivariate statistical approaches. J. Geochem. Explor. 2019, 197, 14–26. [Google Scholar] [CrossRef]
- Piper, A.M. A graphic procedure in the geochemical interpretation of water analyses. Trans. Am. Geophys. Union 1944, 25, 914–923. [Google Scholar] [CrossRef]
- Gibbs, R.J. Mechanisms controlling world water chemistry. Science 1970, 170, 1088–1090. [Google Scholar] [CrossRef]
- Drever, J.I. The Geochemistry of Natural Waters, 3rd ed. Prentice-Hall: Upper Saddle River, NJ, USA, 1997. [Google Scholar]
- Revelle, R. Criteria for recognition of the sea water in ground-waters. Trans. Am. Geophys. Union 1941, 22, 593–597. [Google Scholar] [CrossRef]
- Horton, R.K. An index number system for rating water quality. J. Water Pollut. Control Fed. 1965, 37, 300–305. [Google Scholar]
- Craig, H. Isotopic variations in meteoric waters. Science 1961, 133, 1702–1703. [Google Scholar] [CrossRef]
- Bahir, M.; Mennani, A. Problématique de la gestion des eaux souterraines au Maroc. Estud. Geológicos 2002, 58, 103–108. [Google Scholar] [CrossRef]
- Bahir, M.; Jalal, M.; Mennani, A.; Laftouhi, N.E. Potentialités hydrogéologiques du synclinal de Kourimat ( Bassin synclinal d’Essaouira, Maroc). Estud. Geologicos. 2001, 57, 47–52. [Google Scholar] [CrossRef]
- Abourida, A.; Er-rouane, S.; Bahir, M.; da Silva, M.O.; Cheggour, A. Contribution des isotopes de l’environnement pour la comprehension du fonctionnement de l’aquifere mio-plioquaternaire du Haouz de Marrakech (Maroc). Estud. Geológicos 2004, 60, 161–167. [Google Scholar] [CrossRef]
- El Ouali, A.; Mudry, J.; Mania, J.; Chauve, P.; Elyamine, N.; Marzouk, M. Present recharge of an aquifer in a semi-arid region: An example from the Turonian limestones of the Errachidia basin, Morocco. Environ. Geol. 1999, 38, 171–176. [Google Scholar] [CrossRef]


| Physico-Chemical Parameters | WHO Standard [67] | Weight (wi) | |
|---|---|---|---|
| pH | 8.5 | 4 | 0.114 |
| EC (µS/cm) | 1500 | 4 | 0.114 |
| TDS (mg/L) | 1000 | 5 | 0.142 |
| Cl− (mg/L) | 250 | 3 | 0.086 |
| SO42− (mg/L) | 250 | 4 | 0.114 |
| NO3− (mg/L) | 45 | 5 | 0.142 |
| HCO3− (mg/L) | 120 | 3 | 0.086 |
| Na+ (mg/L) | 200 | 2 | 0.057 |
| Ca2+ (mg/L) | 75 | 2 | 0.057 |
| Mg2+ (mg/L) | 50 | 1 | 0.029 |
| K+ (mg/L) | 12 | 2 | 0.057 |
| 35 | 0.998 |
| Parameters | Weights (wi) |
|---|---|
| EC | 0.211 |
| Na+ | 0.204 |
| HCO3− | 0.202 |
| Cl− | 0.194 |
| SAR | 0.189 |
| Total | 1 |
| HCO3− | Cl− | Na+ | SAR | EC | Qi |
|---|---|---|---|---|---|
| meq/L | meq/L | μS/cm | |||
| 1–1.5 | 1–4 | 2–3 | 2–3 | 200–750 | 85–100 |
| 1.5–4.5 | 4–7 | 3–6 | 3–6 | 750–1500 | 60–85 |
| 4.5–8.5 | 7–10 | 6–9 | 6–12 | 1500–3000 | 35–60 |
| <1 or ≥8.5 | <1 or ≥10 | <2 or ≥9 | <2 or ≥12 | <200 or ≥3000 | 0–35 |
| Recommendation | Water Use Restrictions | IWQI | |
|---|---|---|---|
| Plant | Soil | ||
| No toxicity risk for most plants | Indicating no specific restrictions or limitations for using a particular irrigation water on most soils. However, it is important to note that this designation assumes that the soil has a low probability of causing salinity and sodicity problems. If there is a higher risk of these issues, additional measures, such as leaching, may be necessary. | No restriction (NR) | 85–100 |
| Avoid salt sensitive plants | Recommended in irrigated soils with a light texture or moderate permeability. These soils allow water to infiltrate and move through them easily, which helps prevent the accumulation of salts and other minerals that can harm plant growth. However, in heavy-texture soils, using LR water may lead to soil sodicity, which is the accumulation of sodium ions in the soil. This can result in soil structure degradation, reduced water infiltration, and reduced plant growth. | Low restriction (LR) | 70–85 |
| Plants with moderate tolerance to salts may be grown | Refers to a soil classification based on permeability, which determines the soil’s ability to absorb and transmit water. MR soils have moderate-to-high permeability values, meaning they can easily absorb and transmit water. | Moderate restriction (MR) | 55–70 |
| Should be used for the irrigation of plants with moderate-to-high tolerance to salts with special salinity and control practices, except water with low Na+, Cl−, and HCO3− values | It is typically used in soils with high permeability, which allows water to move quickly through the soil without forming compact layers. When using water with an electrical conductivity (EC) level above 2000 µS cm−1 and a sodium adsorption ratio (SAR) level above 7.0, a high-frequency irrigation schedule should be adopted to ensure that the salt levels do not accumulate in the soil. This means that the irrigation should be done frequently in smaller doses rather than less frequently in larger doses to prevent the salt concentration from becoming too high. | High restriction (HR) | 40–55 |
| Only plants with high salt tolerance, except for waters with extremely low values of Na+, Cl−, and HCO3− | Under normal conditions, water with severe restrictions (SR) should be avoided for irrigation. However, in special cases, it may be used occasionally. Gypsum application can be helpful if low salt levels and high SAR are present in the water. Soils must have high permeability in highly salinized water, and excessive water should be applied to avoid salt accumulation. | Severe restriction (SR) | 0–40 |
| Campaign | H | pH | T | EC | Ca2+ | Mg2+ | Na+ | K+ | HCO3− | Cl− | SO42− | NO3− | WQI | IWQI | IB |
|---|---|---|---|---|---|---|---|---|---|---|---|---|---|---|---|
| m | °C | µS/cm | mg/L | % | |||||||||||
| April 2017 Campaign | |||||||||||||||
| Min | 117.4 | 6.9 | 19.4 | 1134.0 | 106.2 | 59.6 | 50.6 | 3.9 | 244.1 | 127.6 | 57.7 | 6.2 | 85.9 | 26.5 | −9.0 |
| Max | 154.4 | 8.4 | 24.8 | 2203.0 | 158.3 | 178.7 | 216.1 | 11.7 | 518.7 | 638.1 | 514.1 | 18.6 | 145.8 | 77.5 | −1.0 |
| Average | 137.9 | 7.3 | 22.9 | 1647.6 | 126.7 | 90.3 | 114.8 | 7.8 | 445.4 | 345.8 | 189.2 | 10.5 | 110.8 | 51.4 | −5.4 |
| May 2018 Campaign | |||||||||||||||
| Min | 117.5 | 7.1 | 18.1 | 668.0 | 51.3 | 20.4 | 45.0 | 2.7 | 207.5 | 113.6 | 38.4 | 2.3 | 50.0 | 20.0 | −8.0 |
| Max | 326.8 | 8.3 | 24.3 | 3688.0 | 246.9 | 186.6 | 196.7 | 9.0 | 549.1 | 894.6 | 340.8 | 15.3 | 176.8 | 81.8 | 3.0 |
| Average | 222.3 | 7.6 | 21.9 | 1803.6 | 126.8 | 83.1 | 92.0 | 5.3 | 425.2 | 302.6 | 152.0 | 8.5 | 100.1 | 59.2 | −3.8 |
| March 2019 Campaign | |||||||||||||||
| Min | 117.4 | 7.1 | 18.0 | 687.0 | 82.2 | 38.9 | 27.6 | 3.9 | 244.1 | 120.5 | 43.2 | 0.0 | 60.4 | −8.0 | |
| Max | 325.7 | 8.2 | 24.8 | 2405.0 | 190.4 | 109.4 | 115.0 | 15.6 | 659.0 | 411.2 | 374.8 | 18.6 | 128.2 | −1.0 | |
| Average | 207.8 | 7.5 | 22.5 | 1558.5 | 155.3 | 80.8 | 79.7 | 7.2 | 498.8 | 290.1 | 176.2 | 8.8 | 107.8 | −5.3 | |
| July 2020 Campaign | |||||||||||||||
| Min | 0.8 | 6.6 | 21.5 | 481.0 | 60.7 | 25.6 | 39.2 | 1.5 | 178.1 | 51.7 | 66.0 | 0.2 | 55.9 | 22.4 | −9.0 |
| Max | 324.8 | 8.5 | 32.0 | 27000.0 | 341.1 | 817.5 | 7117.6 | 231.0 | 510.0 | 11574.5 | 2320.0 | 940.5 | 1244.1 | 76.5 | 4.0 |
| Average | 126.4 | 7.6 | 24.8 | 3136.0 | 145.8 | 97.4 | 507.7 | 25.3 | 372.7 | 894.4 | 274.3 | 66.1 | 182.7 | 53.4 | −2.5 |
| Campaign 2017 | TDS | Ca2+ | Mg2+ | Na+ | K+ | HCO3− | Cl− | SO42− | NO3− |
|---|---|---|---|---|---|---|---|---|---|
| TDS | 1 | ||||||||
| Ca2+ | 0.59 | 1 | |||||||
| Mg2+ | 0.67 | 0.35 | 1 | ||||||
| Na+ | 0.87 | 0.55 | 0.38 | 1 | |||||
| K+ | 0.06 | −0.21 | 0.27 | 0.06 | 1 | ||||
| HCO3− | 0.76 | 0.13 | 0.39 | 0.66 | −0.06 | 1 | |||
| Cl− | 0.92 | 0.60 | 0.43 | 0.96 | 0.05 | 0.70 | 1 | ||
| SO42− | −0.04 | 0.14 | 0.61 | −0.31 | 0.14 | −0.35 | −0.31 | 1 | |
| NO3− | 0.43 | 0.29 | −0.16 | 0.51 | −0.27 | 0.58 | 0.46 | −0.62 | 1 |
| Campaign 2018 | TDS | Ca2+ | Mg2+ | Na+ | K+ | HCO3− | Cl− | SO42− | NO3− |
| TDS | 1 | ||||||||
| Ca2+ | 0.91 | 1 | |||||||
| Mg2+ | 0.93 | 0.73 | 1 | ||||||
| Na+ | 0.92 | 0.75 | 0.88 | 1 | |||||
| K+ | −0.16 | −0.42 | 0.02 | 0.01 | 1 | ||||
| HCO3− | 0.51 | 0.33 | 0.63 | 0.54 | 0.07 | 1 | |||
| Cl− | 0.97 | 0.89 | 0.88 | 0.91 | −0.23 | 0.50 | 1 | ||
| SO42− | 0.68 | 0.70 | 0.60 | 0.54 | −0.02 | −0.10 | 0.55 | 1 | |
| NO3− | 0.31 | 0.04 | 0.58 | 0.33 | 0.30 | 0.83 | 0.29 | −0.15 | 1 |
| Campaign 2019 | TDS | Ca2+ | Mg2+ | Na+ | K+ | HCO3− | Cl− | SO42− | NO3− |
| TDS | 1 | ||||||||
| Ca2+ | 0.78 | 1 | |||||||
| Mg2+ | 0.70 | 0.76 | 1 | ||||||
| Na+ | 0.39 | 0.49 | 0.07 | 1 | |||||
| K+ | 0.09 | −0.02 | −0.10 | 0.32 | 1 | ||||
| HCO3− | 0.60 | 0.68 | 0.39 | 0.73 | 0.01 | 1 | |||
| Cl− | 0.62 | 0.81 | 0.67 | 0.58 | −0.27 | 0.70 | 1 | ||
| SO42− | 0.25 | 0.29 | 0.53 | −0.38 | 0.02 | −0.40 | −0.06 | 1 | |
| NO3 | 0.70 | 0.48 | 0.46 | 0.09 | 0.10 | 0.49 | 0.26 | 0.10 | 1 |
| Campaign 2020 | TDS | Ca2+ | Mg2+ | Na+ | K+ | HCO3− | Cl− | SO42− | NO3− |
| TDS | 1 | ||||||||
| Ca2+ | 0.72 | 1 | |||||||
| Mg2+ | 0.98 | 0.66 | 1 | ||||||
| Na+ | 1.00 | 0.67 | 0.99 | 1 | |||||
| K+ | 0.80 | 0.89 | 0.73 | 0.76 | 1 | ||||
| HCO3− | −0.38 | −0.03 | −0.32 | −0.42 | −0.23 | 1 | |||
| Cl− | 1.00 | 0.68 | 0.99 | 1.00 | 0.76 | −0.41 | 1 | ||
| SO42− | 0.98 | 0.65 | 0.99 | 0.99 | 0.73 | −0.41 | 0.99 | 1 | |
| NO3− | 0.09 | 0.60 | −0.04 | 0.01 | 0.64 | 0.07 | 0.01 | −0.03 | 1 |
| WQI Values | Water type | Campaign 2017 | Campaign 2018 | Campaign 2019 | Campaign 2020 | ||||
|---|---|---|---|---|---|---|---|---|---|
| Sample No. | % | Sample No. | % | Sample No. | % | Sample No. | % | ||
| <50 | Excellent water | ||||||||
| 50–101 | Good water | 2 | 15.4 | 4 | 30.8 | 8 | 66.7 | 8 | 44.5 |
| 100–200 | Poor water | 11 | 85.6 | 9 | 69.2 | 4 | 33.3 | 8 | 44.5 |
| 200–300 | Very poor water | 1 | 5.5 | ||||||
| >300 | Unsuitable water for drinking | 1 | 5.5 | ||||||
| IWQI Values | Type of Restriction | Campaign 2017 | Campaign 2018 | Campaign 2019 | Campaign 2020 | ||||
|---|---|---|---|---|---|---|---|---|---|
| Sample No. | % | Sample No. | % | Sample No. | % | Sample No. | % | ||
| 85–100 | No restriction | ||||||||
| 70–85 | Low restriction | 2 | 15.4 | 3 | 23.1 | 2 | 16.7 | 1 | 5.3 |
| 55–70 | Moderate restriction | 4 | 30.8 | 8 | 61.5 | 4 | 33.3 | 12 | 63.2 |
| 40–55 | High restriction | 5 | 38.5 | 2 | 16.7 | 2 | 10.5 | ||
| 0–40 | Severe restriction | 2 | 15.5 | 2 | 15.4 | 4 | 33.3 | 4 | 21.1 |
| Sample | Nature | X | Y | Z | pH | EC | Cl− | δ18O | δ2H |
|---|---|---|---|---|---|---|---|---|---|
| m | μS/cm | meq/L | Vs SMOW (‰) | ||||||
| E70 | Well | 79,032 | 64,190 | 4 | 7.1 | 1407 | 5.9 | –3.3 | –12.4 |
| E71 | Well | 78,523 | 61,058 | 100 | 7.7 | 4094 | 30.5 | –3.01 | –15.9 |
| HT120 | Well | 89,536 | 64,080 | 179 | 7.2 | 1541 | 7.0 | –4.37 | –23.3 |
| HT102 | Well | 89,177 | 64,188 | 156 | 7.5 | 1551 | 6.9 | –4.34 | –24.5 |
| HT24 | Well | 89,239 | 63,810 | 123 | 8.2 | 1837 | 9.1 | –1.03 | –8.2 |
| E83 | Well | 92,802 | 63,545 | 163 | 8.12 | 867 | 1.5 | –1.34 | –6.4 |
| HT115 | Well | 98,271 | 68,747 | 335 | 7.9 | 1896 | 8.9 | –4.75 | –21.6 |
| HT117 | Well | 94,198 | 68,475 | 287 | 7.7 | 1161 | 3.0 | –5.32 | –25.9 |
| HT118 | Well | 90,605 | 67,791 | 267 | 8.1 | 481 | 6.1 | –4.78 | –19.1 |
| E72 | Spring | 82,073 | 63,394 | 46 | 7.6 | 2224 | 12.4 | –2.81 | –16.9 |
| E76 | Spring | 82,525 | 67,811 | 250 | 8.05 | 1862 | 10.6 | –3.89 | –20.8 |
| HT26 | Spring | 89,651 | 63,823 | 135 | 7.2 | 1579 | 7.0 | –3.56 | –19.3 |
| P9 | Spring | 90,126 | 63,897 | 143 | 7.3 | 1635 | 7.1 | –4 | –20.3 |
| HT25 | Spring | 87,764 | 64,270 | 148 | 7.4 | 1812 | 9.2 | –5.25 | –21.6 |
| E73 | Surface water | 82,107 | 63,464 | 47 | 7.4 | 2340 | 13.7 | –1.59 | –11.1 |
| E74 | Surface water | 79,021 | 63,948 | 4 | 8.5 | 27,000 | 326.5 | 4.79 | 20.3 |
| HT29 | Dam | 94,921 | 64,380 | 195 | 8.2 | 1050 | 1.5 | –3.16 | –10.1 |
| Min | 7.1 | 481.0 | 1.5 | –5.3 | –25.9 | ||||
| Max | 8.5 | 27,000.0 | 326.5 | 4.8 | 20.3 | ||||
| Mean | 7.7 | 3196.3 | 27.5 | –3.0 | –15.1 | ||||
Disclaimer/Publisher’s Note: The statements, opinions and data contained in all publications are solely those of the individual author(s) and contributor(s) and not of MDPI and/or the editor(s). MDPI and/or the editor(s) disclaim responsibility for any injury to people or property resulting from any ideas, methods, instructions or products referred to in the content. |
© 2023 by the authors. Licensee MDPI, Basel, Switzerland. This article is an open access article distributed under the terms and conditions of the Creative Commons Attribution (CC BY) license (https://creativecommons.org/licenses/by/4.0/).
Share and Cite
El Mountassir, O.; Bahir, M. The Assessment of the Groundwater Quality in the Coastal Aquifers of the Essaouira Basin, Southwestern Morocco, Using Hydrogeochemistry and Isotopic Signatures. Water 2023, 15, 1769. https://doi.org/10.3390/w15091769
El Mountassir O, Bahir M. The Assessment of the Groundwater Quality in the Coastal Aquifers of the Essaouira Basin, Southwestern Morocco, Using Hydrogeochemistry and Isotopic Signatures. Water. 2023; 15(9):1769. https://doi.org/10.3390/w15091769
Chicago/Turabian StyleEl Mountassir, Otman, and Mohammed Bahir. 2023. "The Assessment of the Groundwater Quality in the Coastal Aquifers of the Essaouira Basin, Southwestern Morocco, Using Hydrogeochemistry and Isotopic Signatures" Water 15, no. 9: 1769. https://doi.org/10.3390/w15091769