
The Impact of Sediment–Water Ratio and Hydraulic Residence Time on the Release of Inorganic Nitrogen from Sediments in the Pearl River Delta
 ,
,
Abstract
:1. Introduction
2. Materials and Methods
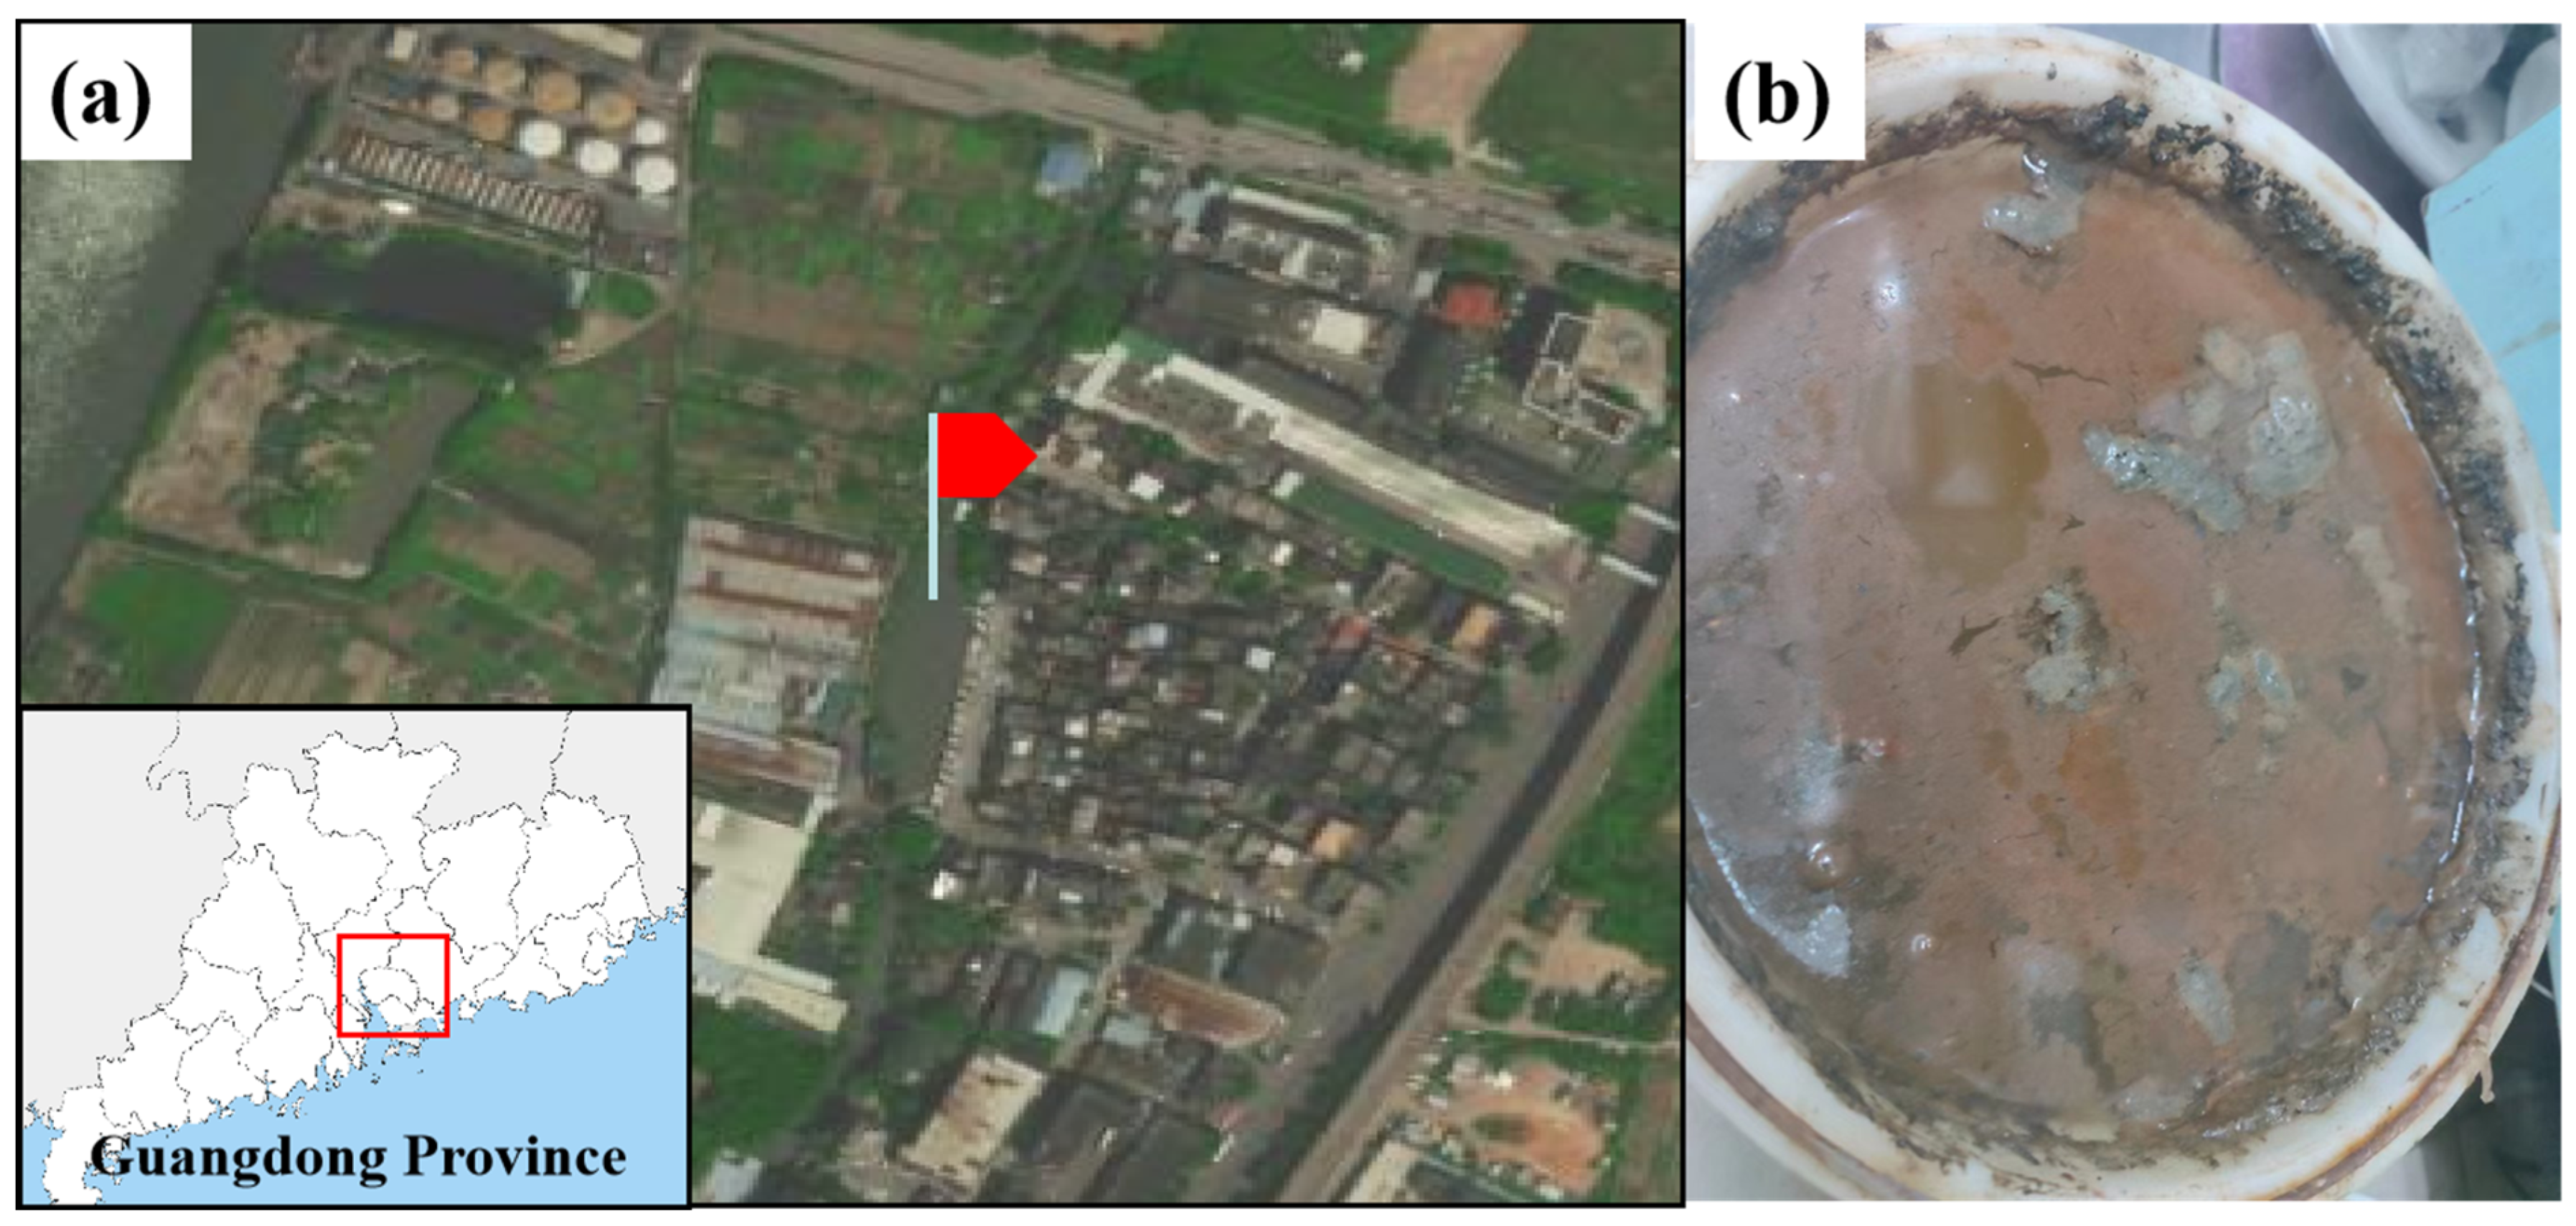
2.1. Sediments
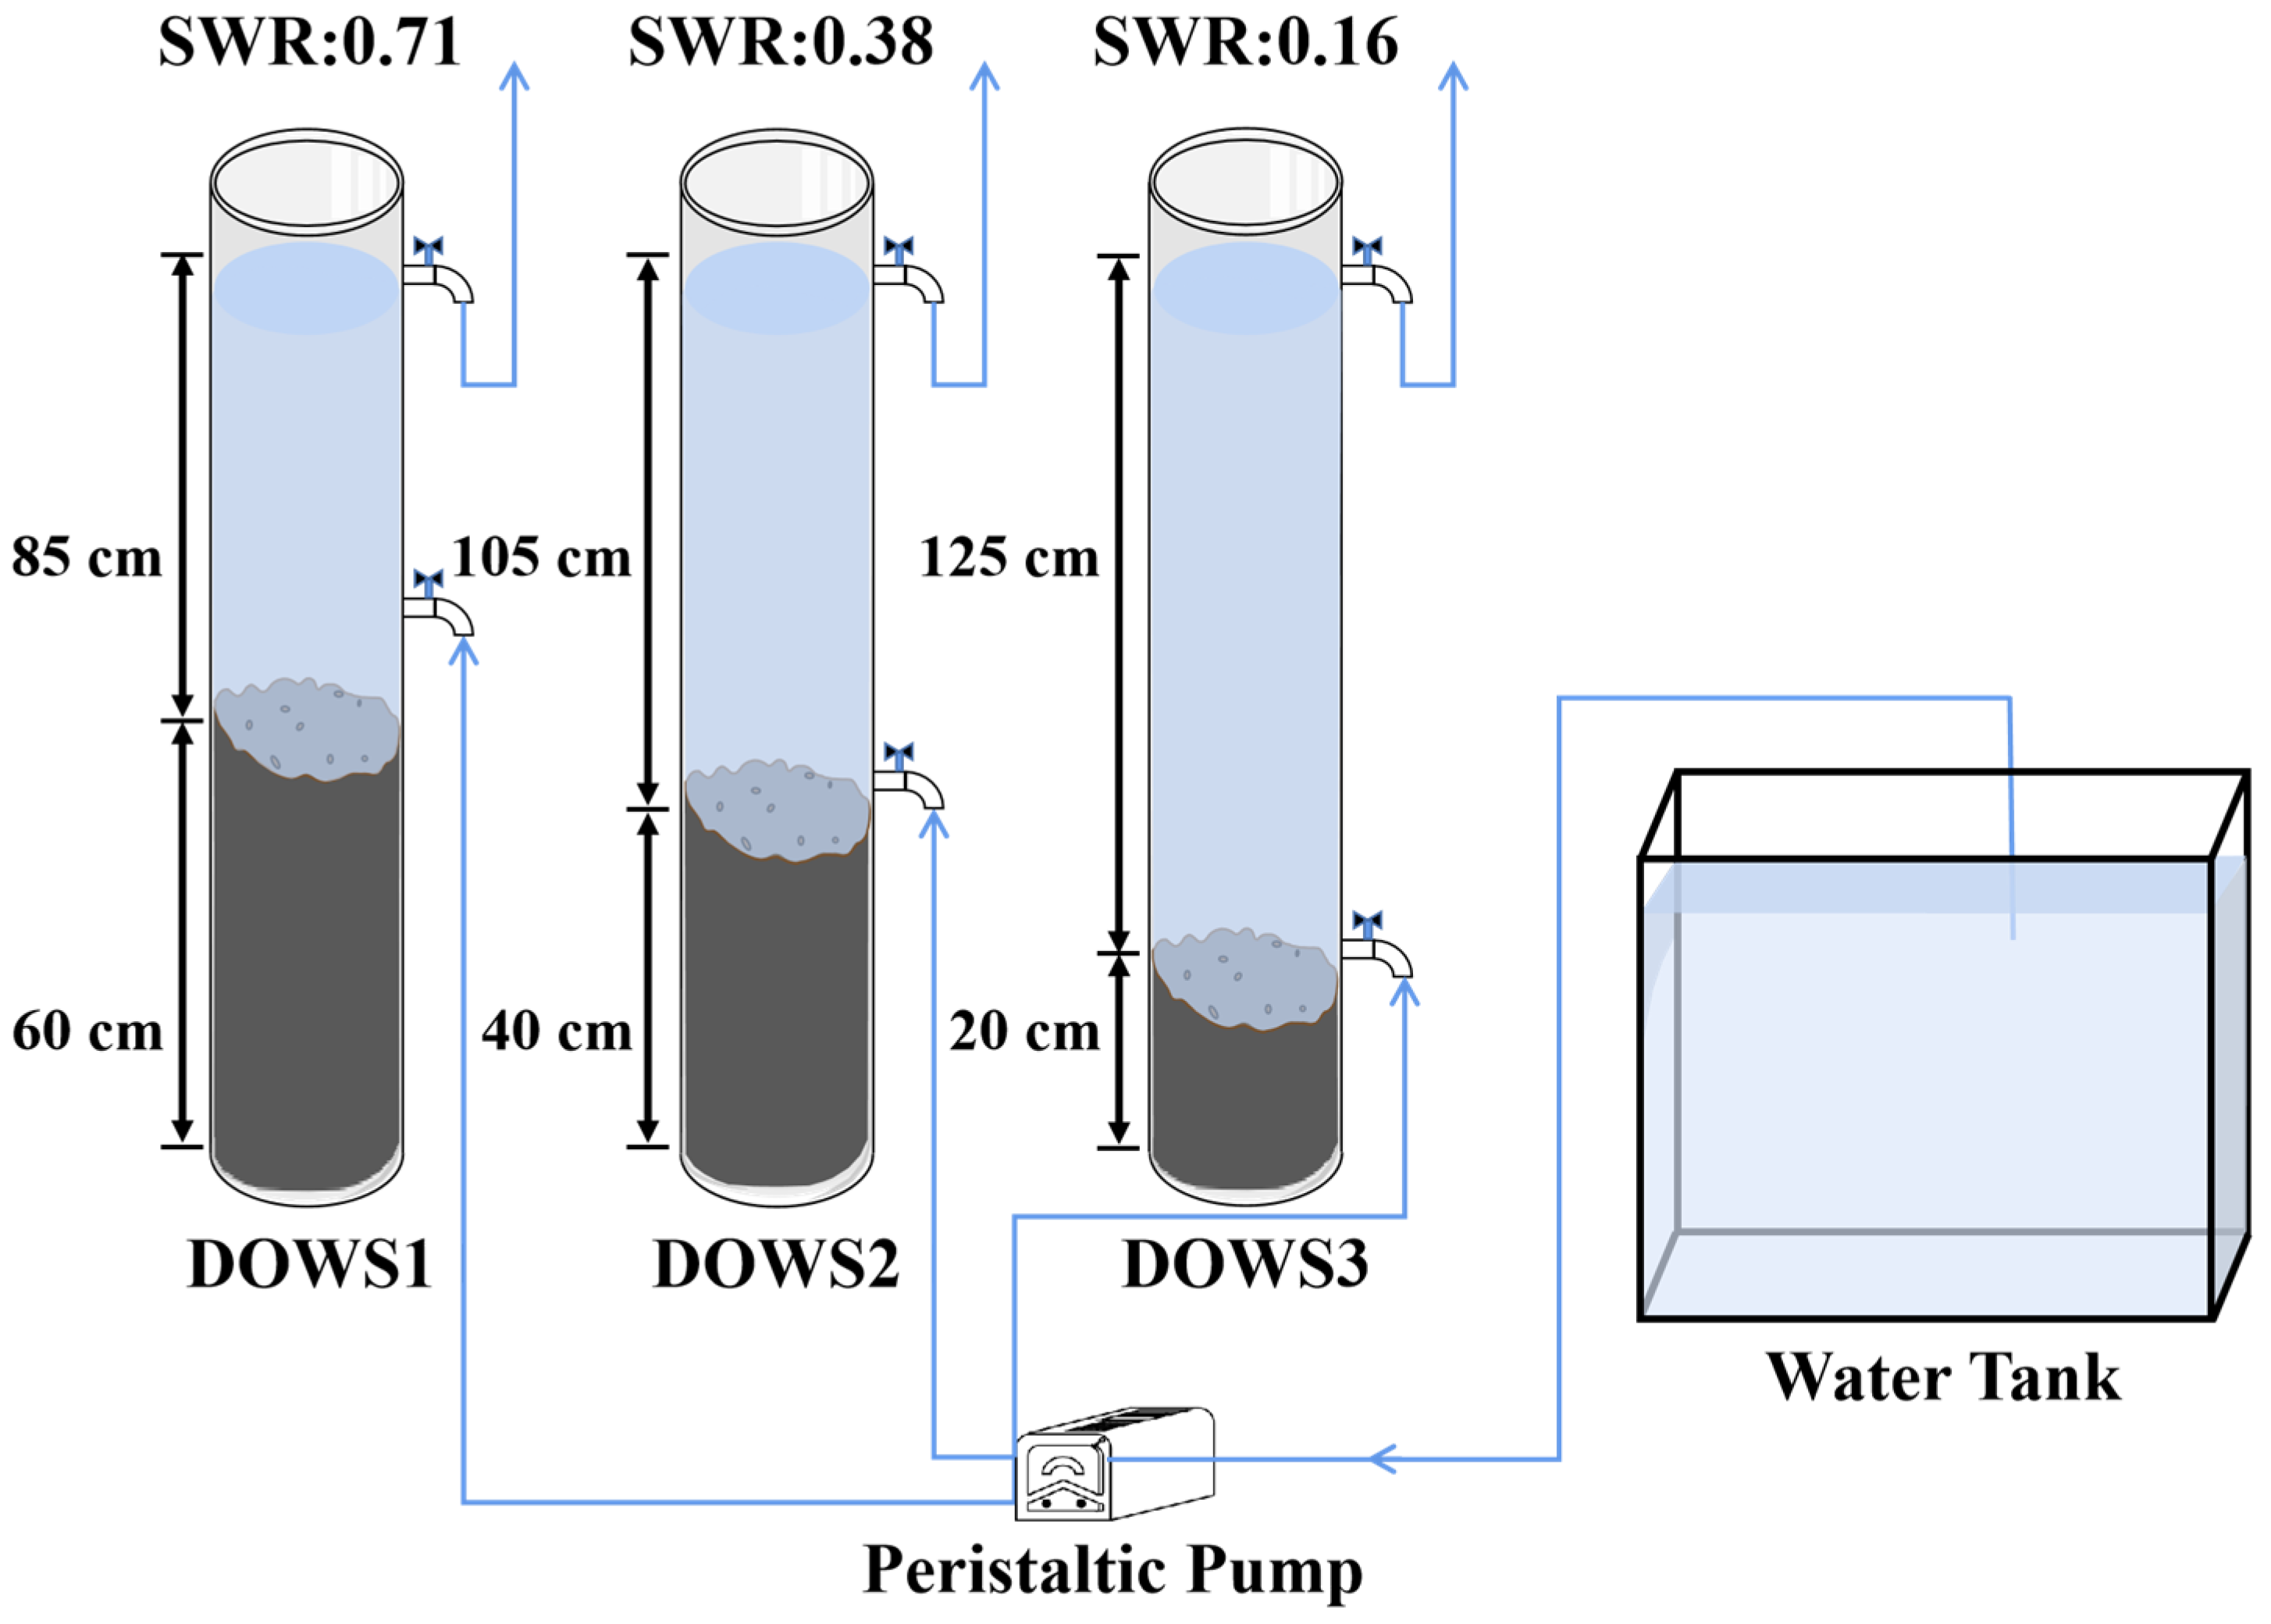
2.2. Set-Up
2.3. Operation
2.4. Physicochemical Indexes
2.5. Data Statistics and Analysis
3. Results and Discussion
3.1. Significance of Physicochemical Parameter Differences under Different SWR and HRT
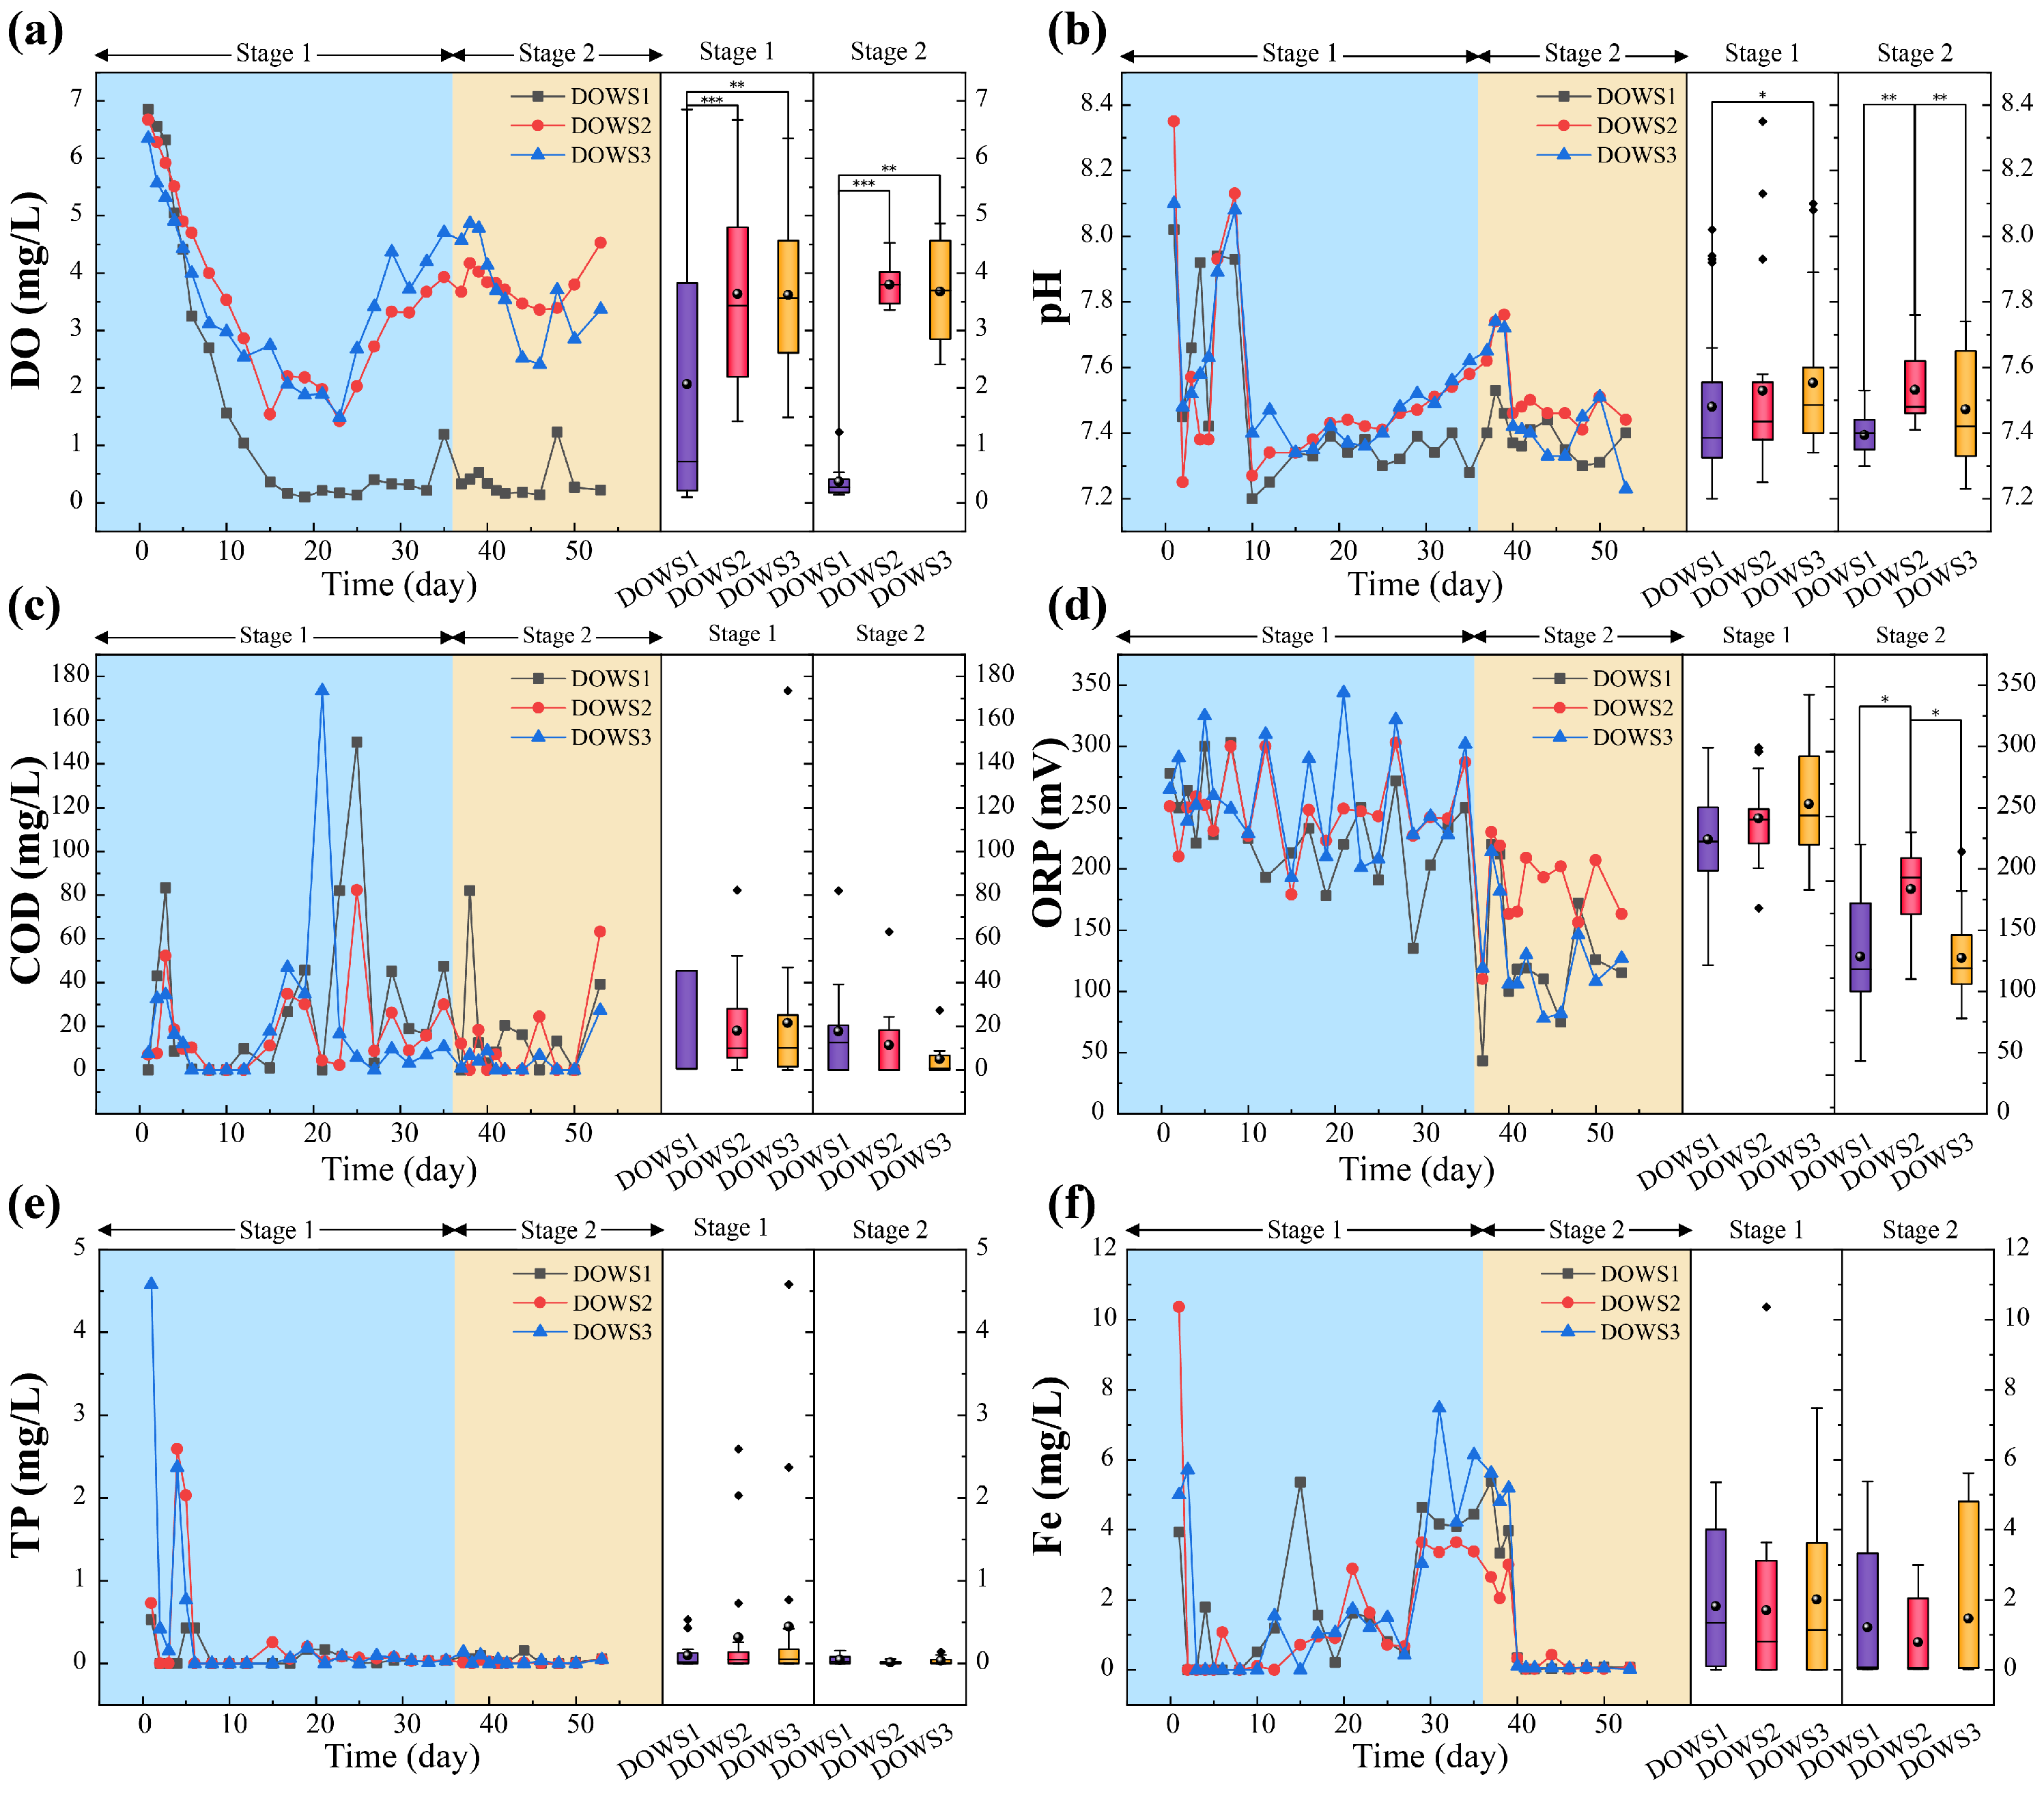
3.2. Changes and Wilcoxon Signed-Rank Test of DO, pH, COD, ORP, Fe, and TP
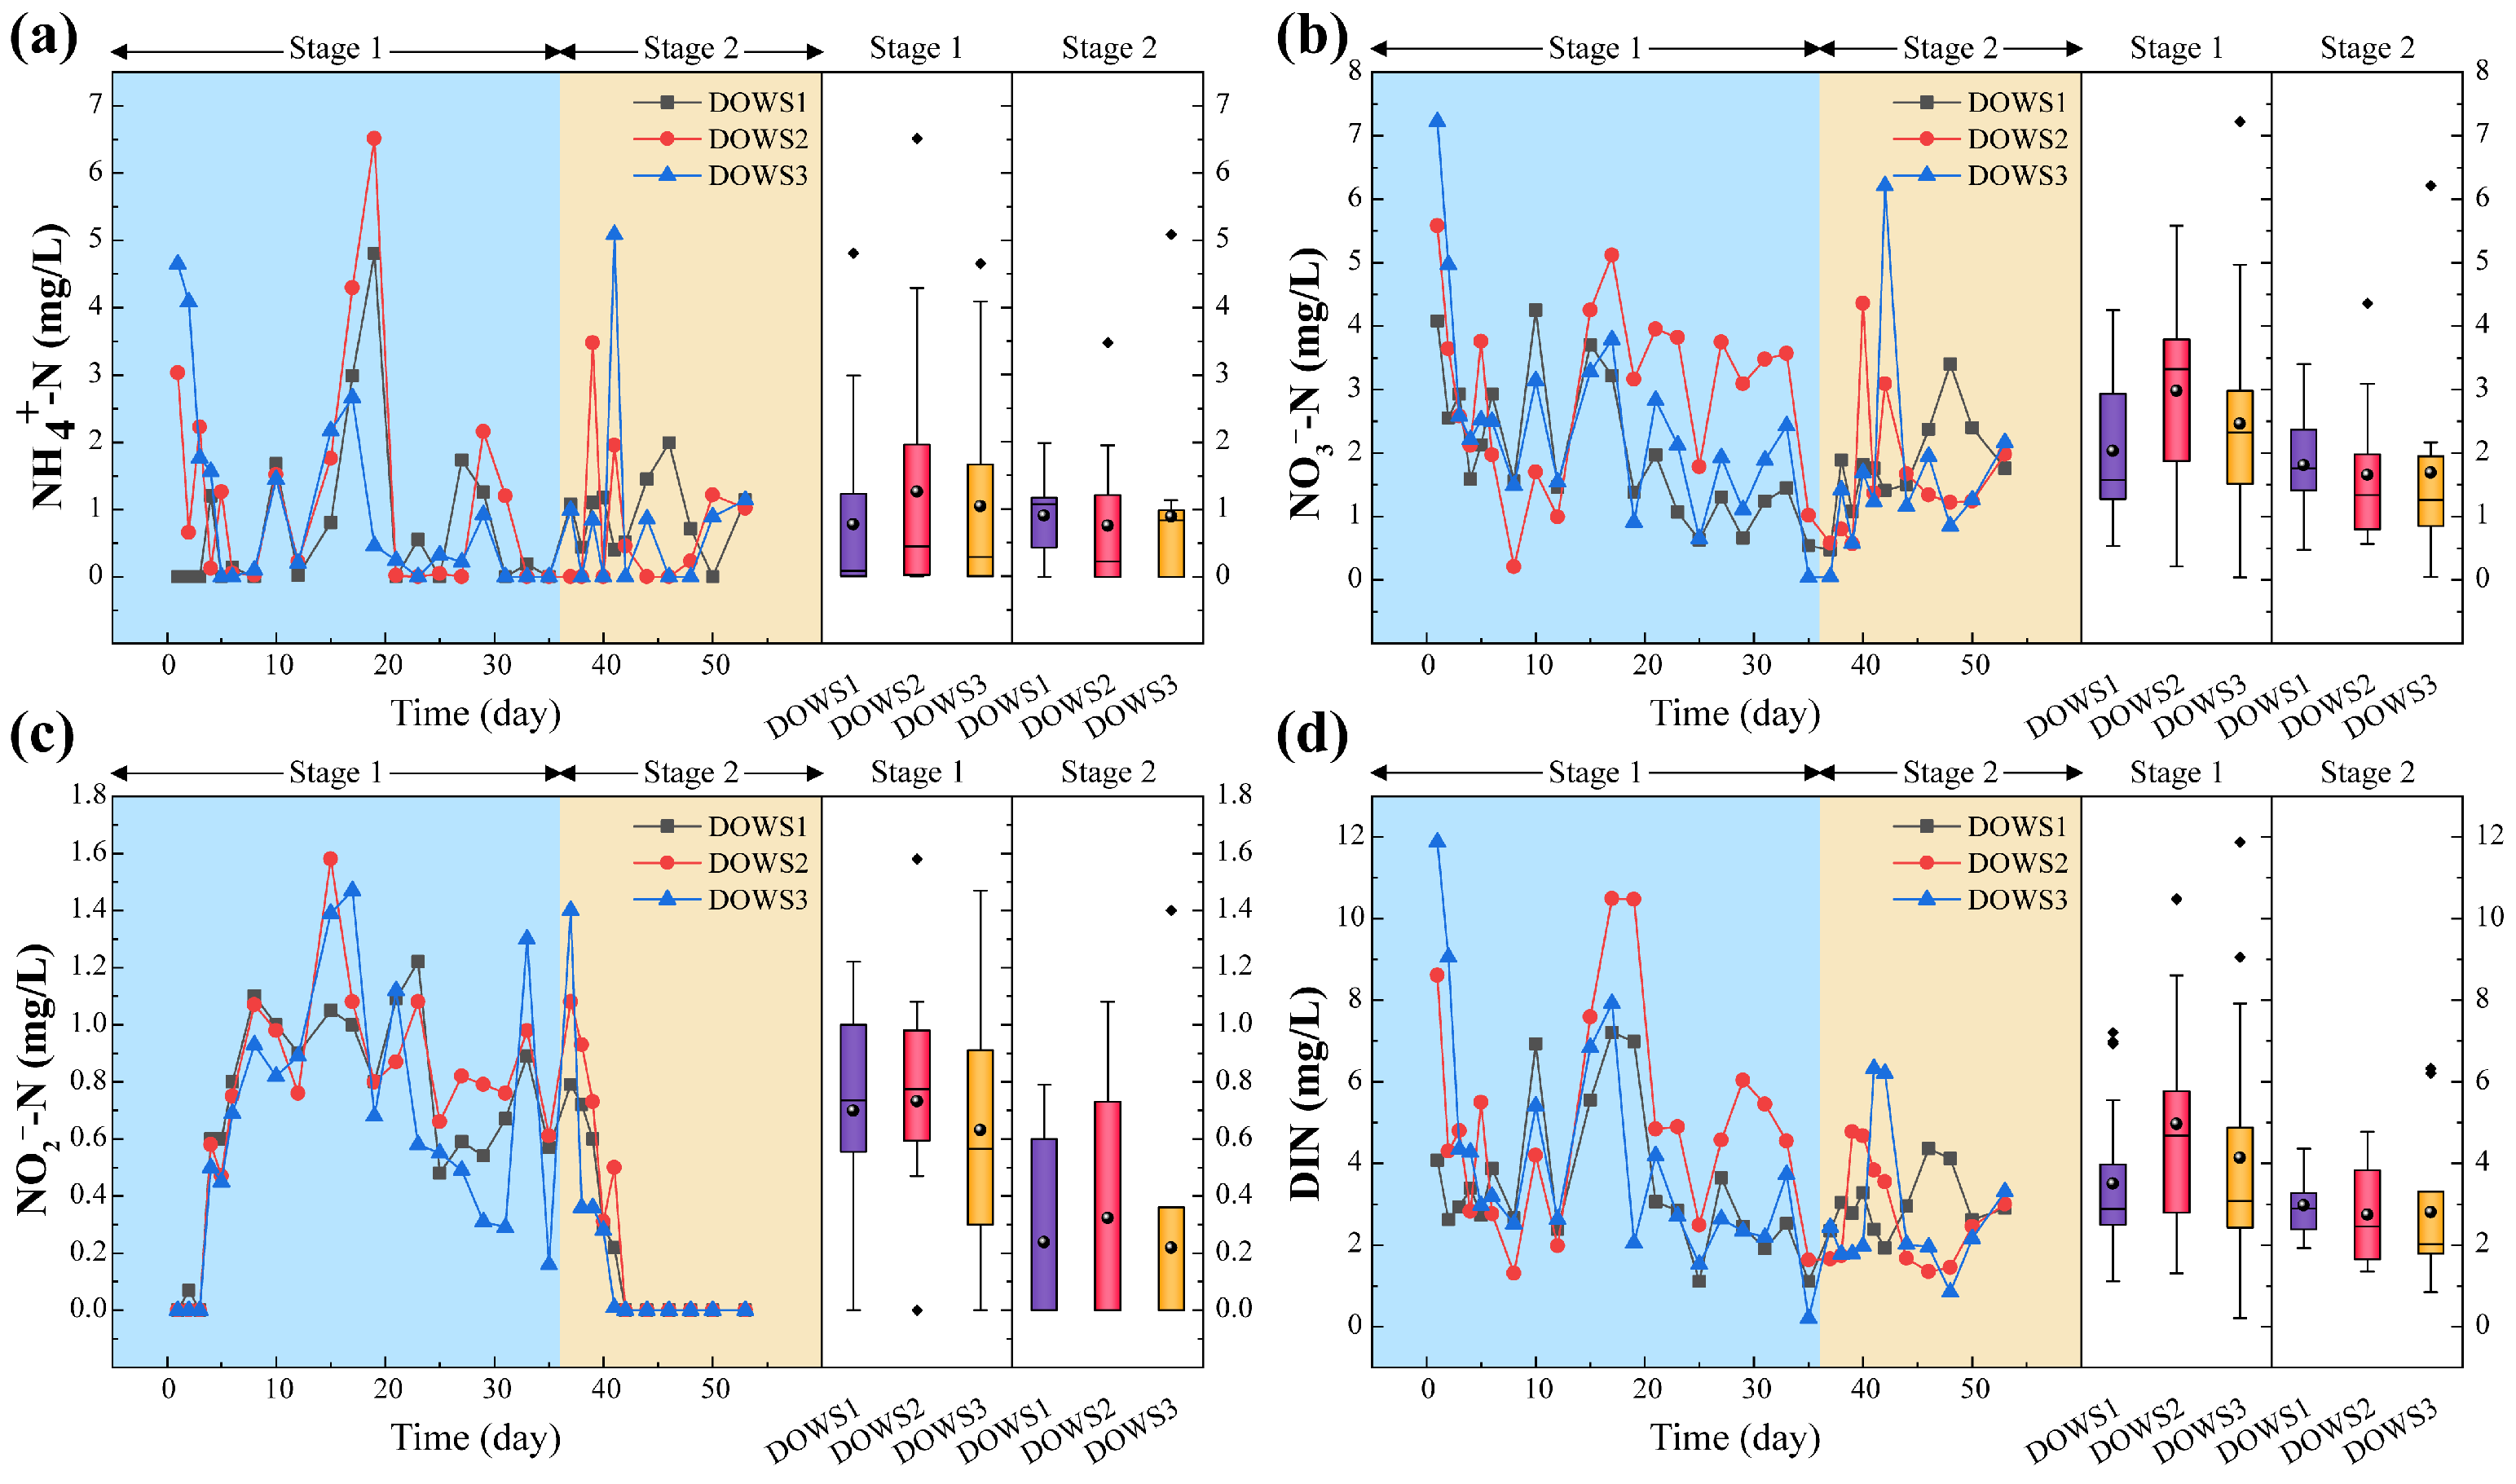
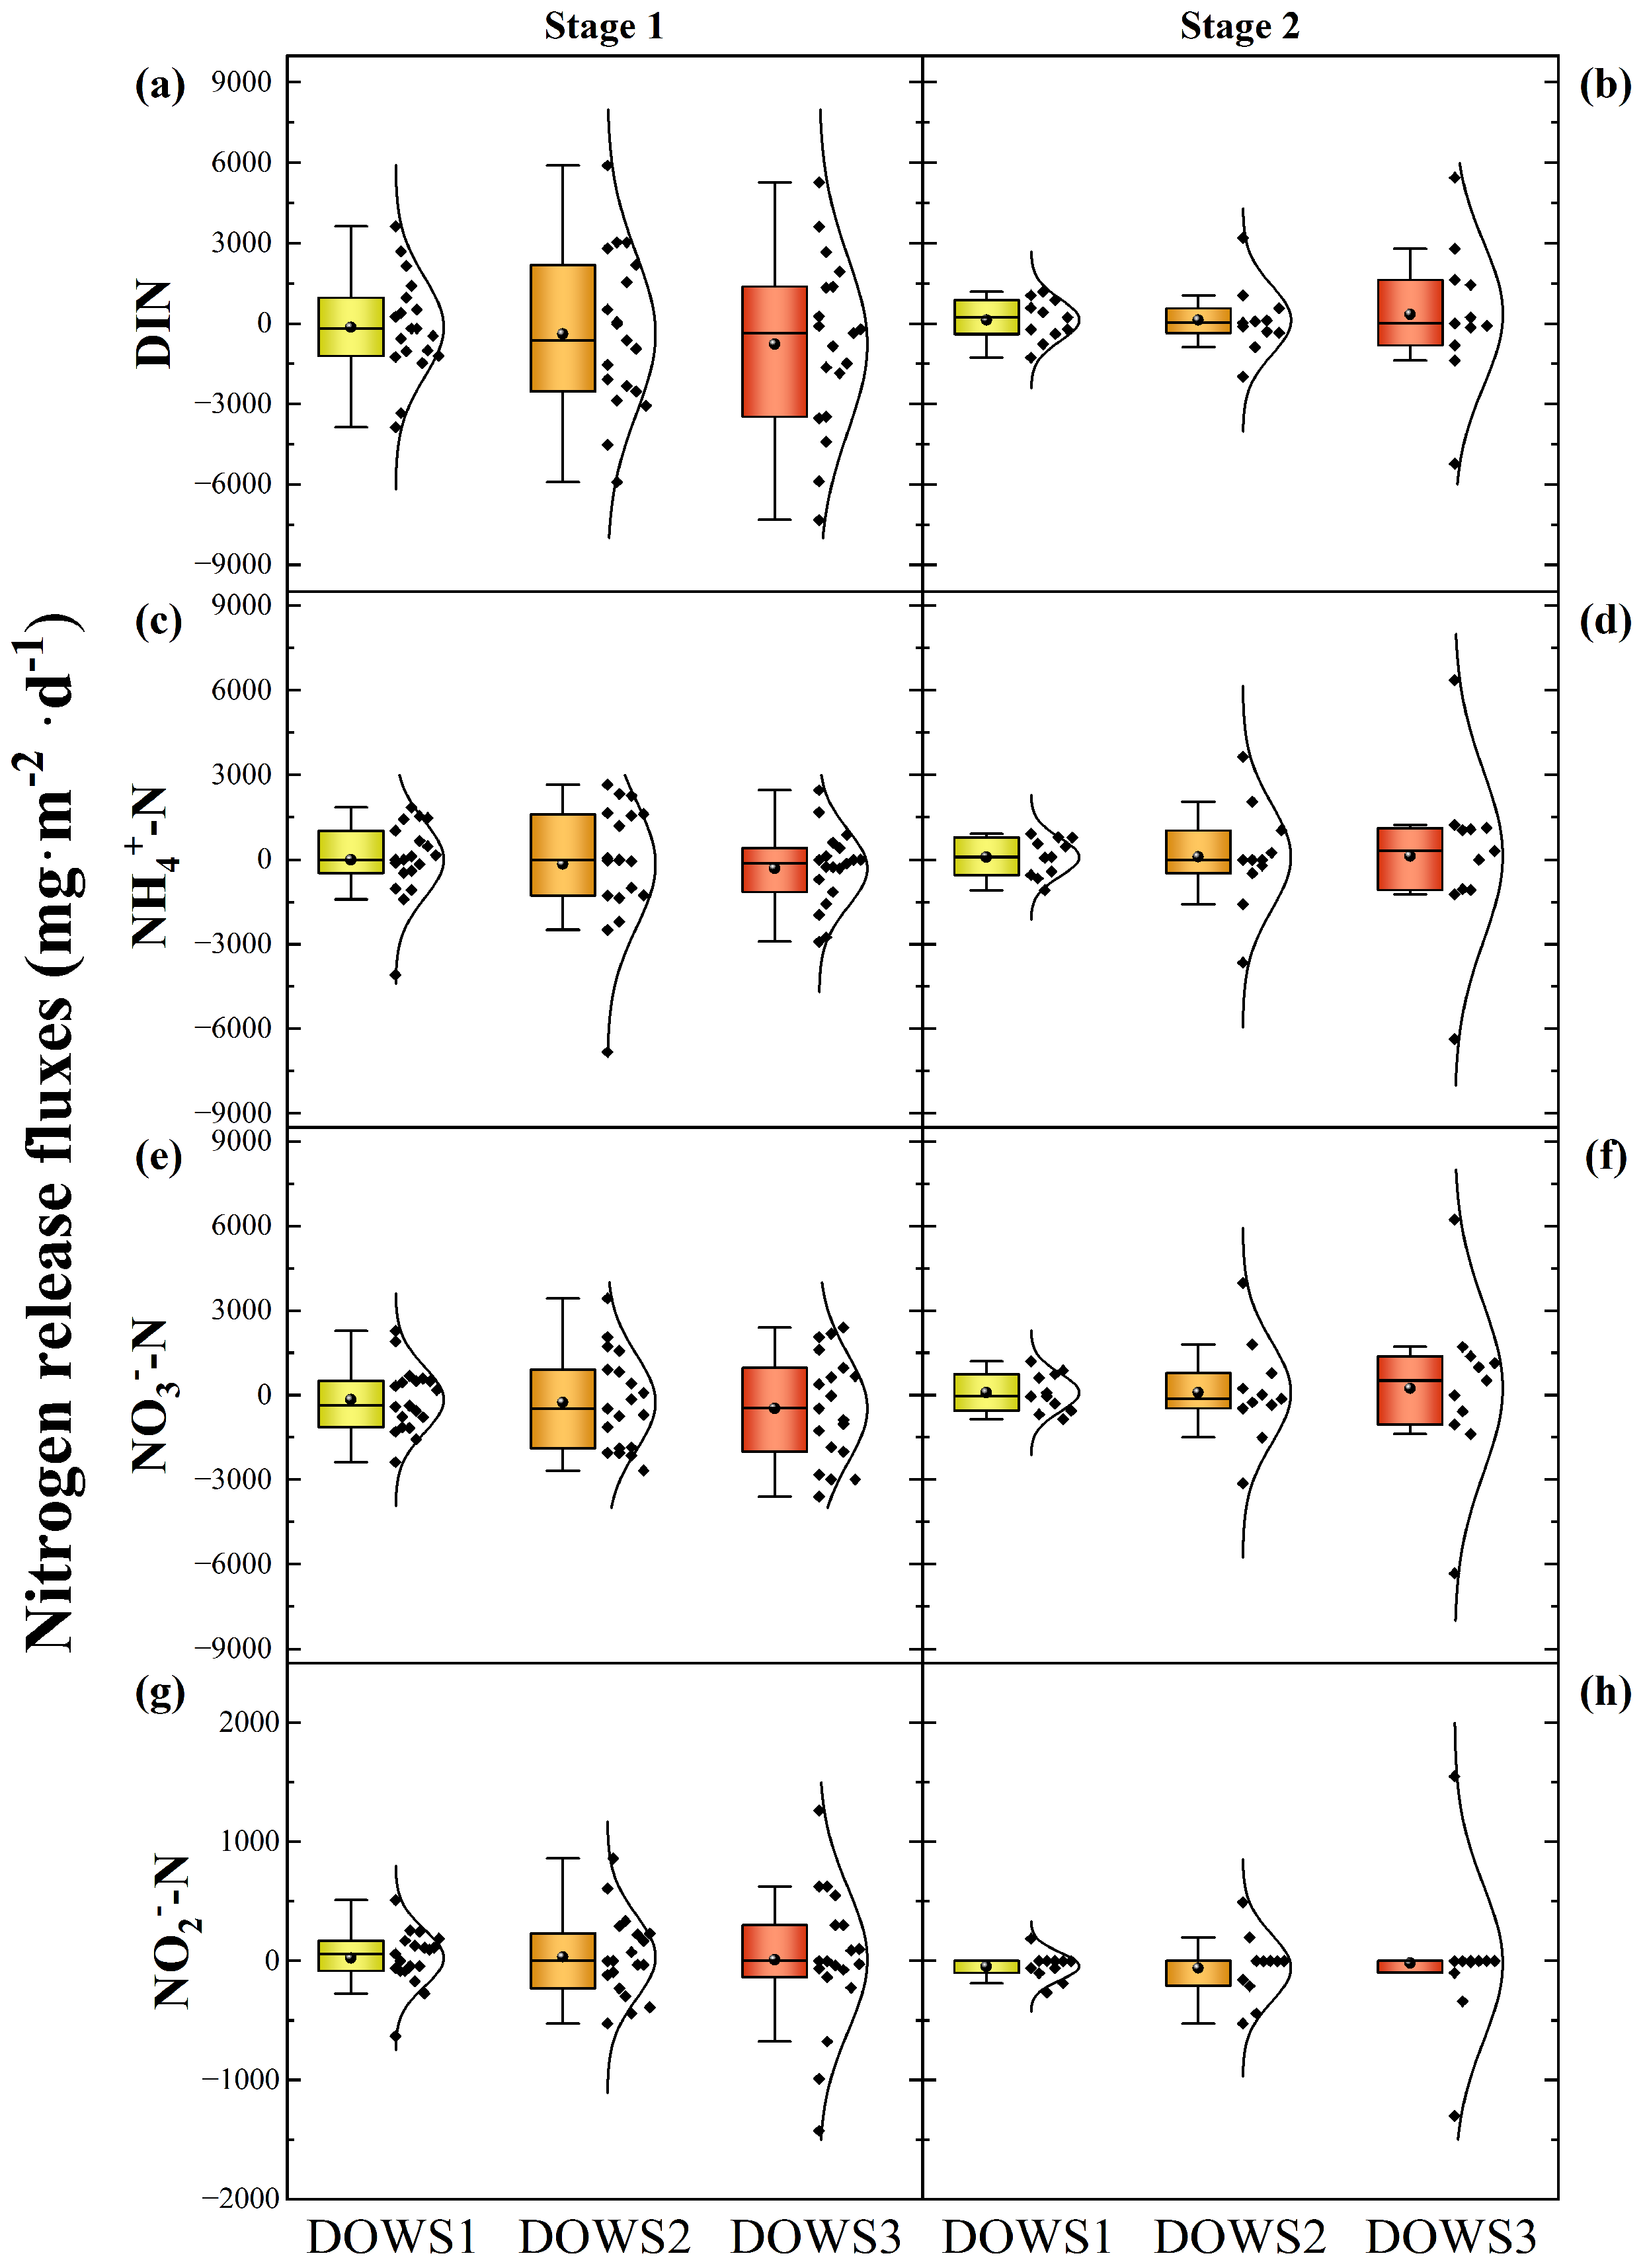
3.3. Changes in DIN, NH4+-N, NO3−-N and NO2−-N
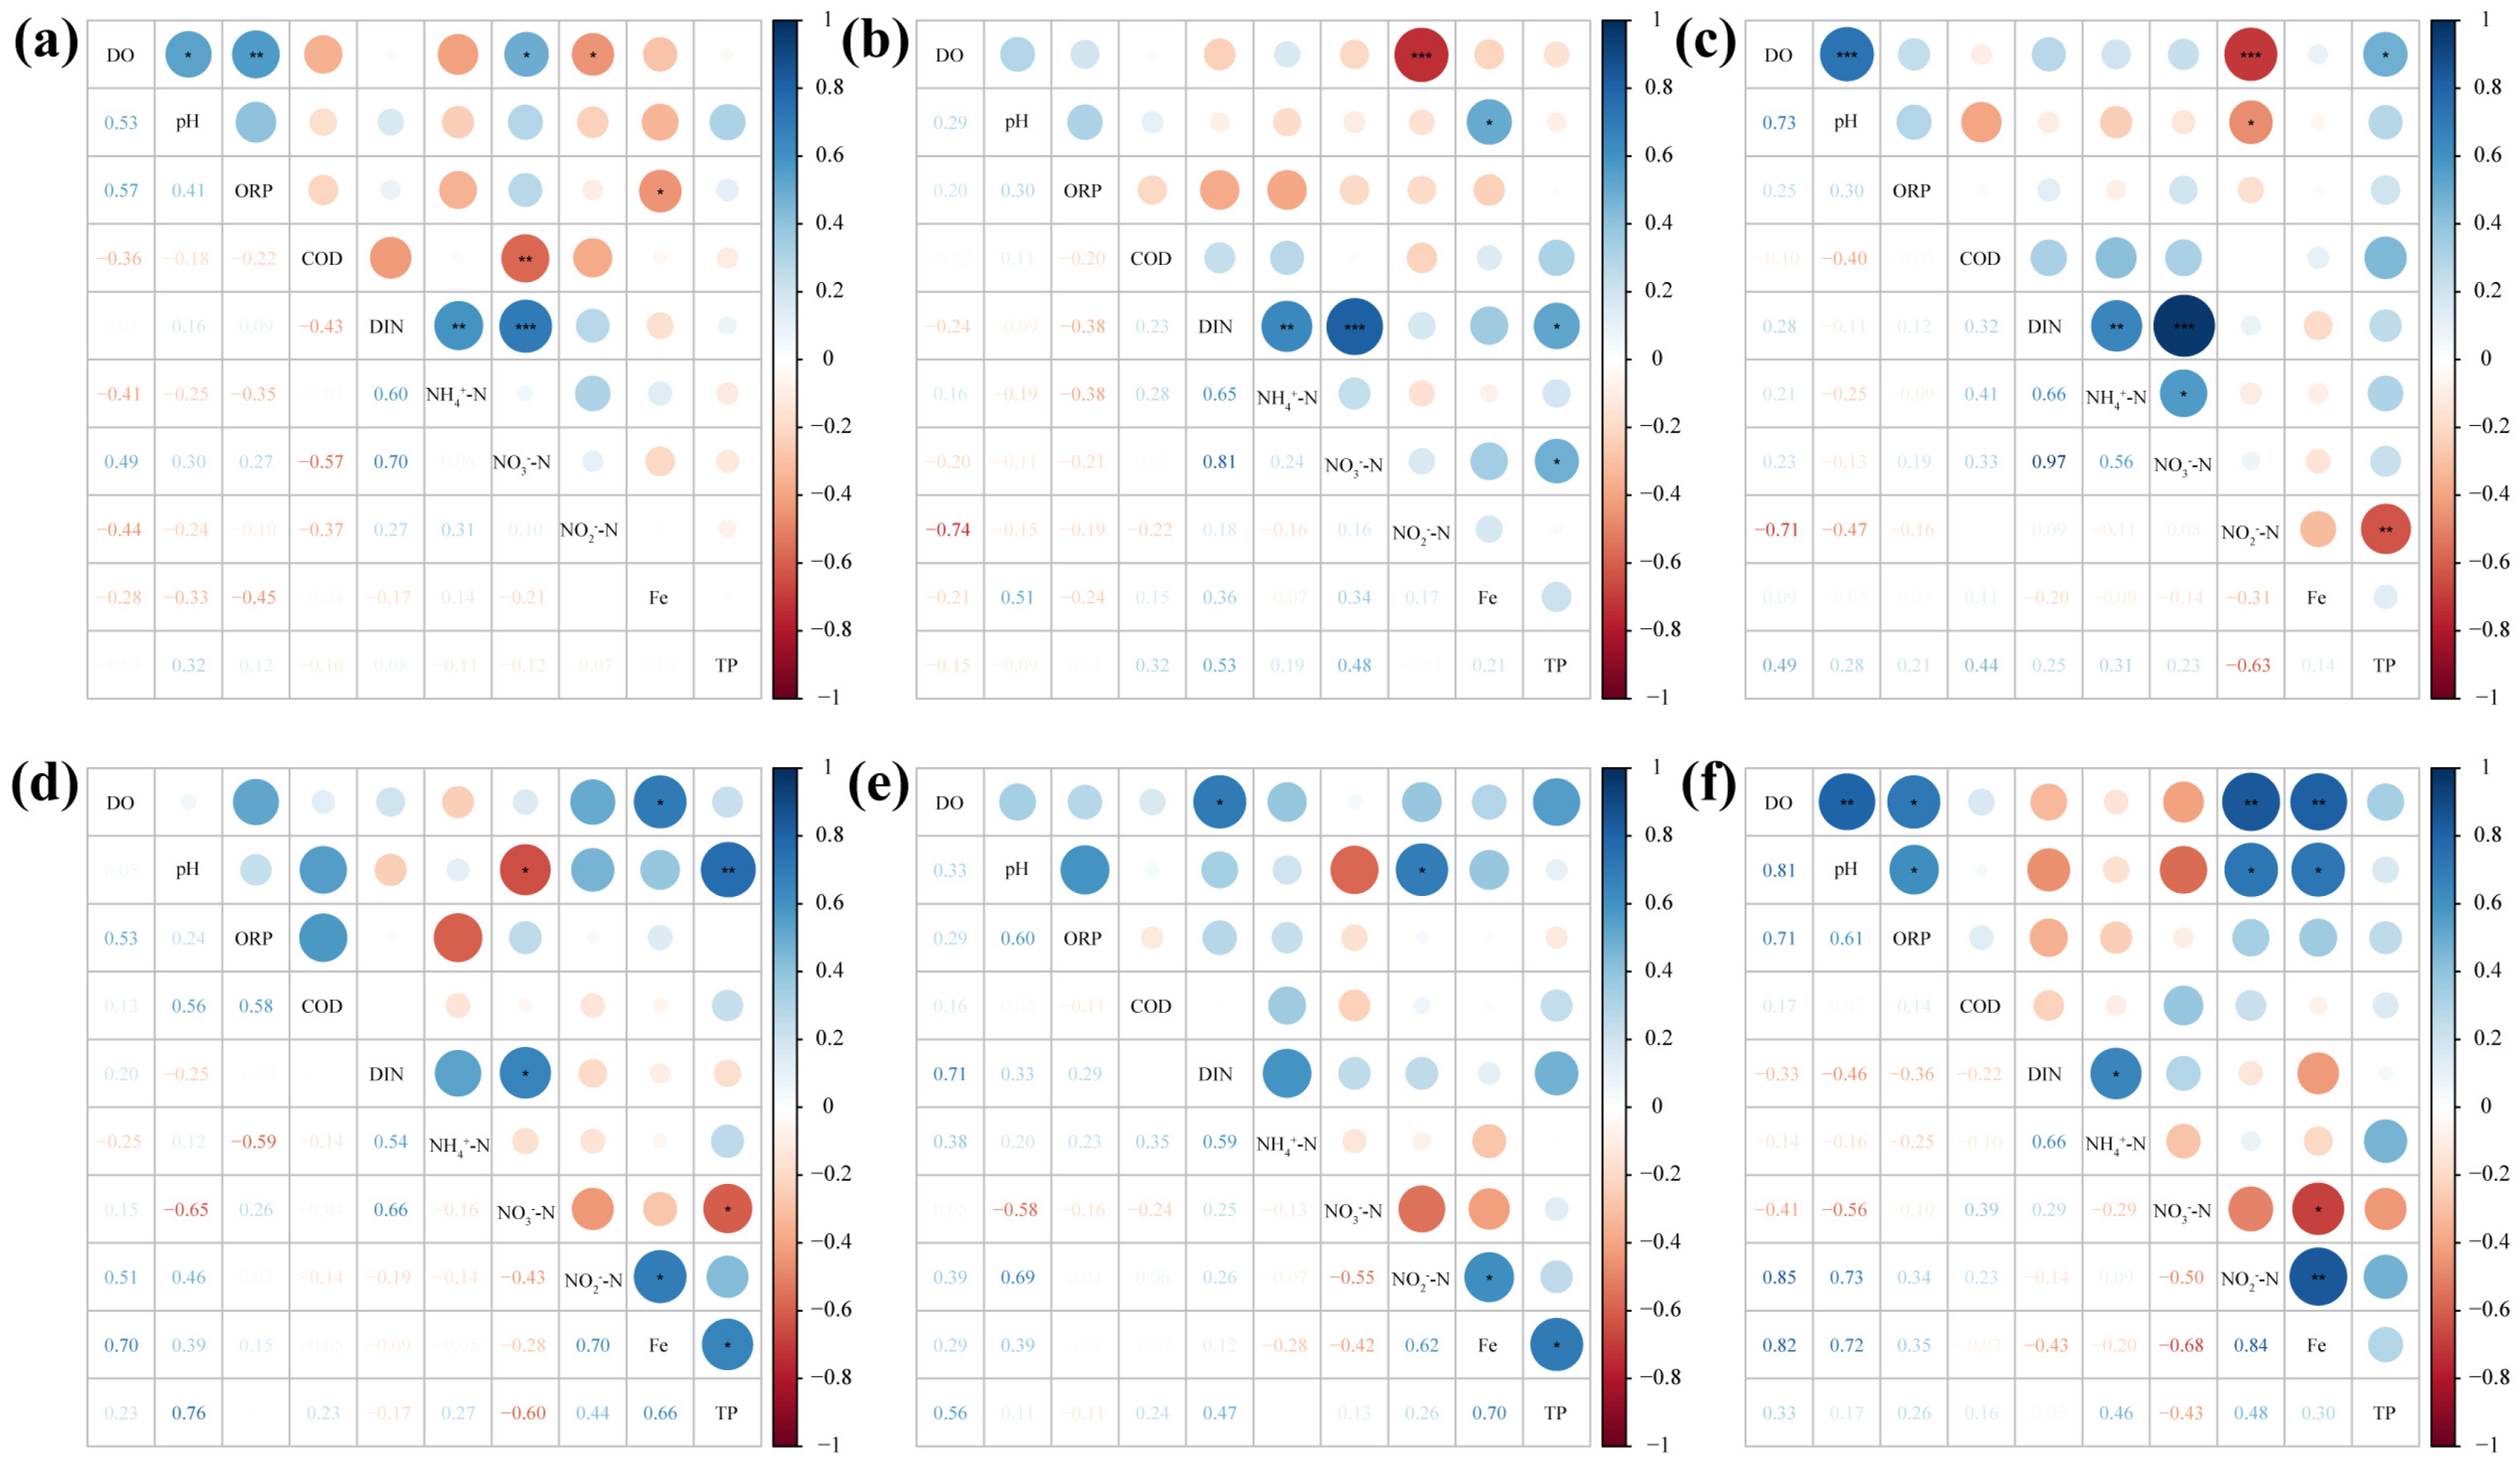
3.4. The Relationship between Nutrients and Potential Influencing Factors
4. Conclusions
- In DOWS, sediment is a potential source and transformation site of pollutants. Sediment can not only adsorb and precipitate pollutants but also release and transform them.
- SWR is positively correlated with DO in the overlying water and negatively correlated with COD, directly affecting the N release flux from the sediment. N-containing compounds in sediment can be transformed into various forms of N through microbial reactions and released into the overlying water.
- Shortening HRT may lead to weakened denitrification capacity in DOWS.
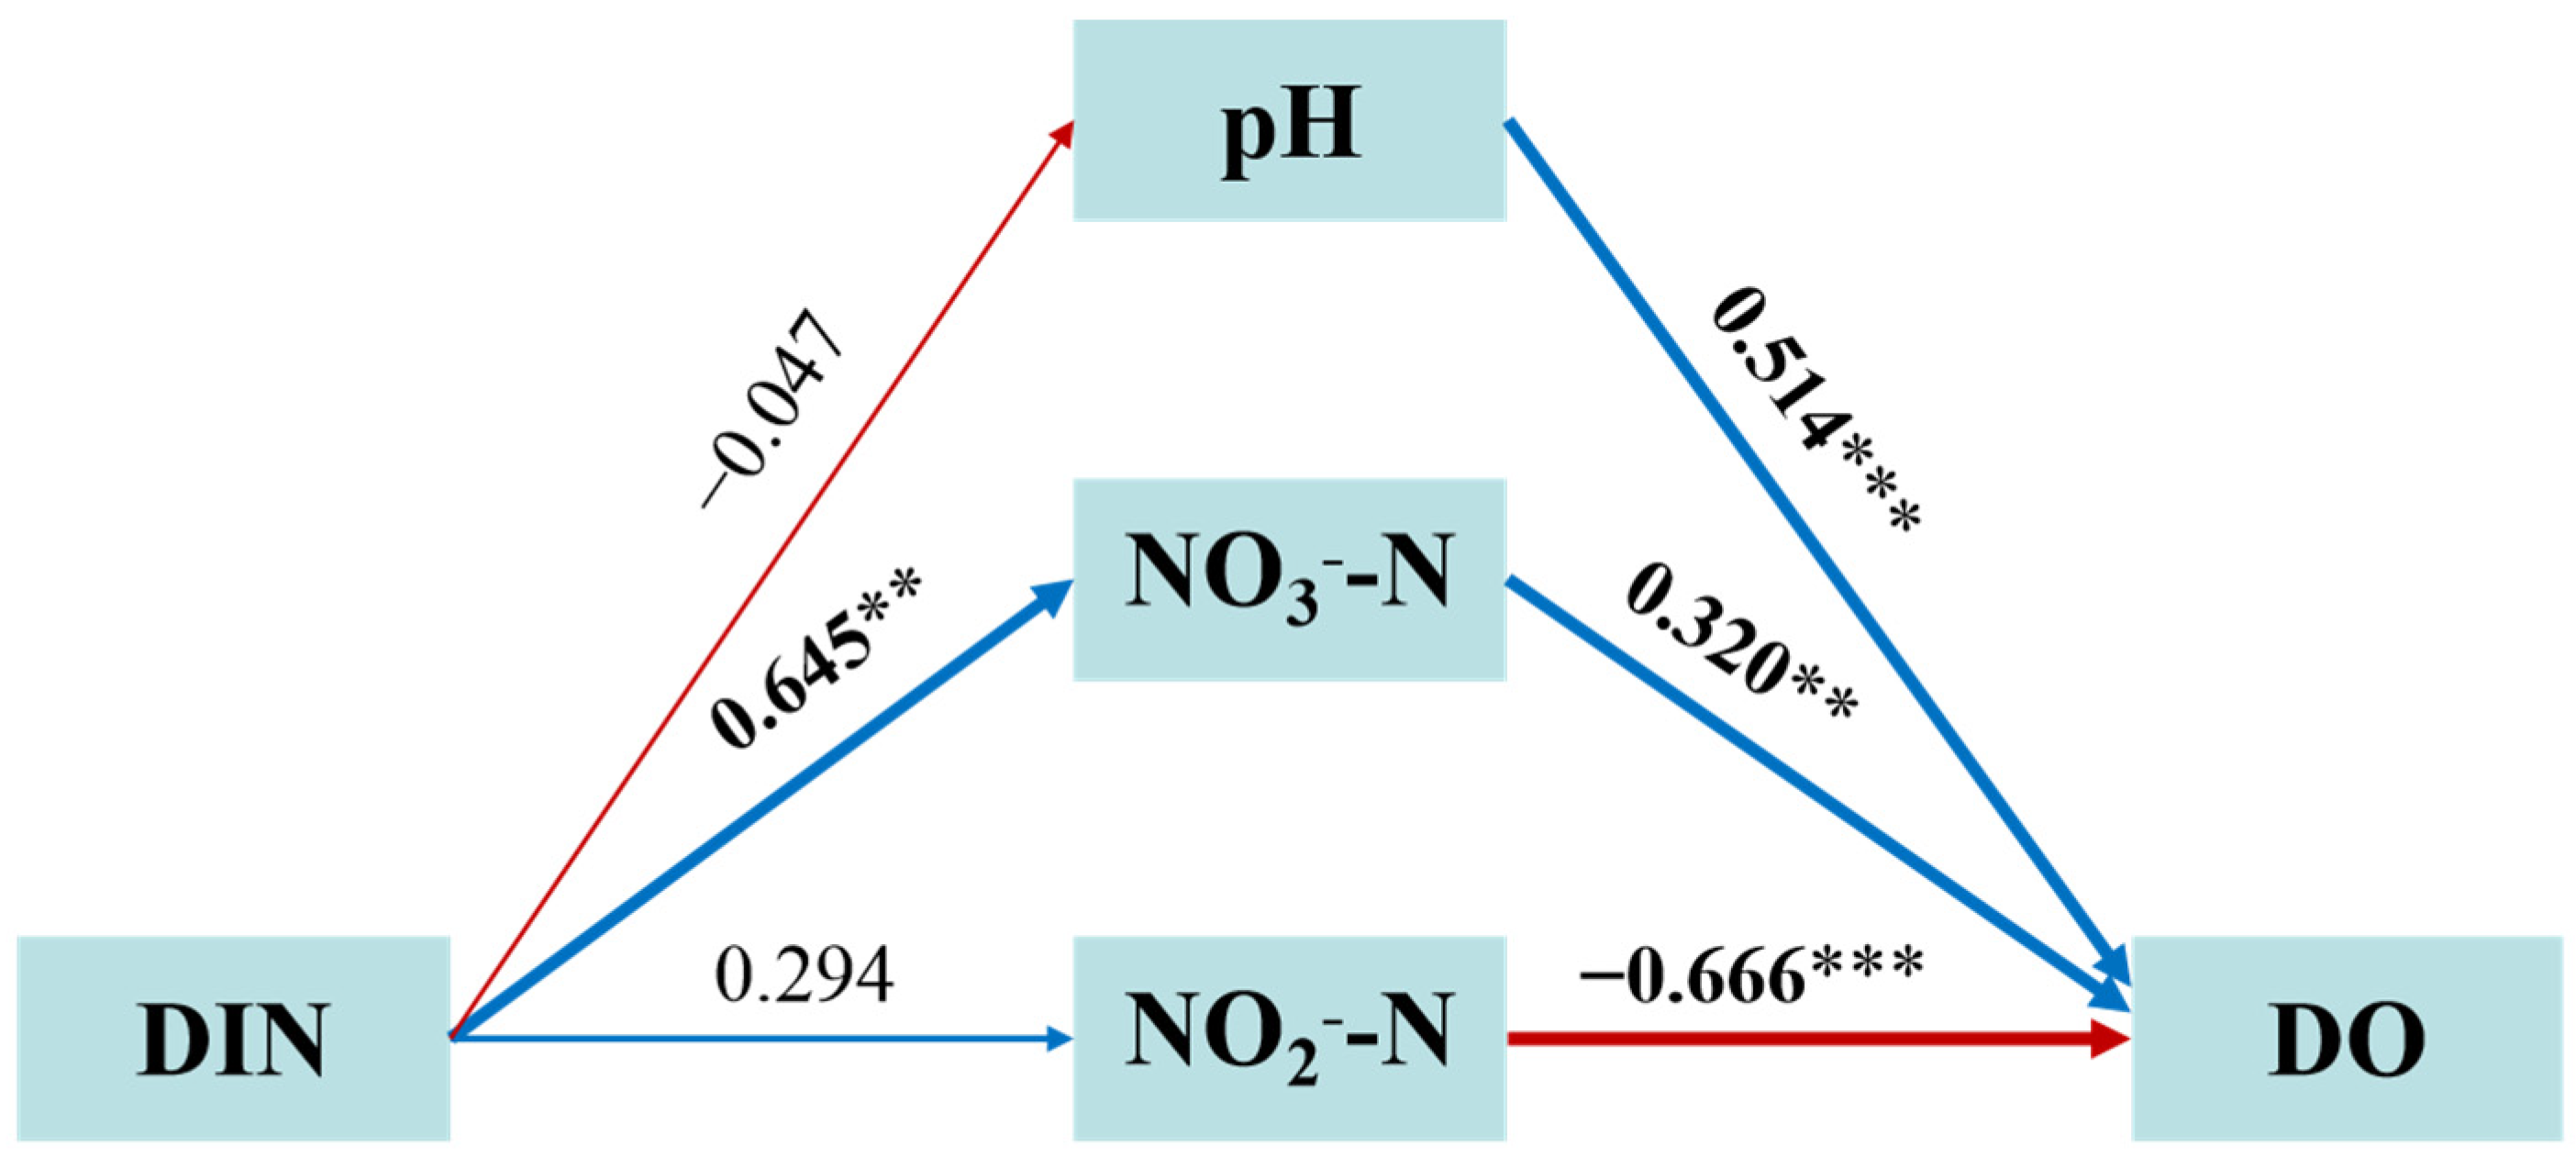
- DIN promotes NO2− oxidation—which consumes DO in the overlying water—maintaining DO concentration at a lower level.
- Thus, the SWR and HRT jointly determine the outcome of the overlying water quality. In the future, greater attention should be paid to the roles of SWR and HRT in nutrient-release processes from sediments. This study can provide a theoretical basis for controlling the reversion of black-odorous water bodies.
Author Contributions
Funding
Data Availability Statement
Conflicts of Interest
References
- Galloway, J.N.; Dentener, F.J.; Capone, D.G.; Boyer, E.W.; Howarth, R.W.; Seitzinger, S.P.; Asner, G.P.; Cleveland, C.C.; Green, P.A.; Holland, E.A.; et al. Nitrogen Cycles: Past, Present, and Future. Biogeochemistry 2004, 70, 153–226. [Google Scholar] [CrossRef]
- He, Q.; Xie, Z.; Tang, M.; Fu, Z.; Ma, J.; Wang, H.; Zhang, W.; Zhang, H.; Wang, M.; Hu, J.; et al. Insights into the simultaneous nitrification, denitrification and phosphorus removal process for in situ sludge reduction and potential phosphorus recovery. Sci. Total Environ. 2021, 801, 149569. [Google Scholar] [CrossRef] [PubMed]
- Zhu, D.; Cheng, X.; Sample, D.J.; Yazdi, M.N. The effect of temperature on sulfate release from Pearl River sediments in South China. Sci. Total Environ. 2019, 688, 1112–1123. [Google Scholar] [CrossRef]
- Goodkin, N.; Switzer, A.D.; Mccorry, D.; DeVantier, L.; True, J.D.; Hughen, K.A.; Angeline, N.; Yang, T.T. Coral communities of Hong Kong: Long-lived corals in a marginal reef environment. Mar. Ecol. Prog. Ser. 2011, 426, 185–196. [Google Scholar] [CrossRef]
- Fu, F.; Huang, S.; Hu, H.; Yao, L.; Wang, Y.; Yuan, J.; Gong, Z.; Wu, J.; Zhang, Y. Transformation of N and S pollutants and characterization of microbial communities in constructed wetlands with Vallisneria natans. J. Water Process Eng. 2021, 42, 102186. [Google Scholar] [CrossRef]
- Li, Z.; Sheng, Y.; Yang, J.; Burton, E.D. Phosphorus release from coastal sediments: Impacts of the oxidation-reduction potential and sulfide. Mar. Pollut. Bull. 2016, 113, 176–181. [Google Scholar] [CrossRef] [PubMed]
- Peng, C.; Huang, Y.; Yan, X.; Jiang, L.; Wu, X.; Zhang, W.; Wang, X. Effect of overlying water pH, temperature, and hydraulic disturbance on heavy metal and nutrient release from drinking water reservoir sediments. Water Environ. Res. 2021, 93, 2135–2148. [Google Scholar] [CrossRef]
- Bareket, M.M.; Bookman, R.; Katsman, R.; Stigter, H.; Herut, B. The role of transport processes of particulate mercury in modifying marine anthropogenic secondary sources, the case of Haifa bay, Israel. Mar. Pollut. Bull. 2016, 105, 286–291. [Google Scholar] [CrossRef]
- Hu, T.; Shi, M.; Mao, Y.; Liu, W.; Li, M.; Yu, Y.; Yu, H.; Cheng, C.; Zhang, Z.; Zhang, J.; et al. The characteristics of polycyclic aromatic hydrocarbons and heavy metals in water and sediment of dajiuhu subalpine wetland, shennongjia, central China, 2018-2020: Insights for sources, sediment-water exchange, and ecological risk. Chemosphere 2022, 309, 136788. [Google Scholar] [CrossRef]
- Herbeck, L.S.; Unger, D.; Wu, Y.; Jennerjahn, T.C. Effluent, nutrient and organic matter export from shrimp and fish ponds causing eutrophication in coastal and back-reef waters of NE Hainan, tropical China. Cont. Shelf Res. 2013, 57, 92–104. [Google Scholar] [CrossRef]
- Howarth, R.W.; Marino, R. Nitrogen as the limiting nutrient for eutrophication in coastal marine ecosystems: Evolving views over three decades. Limnol. Oceanogr. 2006, 51, 364–376. [Google Scholar] [CrossRef]
- Jiang, M.; Feng, L.; Zheng, X.; Chen, Y. Bio-denitrification performance enhanced by graphene-facilitated iron acquisition. Water Res. 2020, 180, 115916. [Google Scholar] [CrossRef] [PubMed]
- Smolders, A.J.P.; Lamers, L.P.M.; Lucassen, E.C.H.E.; Van Der Velde, G.; Roelofs, J.G.M. Internal eutrophication: How it works and what to do about it—A review. Chem. Ecol. 2006, 22, 93–111. [Google Scholar] [CrossRef]
- Conley, D.J.; Humborg, C.; Rahm, L.; Savchuk, O.P.; Wulff, F. Hypoxia in the Baltic Sea and Basin-Scale Changes in Phosphorus Biogeochemistry. Environ. Sci. Technol. 2002, 36, 5315–5320. [Google Scholar] [CrossRef] [PubMed]
- Friedl, G.; Dinkel, C.; Wehrli, B. Benthic fluxes of nutrients in the northwestern Black Sea. Mar. Chem. 1998, 62, 77–88. [Google Scholar] [CrossRef]
- Pratihary, A.K.; Naqvi, S.W.A.; Naik, H.; Thorat, B.R.; Narvenkar, G.; Manjunatha, B.R.; Rao, V.P. Benthic fluxes in a tropical Estuary and their role in the ecosystem. Estuar. Coast. Shelf Sci. 2009, 85, 387–398. [Google Scholar] [CrossRef]
- Soetan, O.; Nie, J.; Feng, H. Preliminary environmental assessment of metal-contaminated sediment dredging in an Urban River, New Jersey, USA. Mar. Pollut. Bull. 2022, 184, 114212. [Google Scholar] [CrossRef] [PubMed]
- Pires, A.P.F.; Marino, N.A.C.; Srivastava, D.S.; Farjalla, V.F. Predicted rainfall changes disrupt trophic interactions in a tropical aquatic ecosystem. Ecology 2016, 97, 2750–2759. [Google Scholar] [CrossRef] [PubMed]
- Wang, X.; Li, J.; Li, Y.; Shen, Z.; Wang, X.; Yang, Z.; Lou, I. Is urban development an urban river killer? A case study of Yongding Diversion Channel in Beijing, China. J. Environ. Sci. 2014, 26, 1232–1237. [Google Scholar] [CrossRef] [PubMed]
- Wen, M.; Shan, H.; Zhang, S.; Liu, X.; Jia, Y. Contribution of waves and currents to sediment resuspension in the Yellow River Delta. Mar. Georesour. Geotechnol. 2019, 37, 96–102. [Google Scholar] [CrossRef]
- Yousif, R.; Warren, C.; Ben-Hamadou, R.; Husrevoglu, S. Modeling sediment transport in Qatar: Application for coastal development planning. Integr. Environ. Assess. Manag. 2018, 14, 240–251. [Google Scholar] [CrossRef] [PubMed]
- Tavakoly Sany, S.B.; Hashim, R.; Rezayi, M.; Salleh, A.; Safari, O. A review of strategies to monitor water and sediment quality for a sustainability assessment of marine environment. Environ. Sci. Pollut. Res. 2014, 21, 813–833. [Google Scholar] [CrossRef]
- Xu, J.; He, S.; Wu, S.; Huang, J.; Zhou, W.; Chen, X. Effects of HRT and water temperature on nitrogen removal in autotrophic gravel filter. Chemosphere 2016, 147, 203–209. [Google Scholar] [CrossRef] [PubMed]
- Hua, Z.; Wang, Y. Advance on the release of pollutants in river and lake sediments under hydrodynamic conditions. J. Hohai Univ. (Nat. Sci.) 2018, 46, 95–105. [Google Scholar] [CrossRef]
- Wang, P.; Li, Q.; Cai, Y. Effect of sediment resuspension on BPA adsorption in Taihu Lake. Water Resour. Prot. 2015, 31, 35–41. [Google Scholar] [CrossRef]
- Bai, G.; Zhang, Y.; Yan, P.; Yan, W.; Kong, L.; Wang, L.; Wang, C.; Liu, Z.; Liu, B.; Ma, J.; et al. Spatial and seasonal variation of water parameters, sediment properties, and submerged macrophytes after ecological restoration in a long-term (6 year) study in Hangzhou west lake in China: Submerged macrophyte distribution influenced by environmental variables. Water Res. 2020, 186, 116379. [Google Scholar] [CrossRef]
- Liu, Z.; Li, W.; Zhang, X.; Zhang, K.; Chen, S.; Xiong, W. Influence of Submerged Macrophytes on Phosphorus Transference between Overlying Water and Sediment in the Growth Period under Static and Flowing Conditions. Res. Environ. Sci. 2022; in press. [Google Scholar] [CrossRef]
- Diaz, R.J.; Rutger, R. Spreading Dead Zones and Consequences for Marine Ecosystems. Science 2008, 321, 926–929. [Google Scholar] [CrossRef]
- Robert, A.R.; Suvasis, D.; Kate, M.C.; Adam, D.J.; Janet, G.H.; Peggy, A.O. Arsenic sequestration by sorption processes in high-iron sediments. Geochim. Cosmochim. Acta 2007, 71, 5782–5803. [Google Scholar] [CrossRef]
- Han, C.; Ding, S.; Yao, L.; Shen, Q.; Zhu, C.; Wang, Y.; Xu, D. Dynamics of phosphorus-iron-sulfur at the sediment-water interface influenced by algae blooms decomposition. J. Hazard. Mater. 2015, 300, 329–337. [Google Scholar] [CrossRef]
- Shen, Q.; Cheng, L.; Zhou, Q.; Shang, J.; Zhang, L.; Fan, C. Effects of physical and chemical characteristics of surface sediments in the formation of shallow lake algae-induced black bloom. J. Environ. Sci. 2013, 25, 2353–2360. [Google Scholar] [CrossRef]
- Galloway, J.N.; Townsend, A.R.; Erisman, J.W.; Bekunda, M.; Cai, Z.; Freney, J.R.; Martinelli, L.A.; Seitzinger, S.P.; Sutton, M.A. Transformation of the Nitrogen Cycle: Recent Trends, Questions, and Potential Solutions. Science 2008, 320, 889–892. [Google Scholar] [CrossRef] [PubMed]
- Liu, W.R.; Zhao, J.L.; Liu, Y.S.; Chen, Z.F.; Yang, Y.Y.; Zhang, Q.Q.; Ying, G.G. Biocides in the Yangtze River of China: Spatiotemporal distribution, mass load and risk assessment. Environ. Pollut. 2015, 200, 53–63. [Google Scholar] [CrossRef] [PubMed]
- Chavan, P.V.; Dennett, K.E.; Marchand, E.A. Behavior of Pilot-Scale Constructed Wetlands in Removing Nutrients and Sediments Under Varying Environmental Conditions. Water Air Soil Pollut. 2008, 192, 239–250. [Google Scholar] [CrossRef]
- Wei, D.; Singh, R.P.; Li, Y.; Fu, D. Nitrogen removal efficiency of surface flow constructed wetland for treating slightly polluted river water. Environ. Sci. Pollut. Res. 2020, 27, 24902–24913. [Google Scholar] [CrossRef]
- Hollander, M.; Wolfe, D.A.; Chicken, E. Nonparametric Statistical Methods, 3rd ed.; John Wiley & Sons, Inc.: Hoboken, NJ, USA, 2015; pp. 451–494. [Google Scholar]
- Ma, S.; Wang, H.; Wang, H.; Zhang, M.; Li, Y.; Bian, S.; Liang, X.; Søndergaard, M.; Jeppesen, E. Effects of nitrate on phosphorus release from lake sediments. Water Res. 2021, 194, 116894. [Google Scholar] [CrossRef]
- Kheirollahpour, M.; Shohaimi, S.; Marchini, J.S. Dimensional Model for Estimating Factors influencing Childhood Obesity: Path Analysis Based Modeling. Sci. World J. 2014, 2014, 512148. [Google Scholar] [CrossRef] [PubMed]
- Kpolovie, P. Statistical Analysis with SPSS for Research, 1st ed.; ECRTD Publication: London, UK, 2017; pp. 355–392. ISBN 978-1-5272-0701-1. [Google Scholar]
- Niu, T.; Zhou, Z.; Shen, X.; Qiao, W.; Jiang, L.; Pan, W.; Zhou, J. Effects of dissolved oxygen on performance and microbial community structure in a micro-aerobic hydrolysis sludge in situ reduction process. Water Res. 2016, 90, 369–377. [Google Scholar] [CrossRef]
- Wu, Y.; Wen, Y.; Zhou, J.; Wu, Y. Phosphorus release from lake sediments: Effects of pH, temperature and dissolved oxygen. KSCE J. Civ. Eng. 2014, 18, 323–329. [Google Scholar] [CrossRef]
- Fan, J.H.; Liu, X.Y.; Gu, Q.Y.; Zhang, M.J.; Hu, X.W. Effect of hydraulic retention time and pH on oxidation of ferrous iron in simulated ferruginous acid mine drainage treatment with inoculation of iron-oxidizing bacteria. Water Sci. Eng. 2019, 12, 213–220. [Google Scholar] [CrossRef]
- Li, Y.; Xia, B.; Zhang, J.; Li, C.; Zhu, W. Assessing high resolution oxidation-reduction potential and soluble reactive phosphorus variation across vertical sediments and water layers in Xinghu Lake: A novel laboratory approach. J. Environ. Sci. 2010, 22, 982–990. [Google Scholar] [CrossRef]
- Hamersley, M.R.; Howes, B.L. Control of denitrification in a septage-treating artificial wetland: The dual role of particulate organic carbon. Water Res. 2002, 36, 4415–4427. [Google Scholar] [CrossRef] [PubMed]
- Søndergaard, M.; Jensen, J.P.; Jeppesen, E. Role of sediment and internal loading of phosphorus in shallow lakes. Hydrobiologia 2003, 506, 135–145. [Google Scholar] [CrossRef]
- Fu, K.; Yang, F.; Jin, Y.; Liu, L.; Yang, Z.; Chou, F. Effect of intermittent aeration strategy based on dissolved oxygen and anoxic period regulation on partial nitrification process. Chin. J. Environ. Eng. 2022, 16, 824–836. [Google Scholar] [CrossRef]
- Xu, W.; Gu, G.; Chen, Y. Research on Effect of SRT on A/A/O Biological Nutrient Removal and Simulation. Technol. Water Treat. 2007, 33, 68–71. [Google Scholar] [CrossRef]
- Denis, L.; Grenz, C.; Alliot, É.; Rodier, M. Temporal variability in dissolved inorganic nitrogen fluxes at the sediment-water interface and related annual budget on a continental shelf (NW Mediterranean)Variabilité temporelle des flux d’azote inorganique dissous à l’interface eau–sédiment et bilan annuel sur un plateau continental (Méditerranée nord occidentale). Oceanol. Acta 2001, 24, 85–97. [Google Scholar] [CrossRef]
- Trimmer, M.; Nedwell, D.B.; Sivyer, D.B.; Malcolm, S.J. Seasonal organic mineralisation and denitrification in intertidal sediments and their relationship to the abundance of Enteromorpha sp. and Ulva sp. Mar. Ecol. Prog. Ser. 2000, 203, 67–80. [Google Scholar] [CrossRef]
- Chen, Z.; Chen, N.; Wu, Y.; Mo, Q.; Zhou, X.; Lu, T.; Tian, Y. Sediment-water Flux and Processes of Nutrients and Gaseous Nitrogen Release in a China Reservoir. Environ. Sci. 2014, 35, 3325–3335. [Google Scholar] [CrossRef]
- Jing, L.D.; Wu, C.X.; Liu, J.T.; Wang, H.G.; Ao, H.Y. The effects of dredging on nitrogen balance in sediment-water microcosms and implications to dredging projects. Ecol. Eng. 2013, 52, 167–174. [Google Scholar] [CrossRef]
- Yuan, H.; Huang, S.; Yuan, J.; You, Y.; Zhang, Y. Characteristics of microbial denitrification under different aeration intensities: Performance, mechanism, and co-occurrence network. Sci. Total Environ. 2021, 754, 141965. [Google Scholar] [CrossRef]
- Bohlen, L.; Dale, A.W.; Sommer, S.; Mosch, T.; Hensen, C.; Noffke, A.; Scholz, F.; Wallmann, K. Benthic nitrogen cycling traversing the Peruvian oxygen minimum zone. Geochim. Cosmochim. Acta 2011, 75, 6094–6111. [Google Scholar] [CrossRef]
- Beman, J.M.; Vargas, S.M.; Wilson, J.M.; Perez-Coronel, E.; Karolewski, J.S.; Vazquez, S.; Yu, A.; Cairo, A.E.; White, M.E.; Koester, I.; et al. Substantial oxygen consumption by aerobic nitrite oxidation in oceanic oxygen minimum zones. Nat. Commun. 2021, 12, 7043. [Google Scholar] [CrossRef] [PubMed]


| SWR a | HRT b | ||||||
|---|---|---|---|---|---|---|---|
| Stage 1 | Stage 2 | DOWS1 | DOWS2 | DOWS3 | |||
| DO | Asymp. Sig. | 0.001 ** | <0.001 *** | Z | −2.578 c | −1.023 c | −1.156 c |
| χ2 | 13.300 | 16.545 | Asymp. Sig. | 0.010 ** | 0.306 | 0.248 | |
| pH | Asymp. Sig. | 0.019 * | 0.004 ** | Z | −1.423 c | −0.356 d | −1.245 c |
| χ2 | 7.895 | 10.857 | Asymp. Sig. | 0.155 | 0.722 | 0.213 | |
| ORP | Asymp. Sig. | 0.086 | 0.004 ** | Z | −2.934 c | −2.490 c | −2.936 c |
| χ2 | 4.900 | 11.091 | Asymp. Sig. | 0.003 ** | 0.013 * | 0.003 ** | |
| COD | Asymp. Sig. | 0.329 | 0.406 | Z | −0.889 d | −0.652 c | −2.380 c |
| χ2 | 2.225 | 1.805 | Asymp. Sig. | 0.374 | 0.515 | 0.017 * | |
| DIN | Asymp. Sig. | 0.058 | 0.695 | Z | −1.689 c | −1.867 c | −1.956 c |
| χ2 | 5.700 | 0.727 | Asymp. Sig. | 0.091 | 0.062 | 0.050 | |
| NH4+-N | Asymp. Sig. | 0.411 | 0.070 | Z | −1.334 d | −1.156 c | −1.580 c |
| χ2 | 1.788 | 5.317 | Asymp. Sig. | 0.182 | 0.248 | 0.114 | |
| NO3−-N | Asymp. Sig. | 0.058 | 0.307 | Z | −1.867 c | −1.689 c | −2.045 c |
| χ2 | 5.700 | 2.364 | Asymp. Sig. | 0.062 | 0.091 | 0.041 * | |
| NO2−-N | Asymp. Sig. | 0.045 * | 0.074 | Z | −1.868 c | −1.201 c | −1.601 c |
| χ2 | 6.200 | 5.200 | Asymp. Sig. | 0.062 | 0.230 | 0.109 | |
| Fe | Asymp. Sig. | 0.782 | 0.148 | Z | −0.089 c | −0.178 c | −0.533 d |
| χ2 | 0.492 | 3.818 | Asymp. Sig. | 0.929 | 0.859 | 0.594 | |
| TP | Asymp. Sig. | 0.235 | 0.241 | Z | −0.178 c | −1.125 c | −1.960 c |
| χ2 | 2.896 | 2.850 | Asymp. Sig. | 0.859 | 0.260 | 0.50 * | |
| Step | R2 | F | p | Equation | ||
|---|---|---|---|---|---|---|
| Stage 1 | DOWS1 | 1 | 0.491 | 19.335 | <0.001 | DO = −4.855 (±1.104) NO2−-N + 5.457 (±0.864) |
| 2 | 0.712 | 24.464 | <0.001 | DO = −3.818 (±0.874) NO2−-N + 4.678 (±1.217) pH + 30.263 (±9.312) | ||
| 3 | 0.773 | 22.606 | <0.001 | DO = −3.765 (±0.775) NO2−-N + 4.046 (±1.112) pH + 0.572 (±0.241) NO3−-N − 26.734 (±8.392) | ||
| DOWS2 | 1 | 0.646 | 35.735 | <0.001 | DO = −3.298 (±0.552) NO2−-N + 6.048 (±0.456) | |
| DOWS3 | 1 | 0.434 | 15.561 | <0.001 | DO = −1.724 (±0.489) NO2−-N + 2.266 (±0.990) pH − 12.404 (±7.572) | |
| 2 | 0.544 | 12.352 | <0.001 | DO = −1.524 (±0.451) NO2−-N + 2.111 (±0.897) pH + 0.308 (±0.140) NH4+-N − 11.688 (±6.850) | ||
| Stage 2 | DOWS1 | No variables entered | ||||
| DWOS2 | 1 | 0.408 | 7.885 | 0.020 | DO = 12.817 (±4.564) TP + 3.628 (±0.101) | |
| DOWS3 | 1 | 0.620 | 14.705 | 0.004 | DO = 0.017 (±0.004) ORP + 1.572 (±0.575) | |
| 2 | 0.836 | 20.360 | <0.001 | DO = 0.015 (±0.003) ORP − 0.967 (±0.299) NO2−-N + 1.607 (±0.401) | ||
Disclaimer/Publisher’s Note: The statements, opinions and data contained in all publications are solely those of the individual author(s) and contributor(s) and not of MDPI and/or the editor(s). MDPI and/or the editor(s) disclaim responsibility for any injury to people or property resulting from any ideas, methods, instructions or products referred to in the content. |
© 2023 by the authors. Licensee MDPI, Basel, Switzerland. This article is an open access article distributed under the terms and conditions of the Creative Commons Attribution (CC BY) license (https://creativecommons.org/licenses/by/4.0/).
Share and Cite
Gong, Z.; Wang, Y.; Hu, H.; Chen, P.; Lu, Y.; Wang, L.; Huang, S. The Impact of Sediment–Water Ratio and Hydraulic Residence Time on the Release of Inorganic Nitrogen from Sediments in the Pearl River Delta. Water 2023, 15, 1789. https://doi.org/10.3390/w15091789
Gong Z, Wang Y, Hu H, Chen P, Lu Y, Wang L, Huang S. The Impact of Sediment–Water Ratio and Hydraulic Residence Time on the Release of Inorganic Nitrogen from Sediments in the Pearl River Delta. Water. 2023; 15(9):1789. https://doi.org/10.3390/w15091789
Chicago/Turabian StyleGong, Zerui, Yanling Wang, Heping Hu, Pengfei Chen, Yao Lu, Lei Wang, and Shaobin Huang. 2023. "The Impact of Sediment–Water Ratio and Hydraulic Residence Time on the Release of Inorganic Nitrogen from Sediments in the Pearl River Delta" Water 15, no. 9: 1789. https://doi.org/10.3390/w15091789