
Remotely Sensed Data, Morpho-Metric Analysis, and Integrated Method Approach for Flood Risk Assessment: Case Study of Wadi Al-Arish Landscape, Sinai, Egypt

 ,
,  ,
, 
Abstract
:1. Introduction
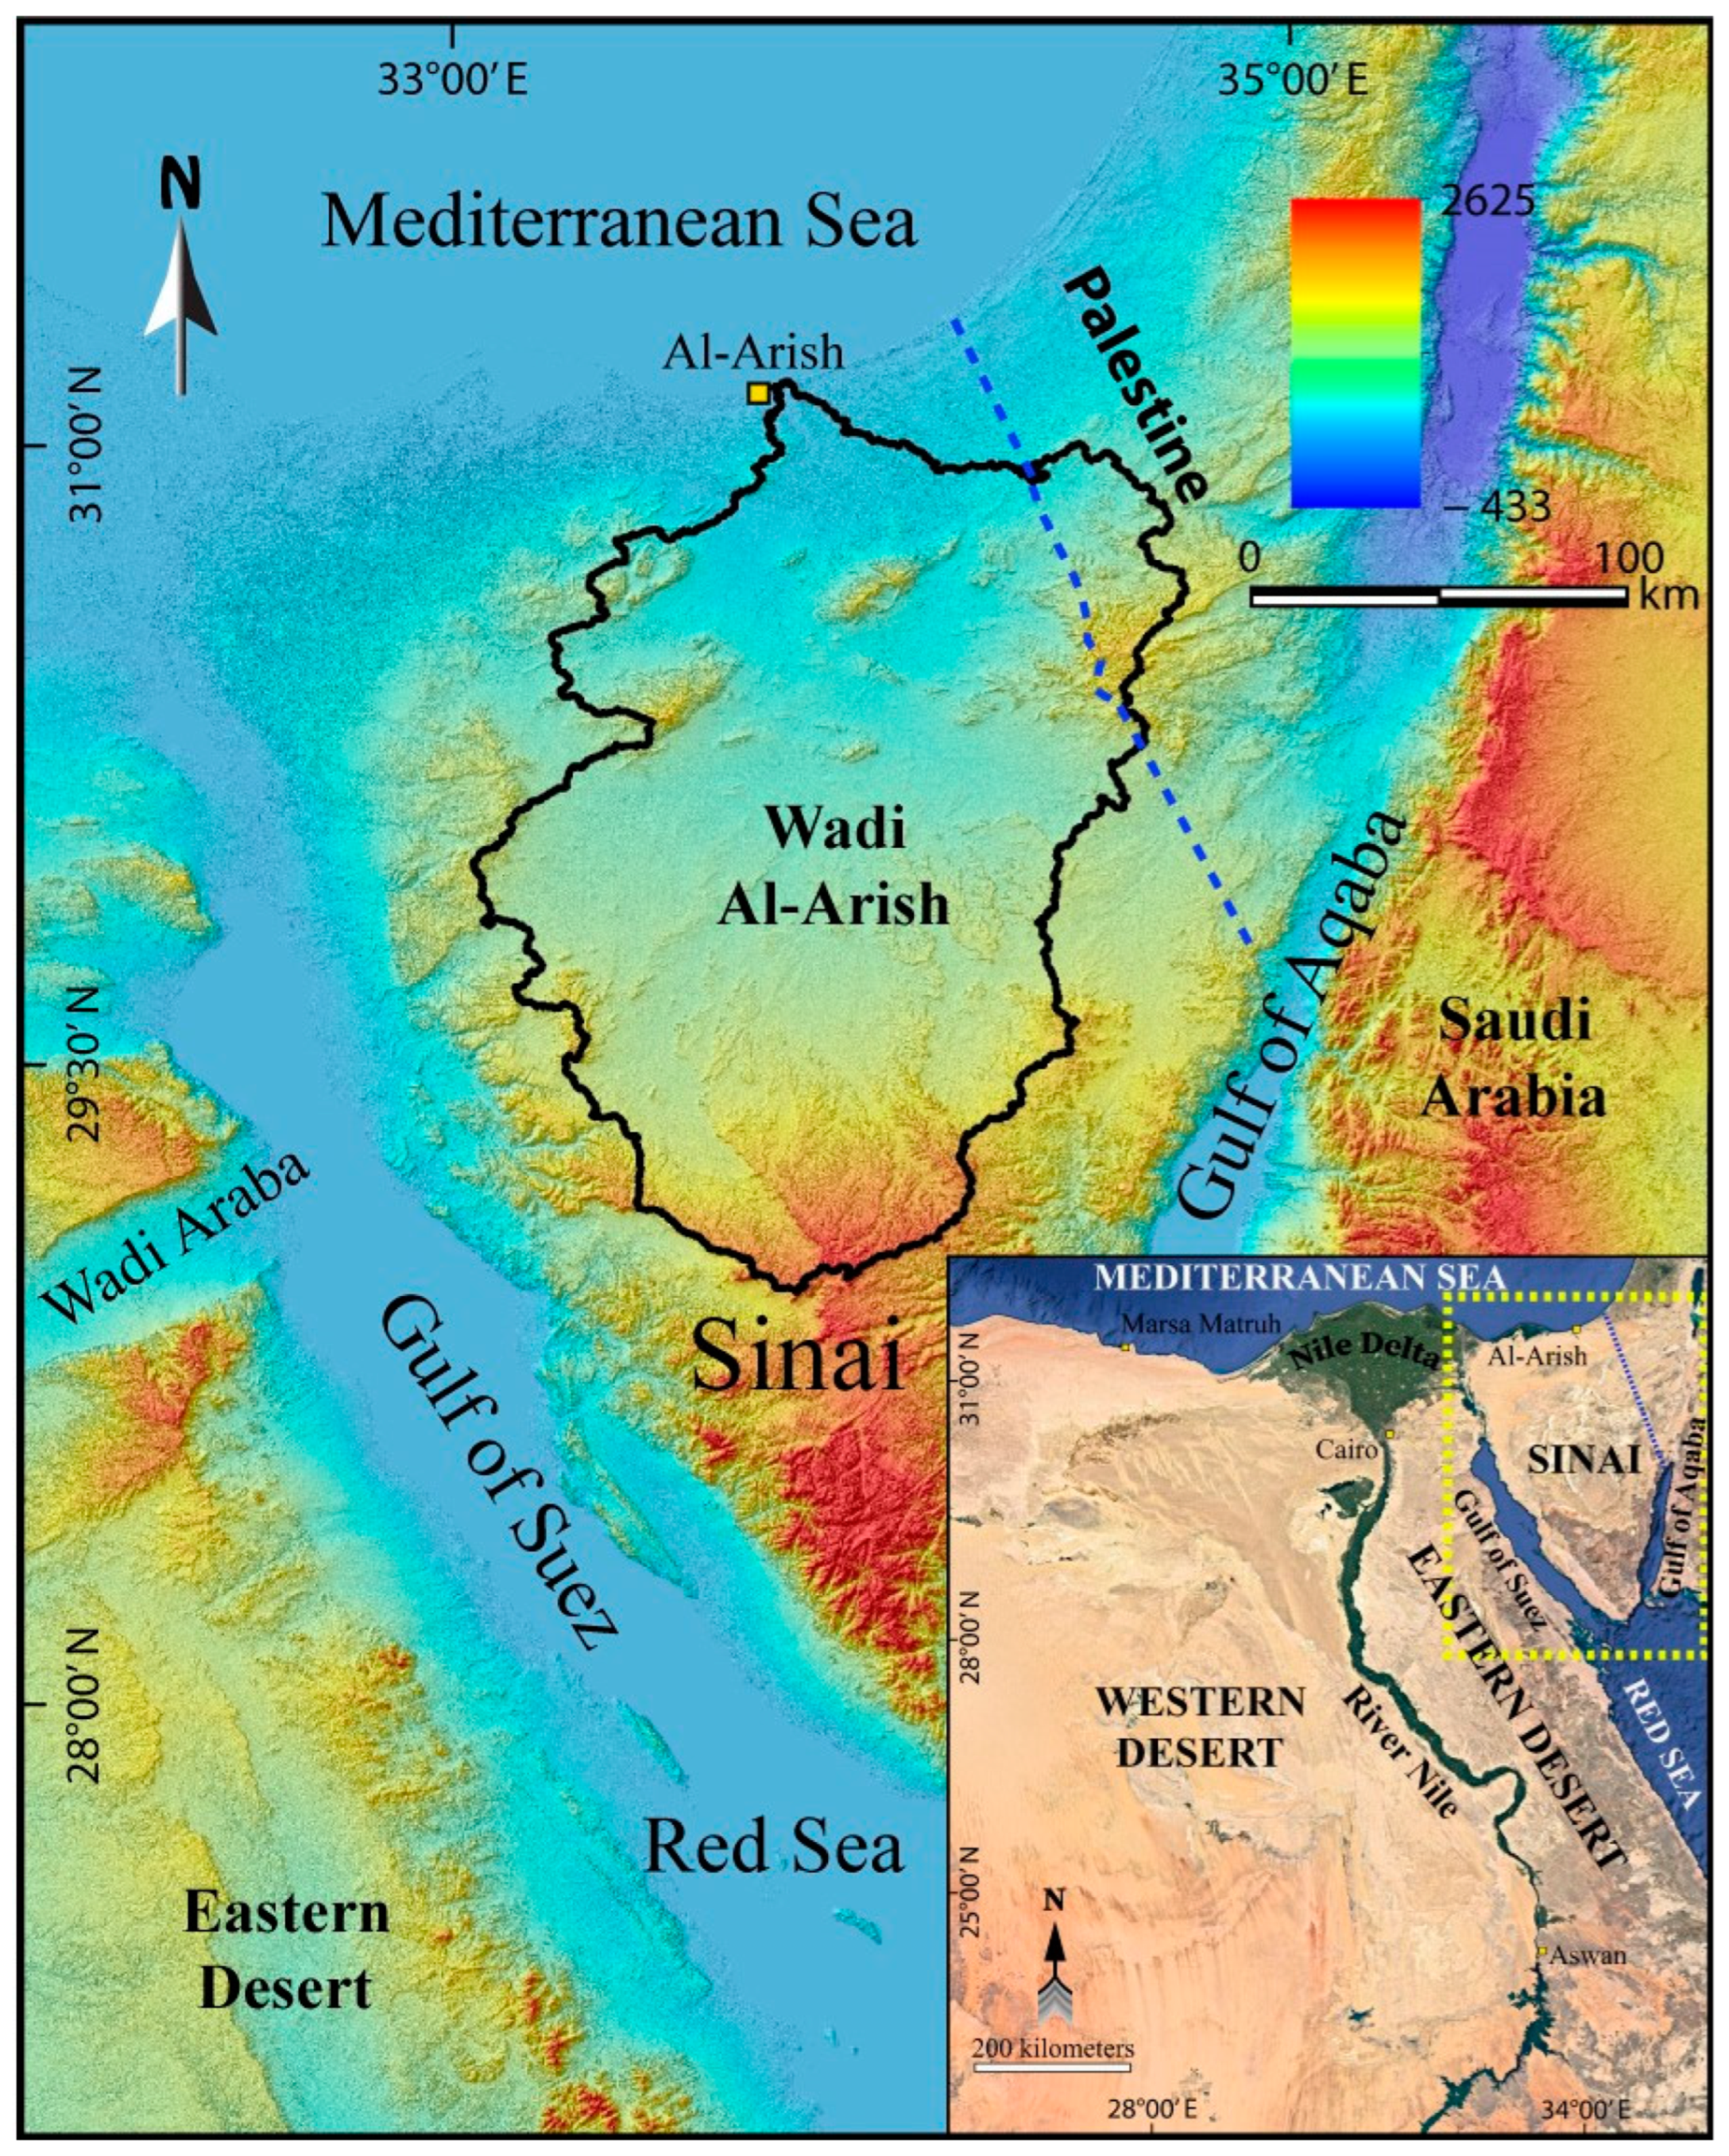
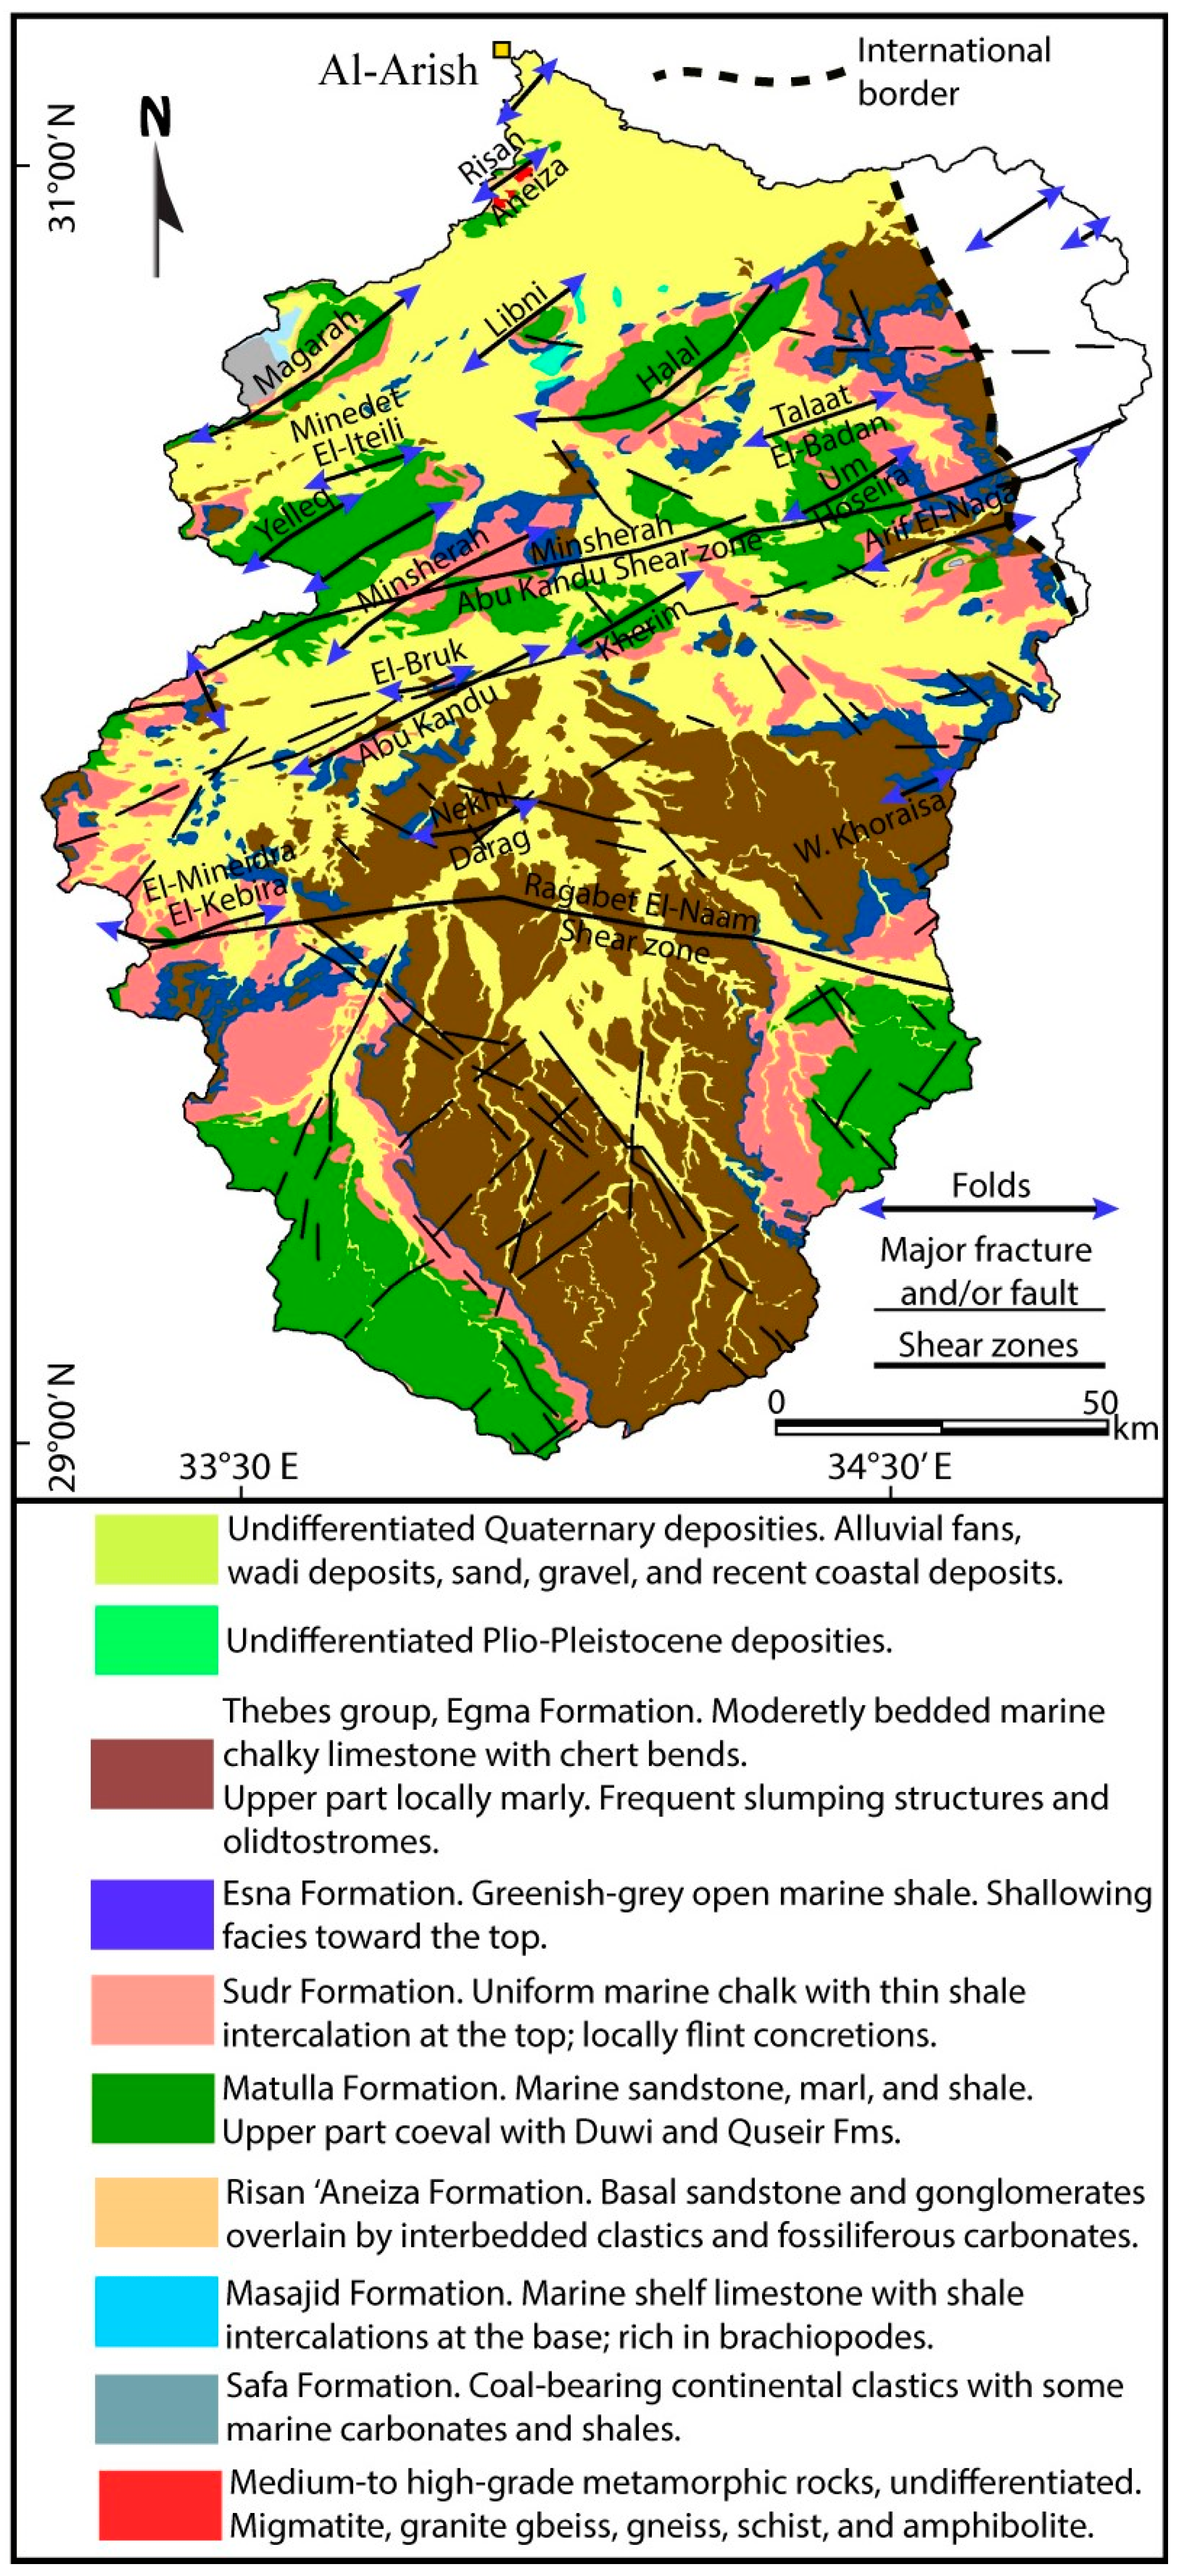
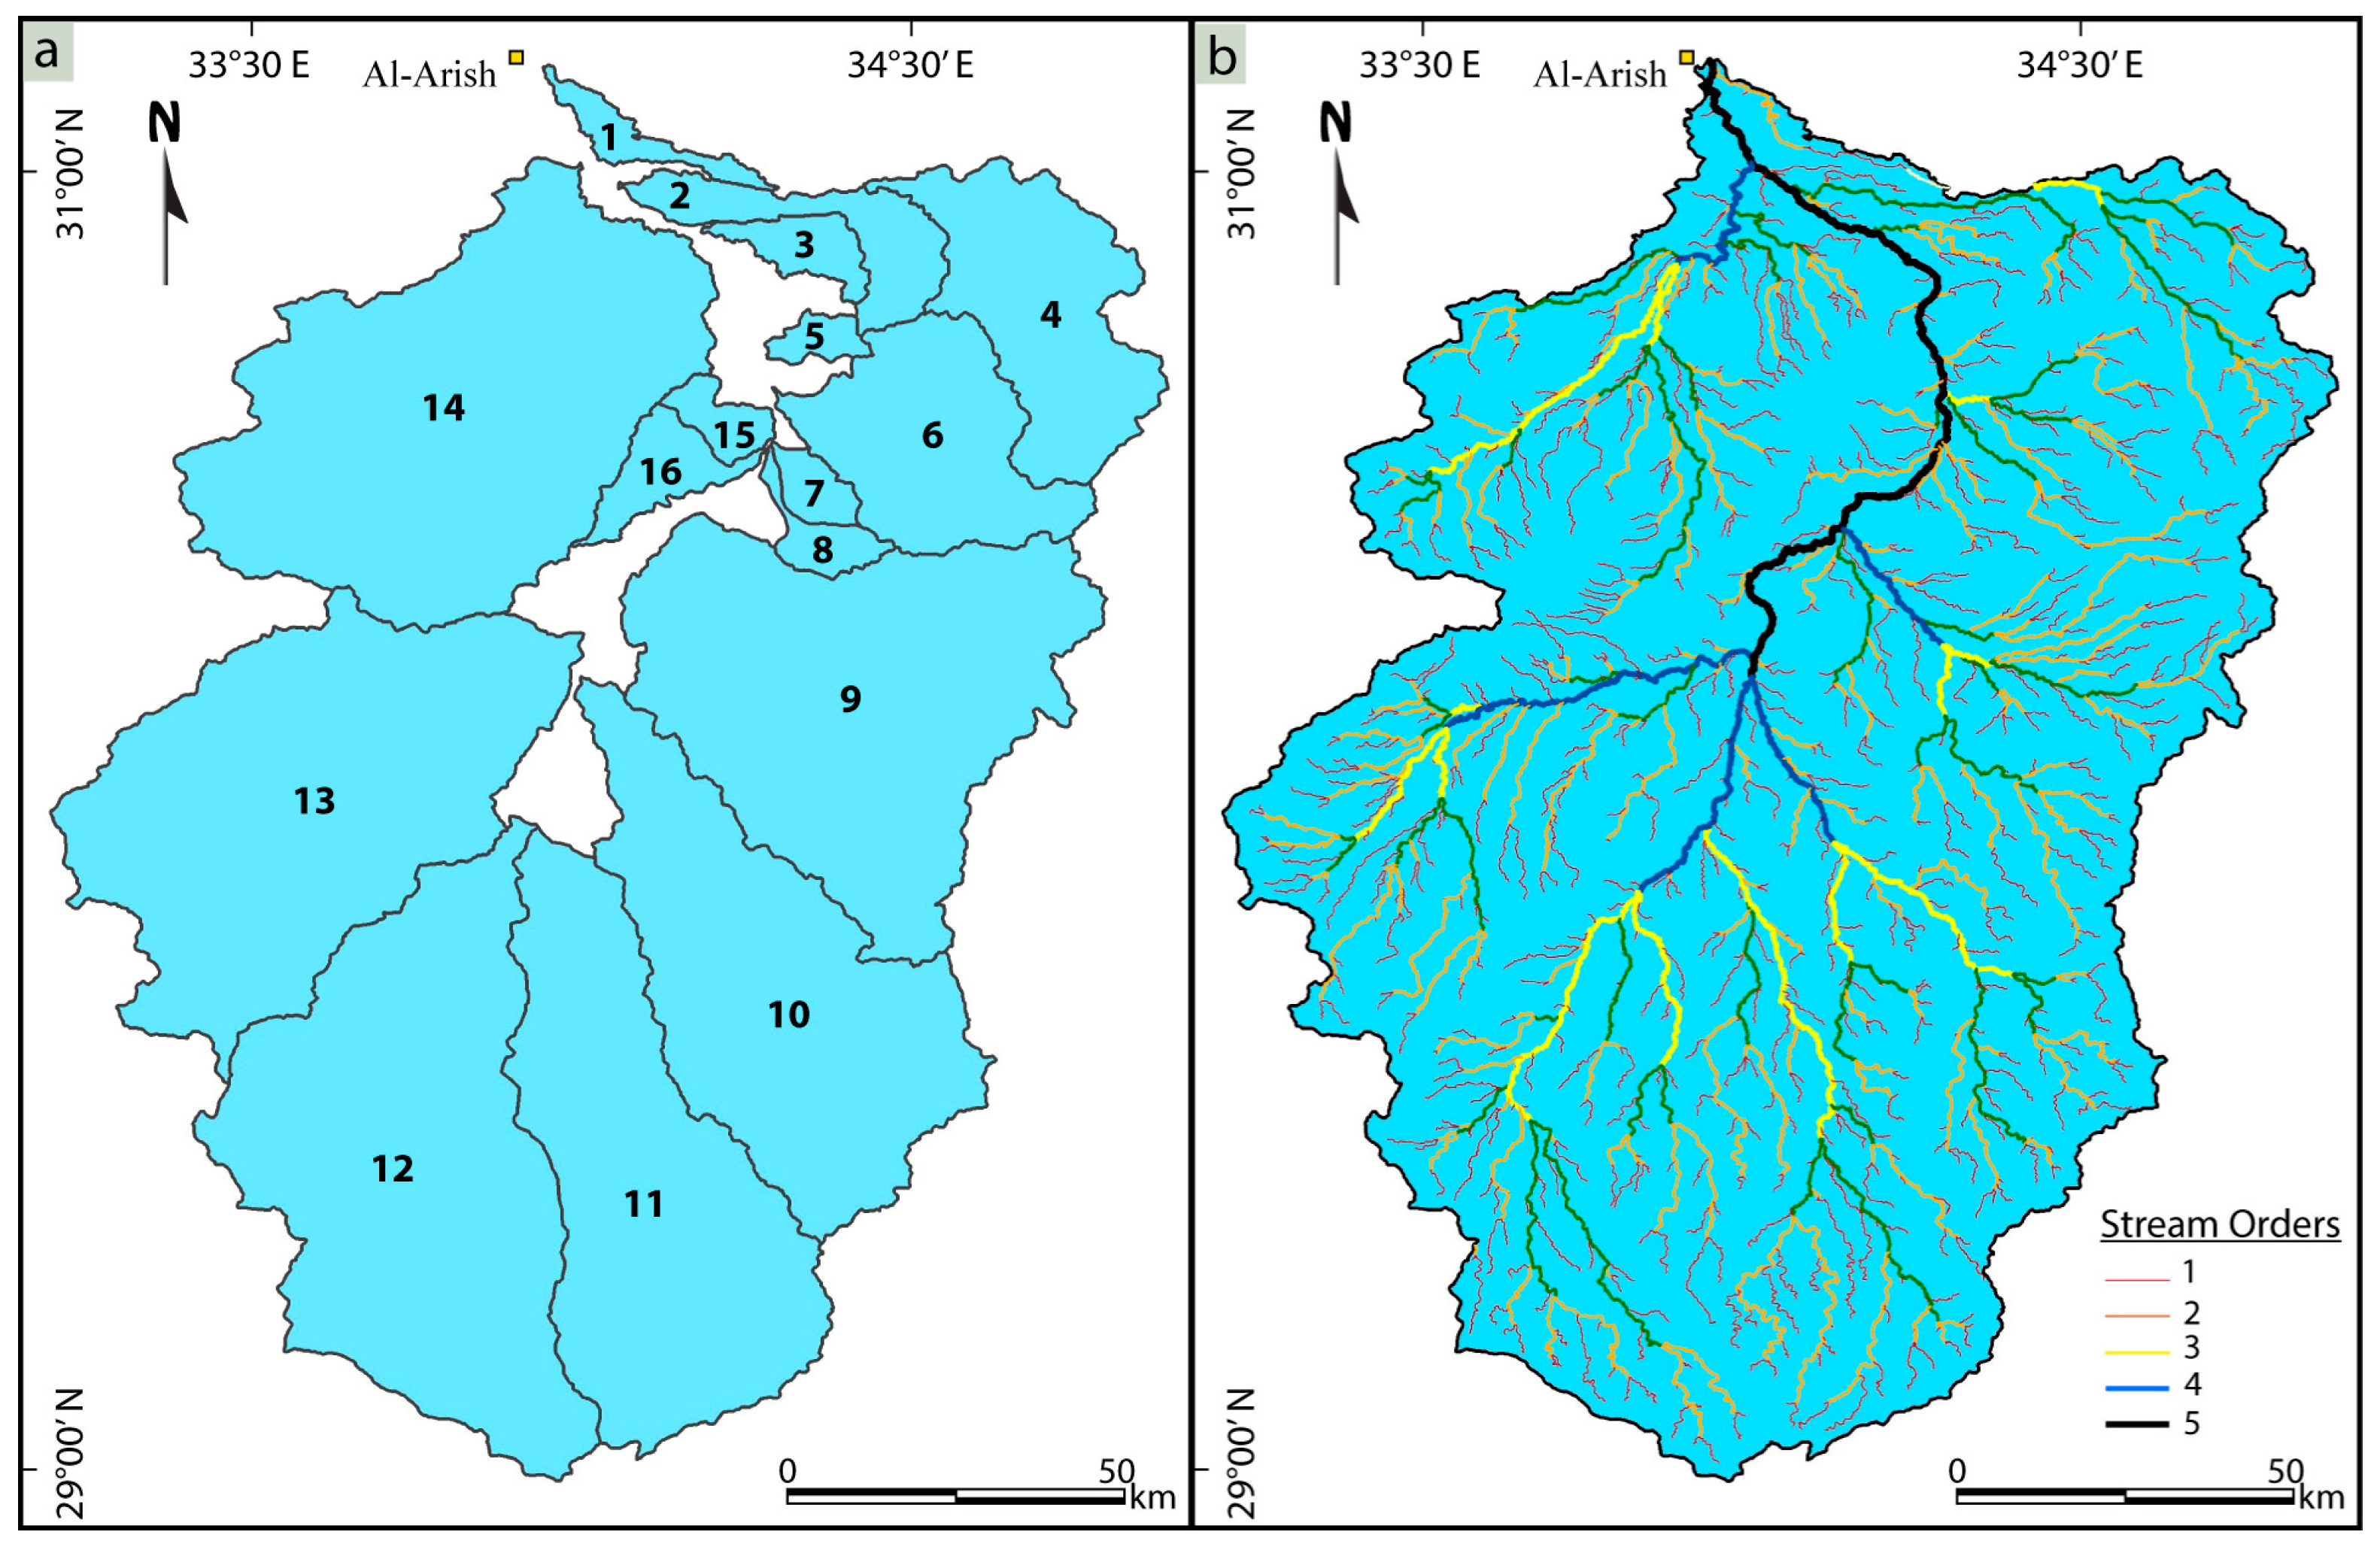
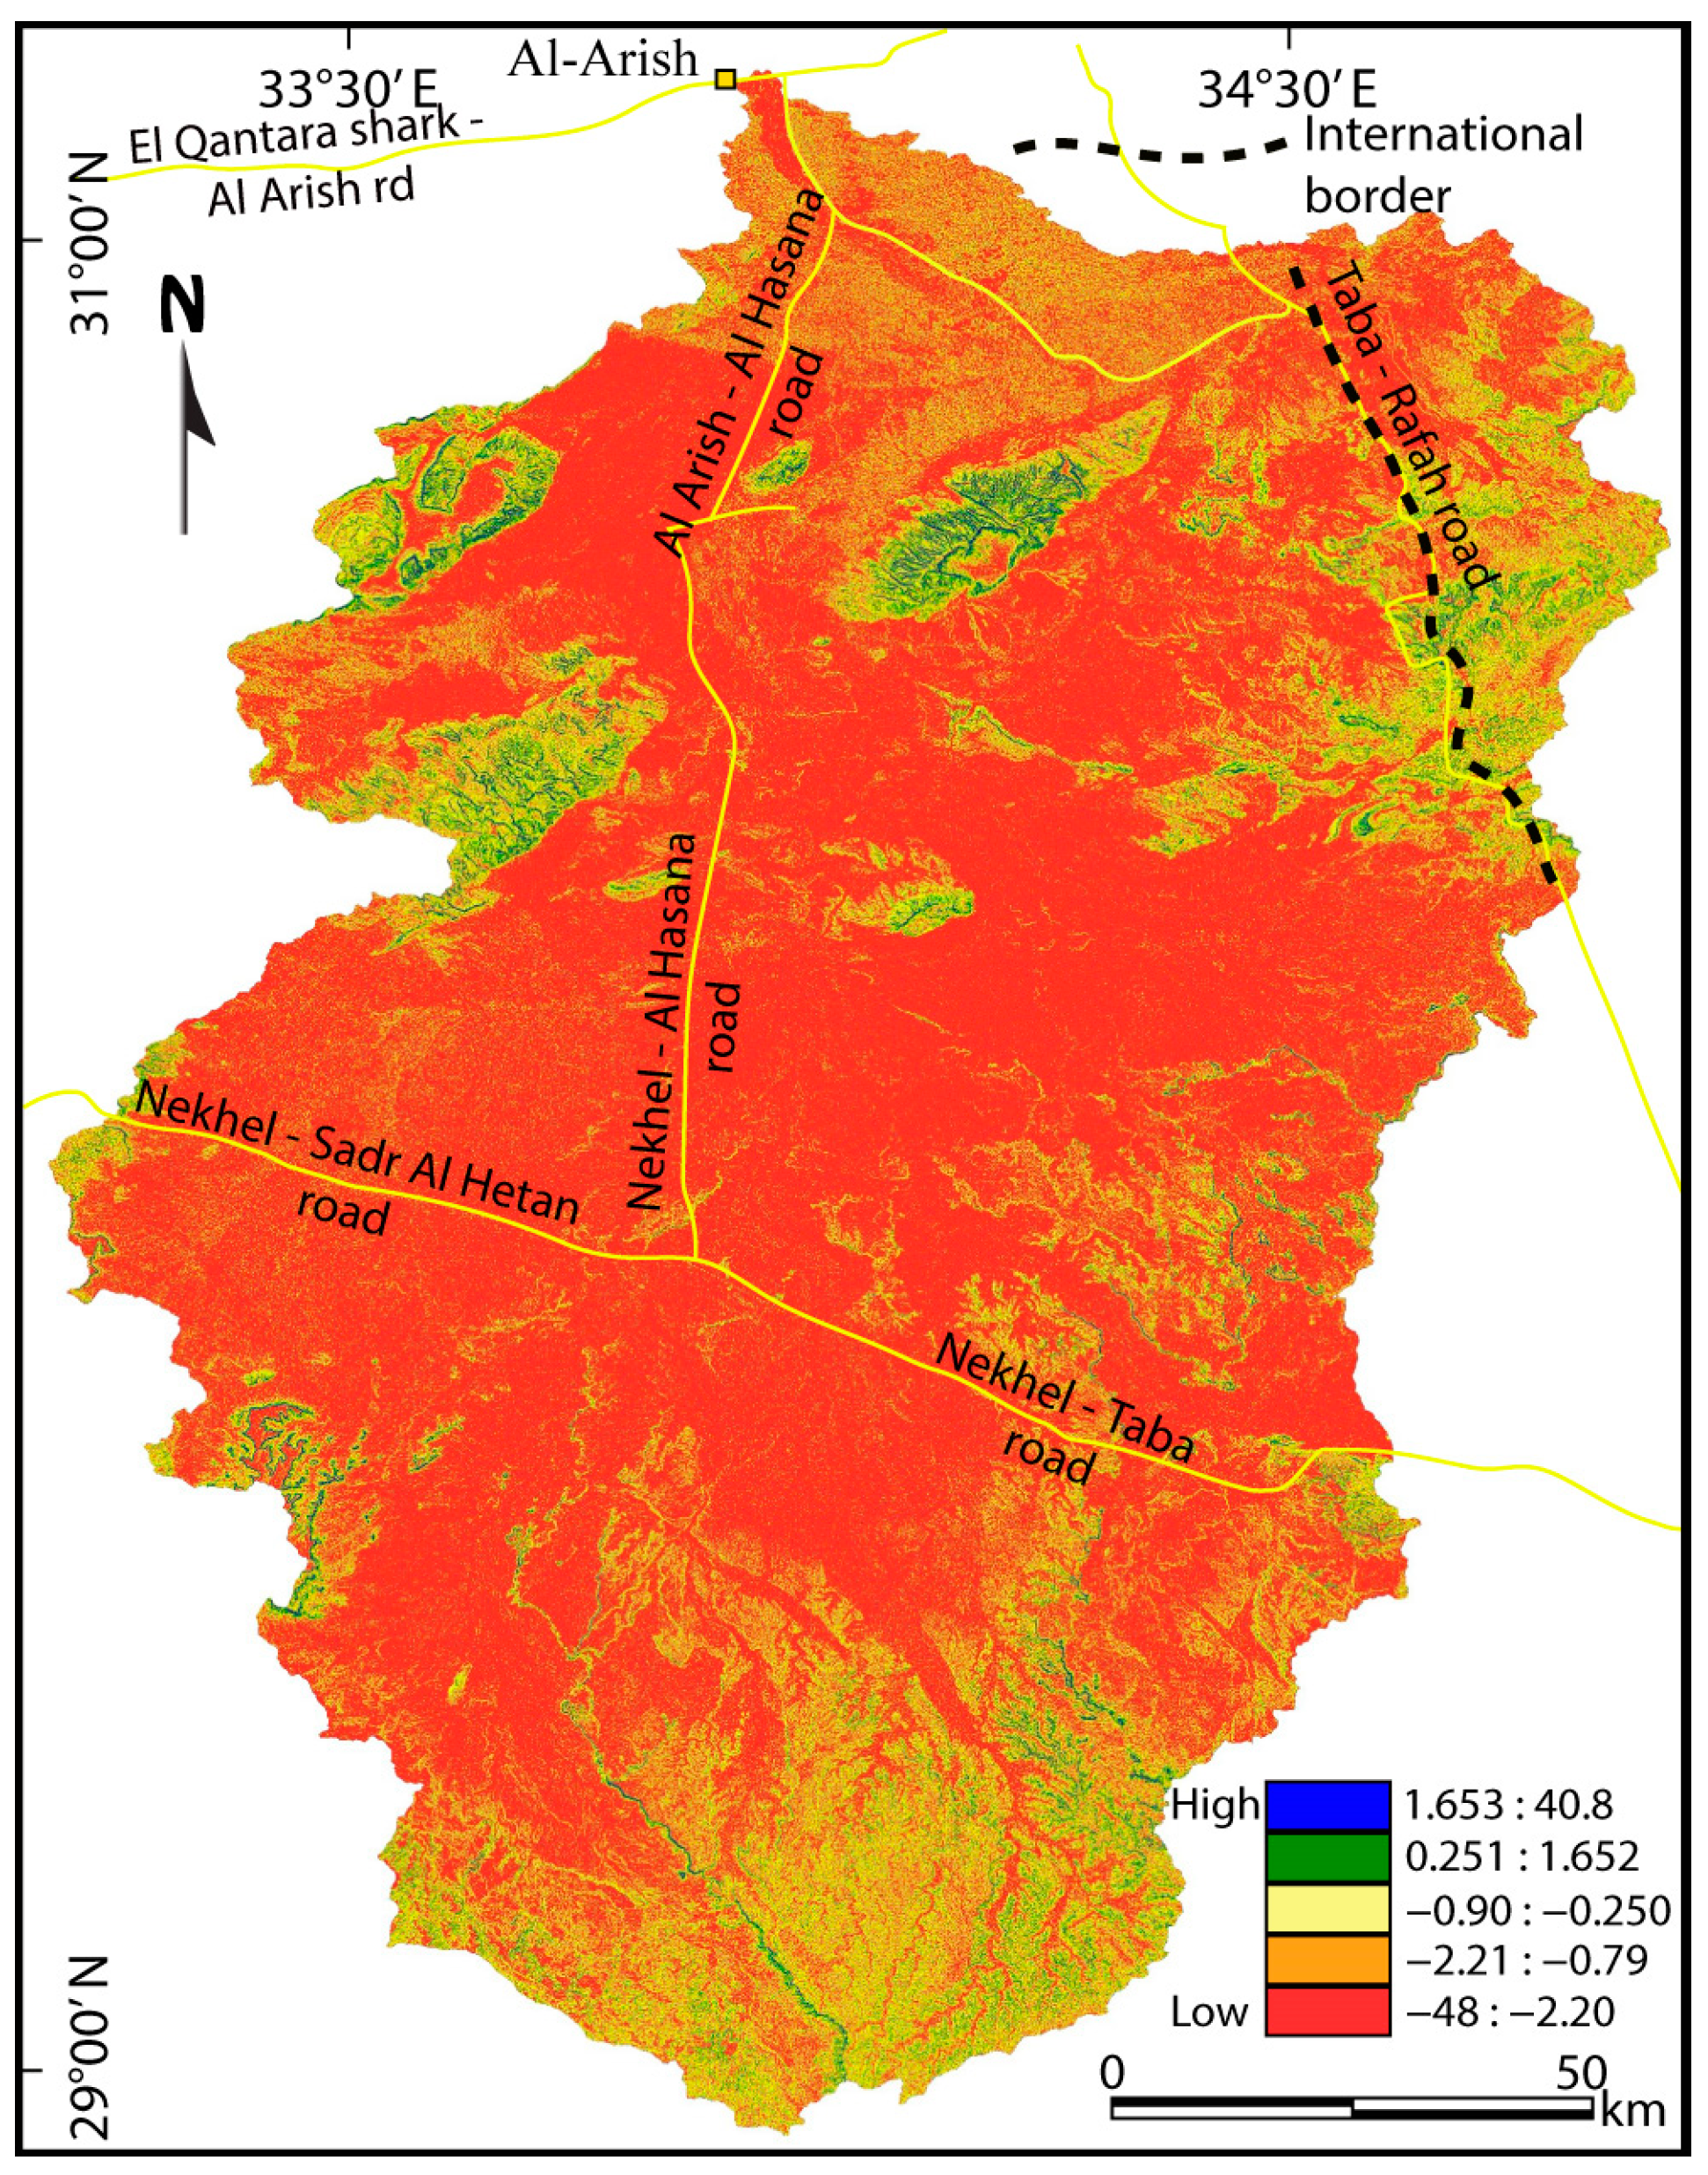
2. Study Landscape
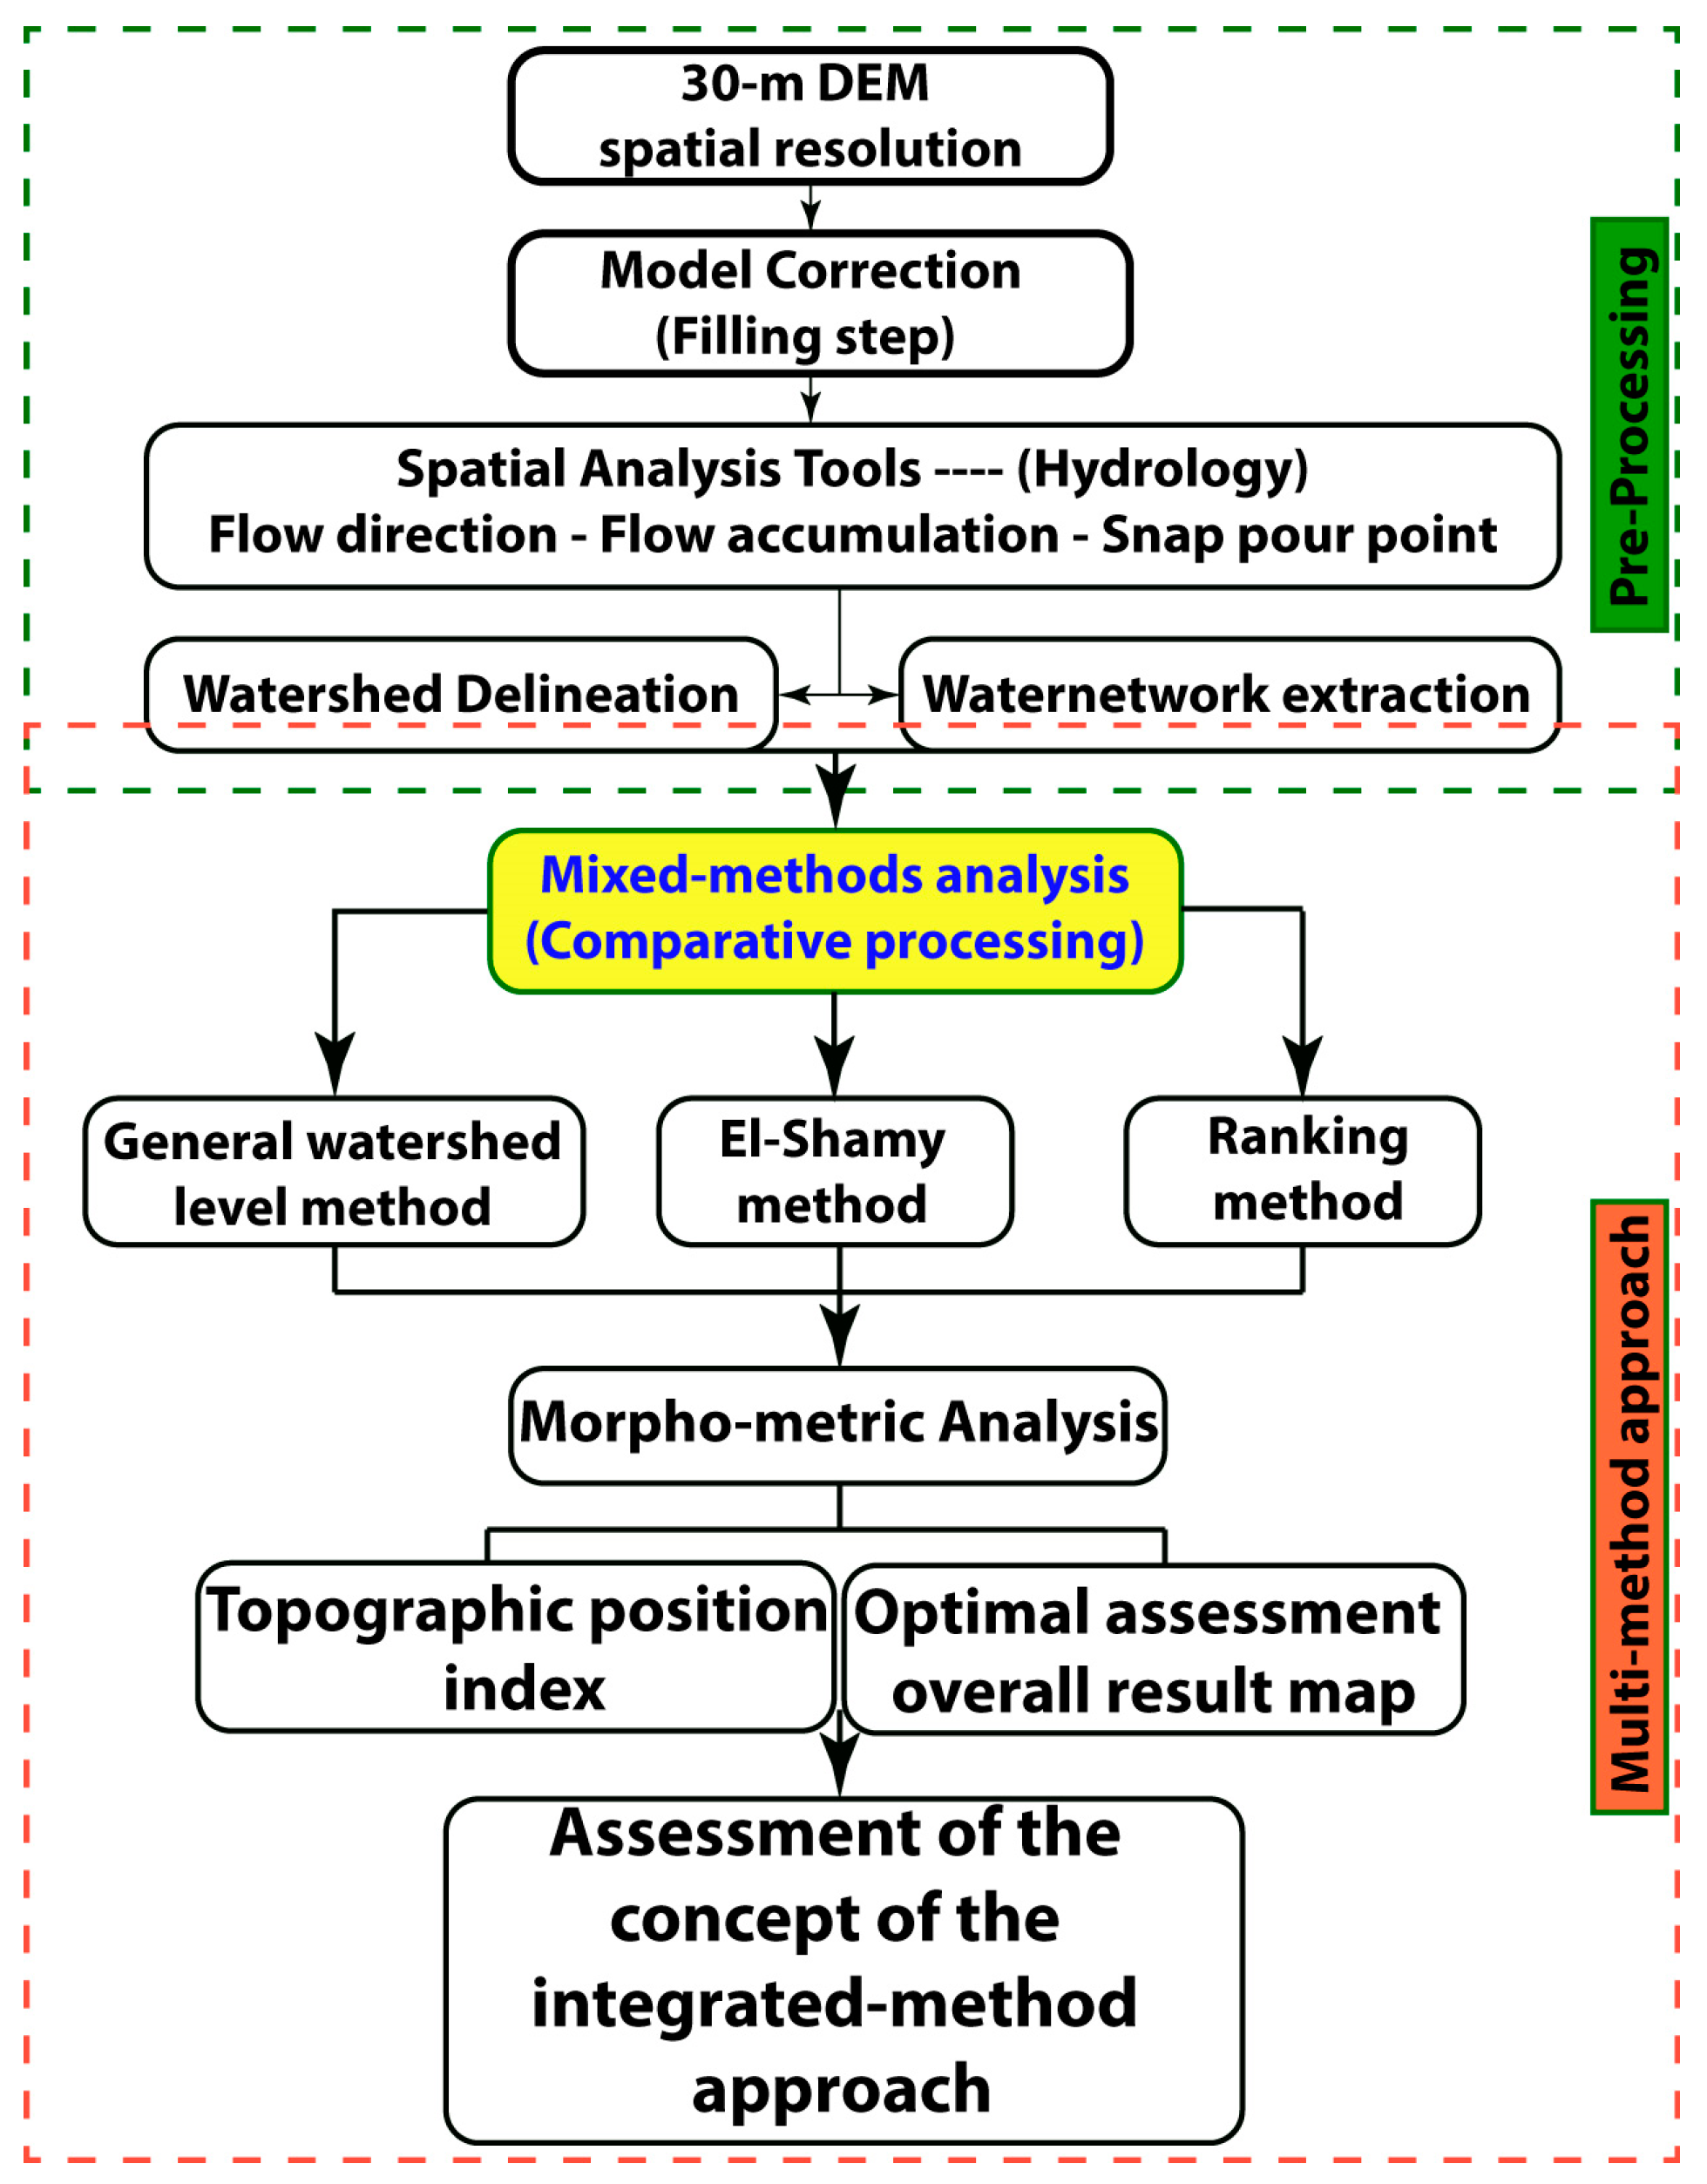
3. Materials and Methodology
3.1. Integrated Method Analysis
3.1.1. General Watershed Level Method
3.1.2. El-Shamy Method
3.1.3. Ranked Method
3.2. Morpho-Metric Analysis


| Index | Mathematical Equation | References |
|---|---|---|
| Catchment Area (A, km2) | A measures the total area from drainage divide to catchment outlet edge | [17,47] |
| Perimeter (P, km) | P measures the total catchment length | [3,47] |
| Catchment length (Lc, km) | Lc indicates the maximum length of the catchment is defined parallel to the main catchment course | [47] |
| Stream number (Nu) | Nu = N1 + N2 + N3 + N4 + ………… + Nn | [48] |
| Stream length (Lu) | Lu = L1 + L2 + L3 + L4 + …………… + Ln | [48] |
| Stream order (Su) | Hierarchical rank | [49] |
| Bifurcation ratio (Rb) | Rb = Nu/Nu + 1, where streams number values of any calculated order, and Nu + 1 represents the stream number value for the next higher order | [47] |
| Stream frequency (Fs) | Fs = Nu/A, where Nu provides the total number of all stream orders and, A measures the catchment total area | [46] |
| Form factor (F) | F = A/Lc2, where A measures the catchment total area, and Lc2 represents the squared catchment length | [43] |
| Texture ratio (Rt) | Rt = Nu/P, where Nu provides the total number of all stream orders, and P measures the exact catchment perimeter | [50] |
| Drainage density (Dd) | Dd = Lu/A, where Lu measures the catchments segments total length, and A is providing the catchment total area | [48] |
| Infiltration number (If) | If = Fs/Dd, where Fs represents the average stream frequency, and Dd presents drainage density | [51] |
| Catchment relief (Hr, m) | Hr = Hmax − Hmin, where Hmax and Hmin indicate the highest and lowest elevation points of the given catchment, respectively | [47] |
| Ruggedness number (Rn) | Rn = Dd × (Hr/1000), where Dd indicates the drainage density, and Hr presents the catchment topography | [52] |
| Elevation–relief ratio (Rr) | Rr = Hr/L, where Hr measures the catchment topography, and Lc provides the catchment total length | [48] |
| Topographic position Index (TPI) | TPI = M0 − , where M0 provides elevation of the model point under evaluation, Mn measures the elevation of the grid, and n measures the total number of surrounding points applied in the evaluation processes | [53] |
4. Results and Discussion
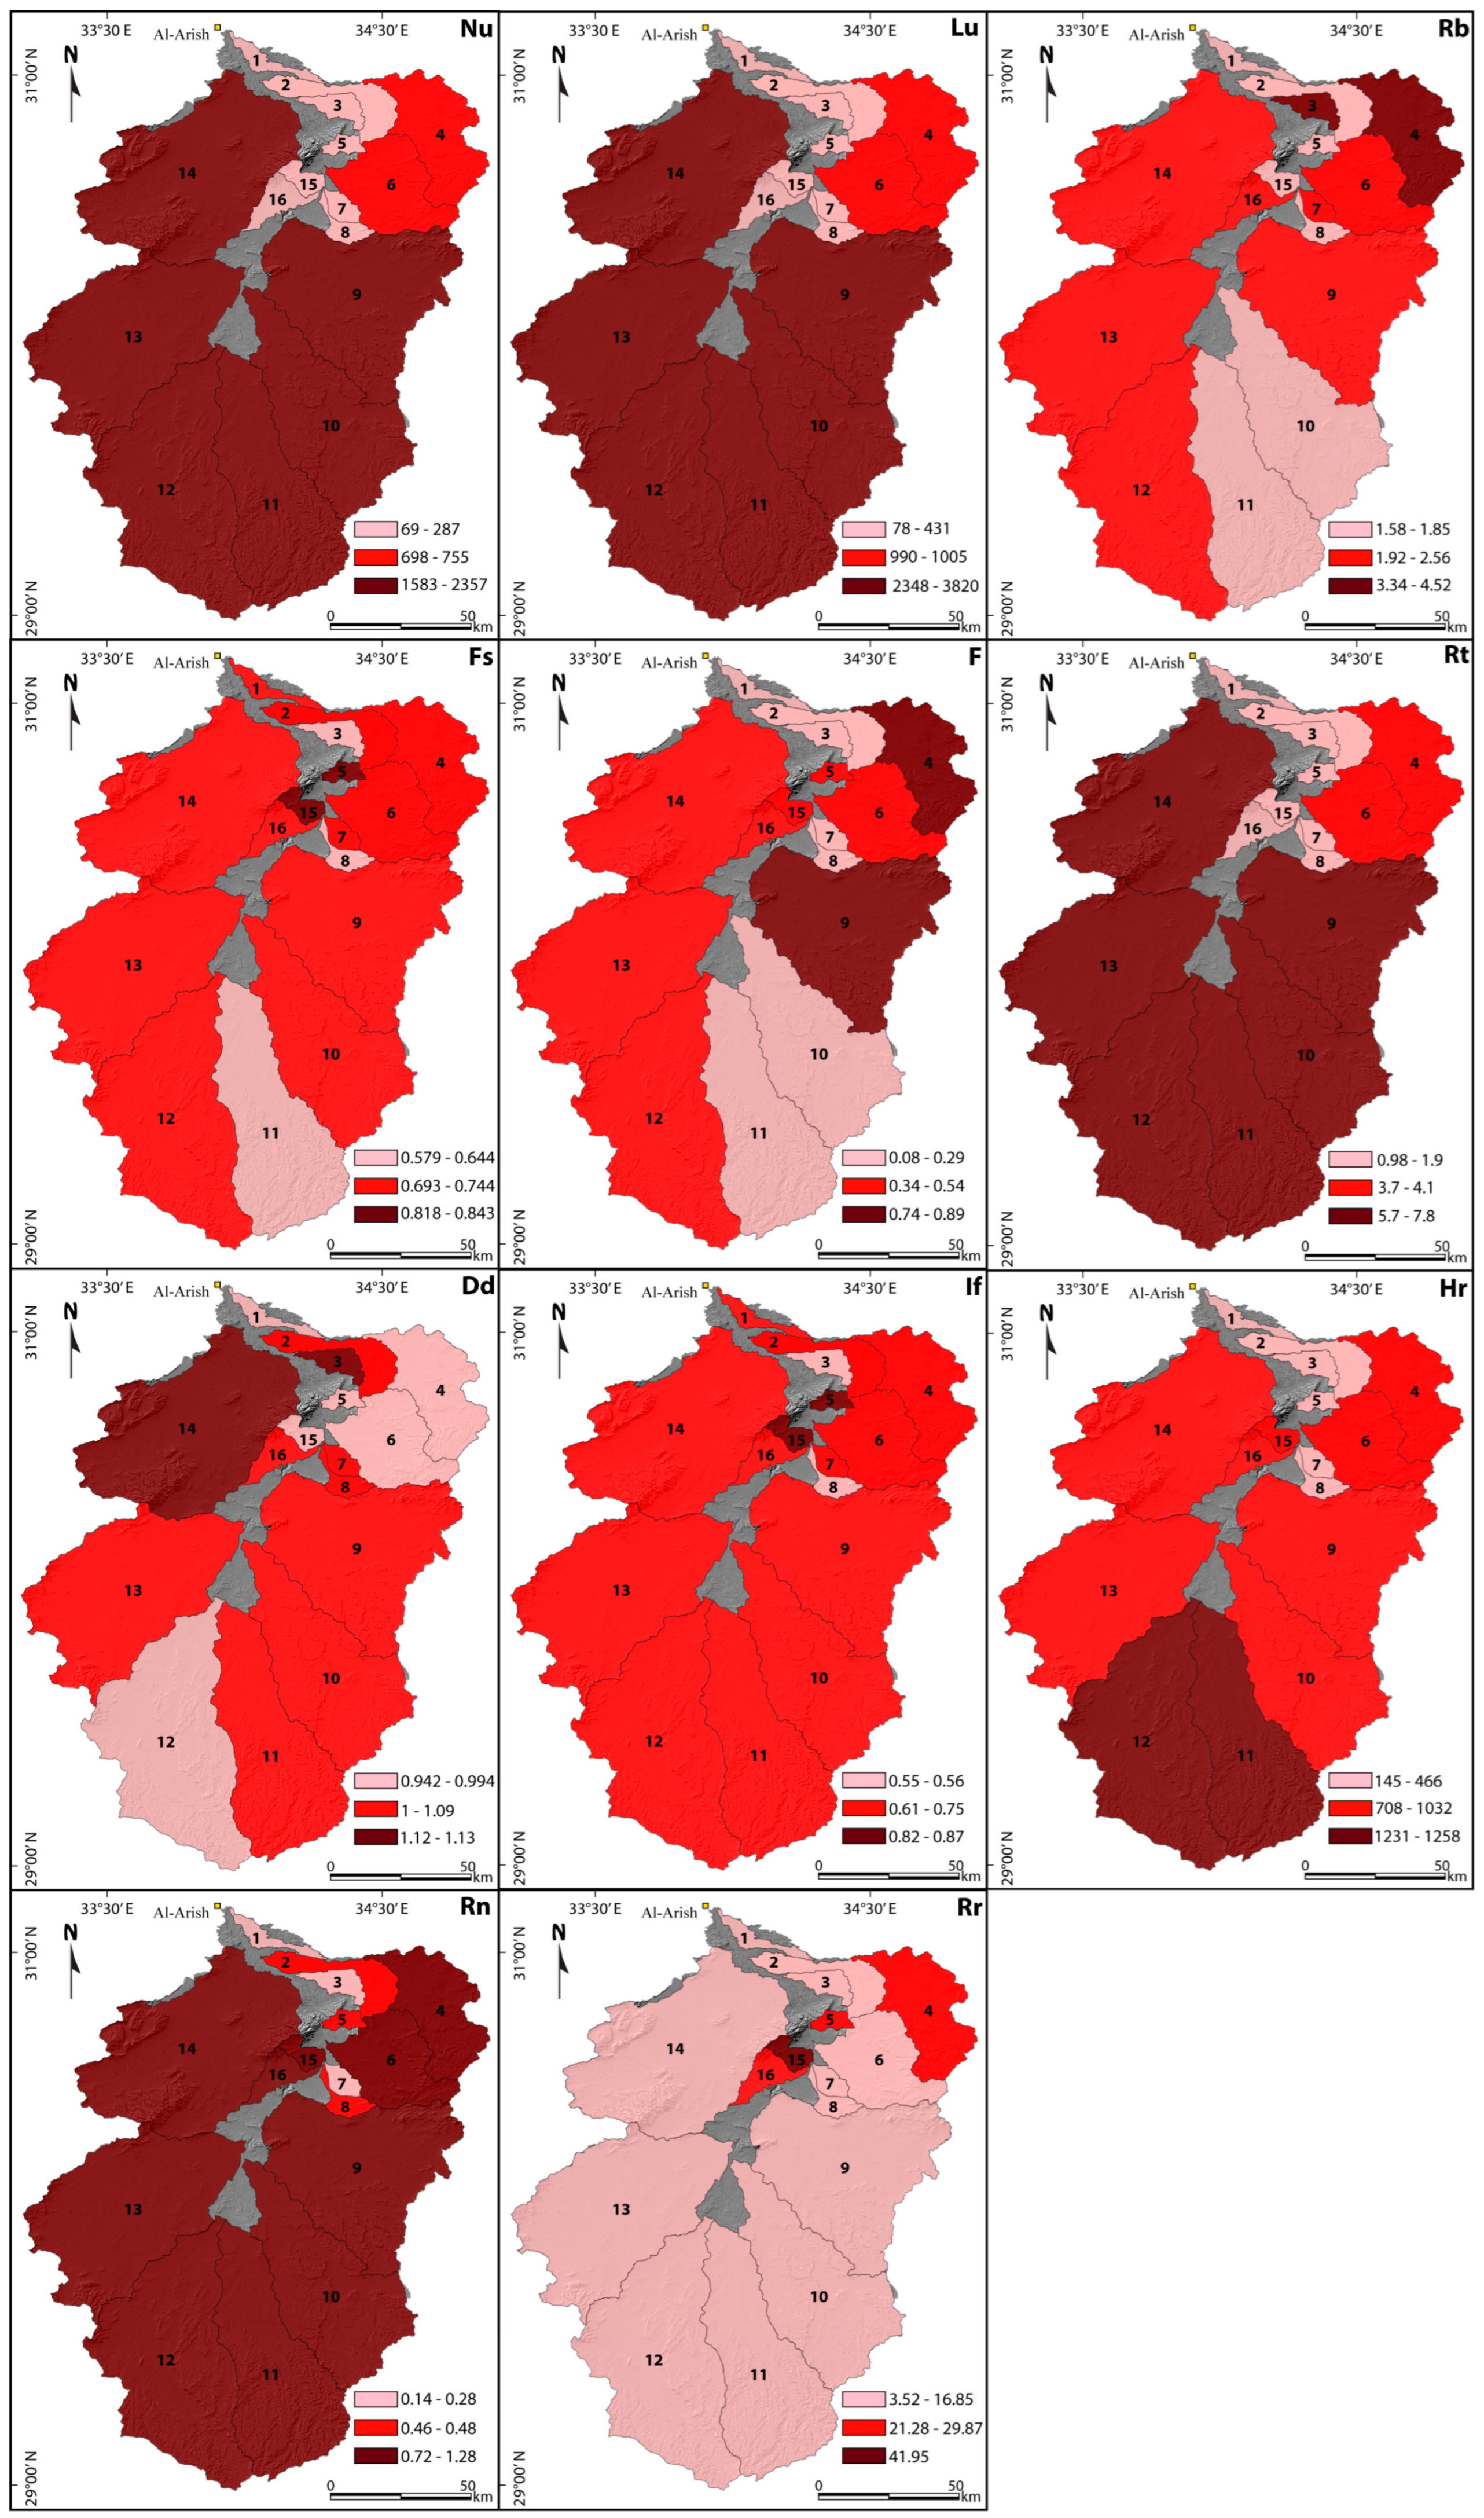
4.1. Morpho-Metric Analysis
4.1.1. Stream Number Index (Nu)
4.1.2. Stream Order Index (Su)
4.1.3. Stream Length Index (Lu)
4.1.4. Bifurcation Ratio Index (Rb)
4.1.5. Stream Frequency Index (Fs)
4.1.6. Form Factor Index (F)
4.1.7. Texture Ratio Index (Rt)
4.1.8. Drainage Density Index (Dd)
4.1.9. Infiltration Number Index (If)
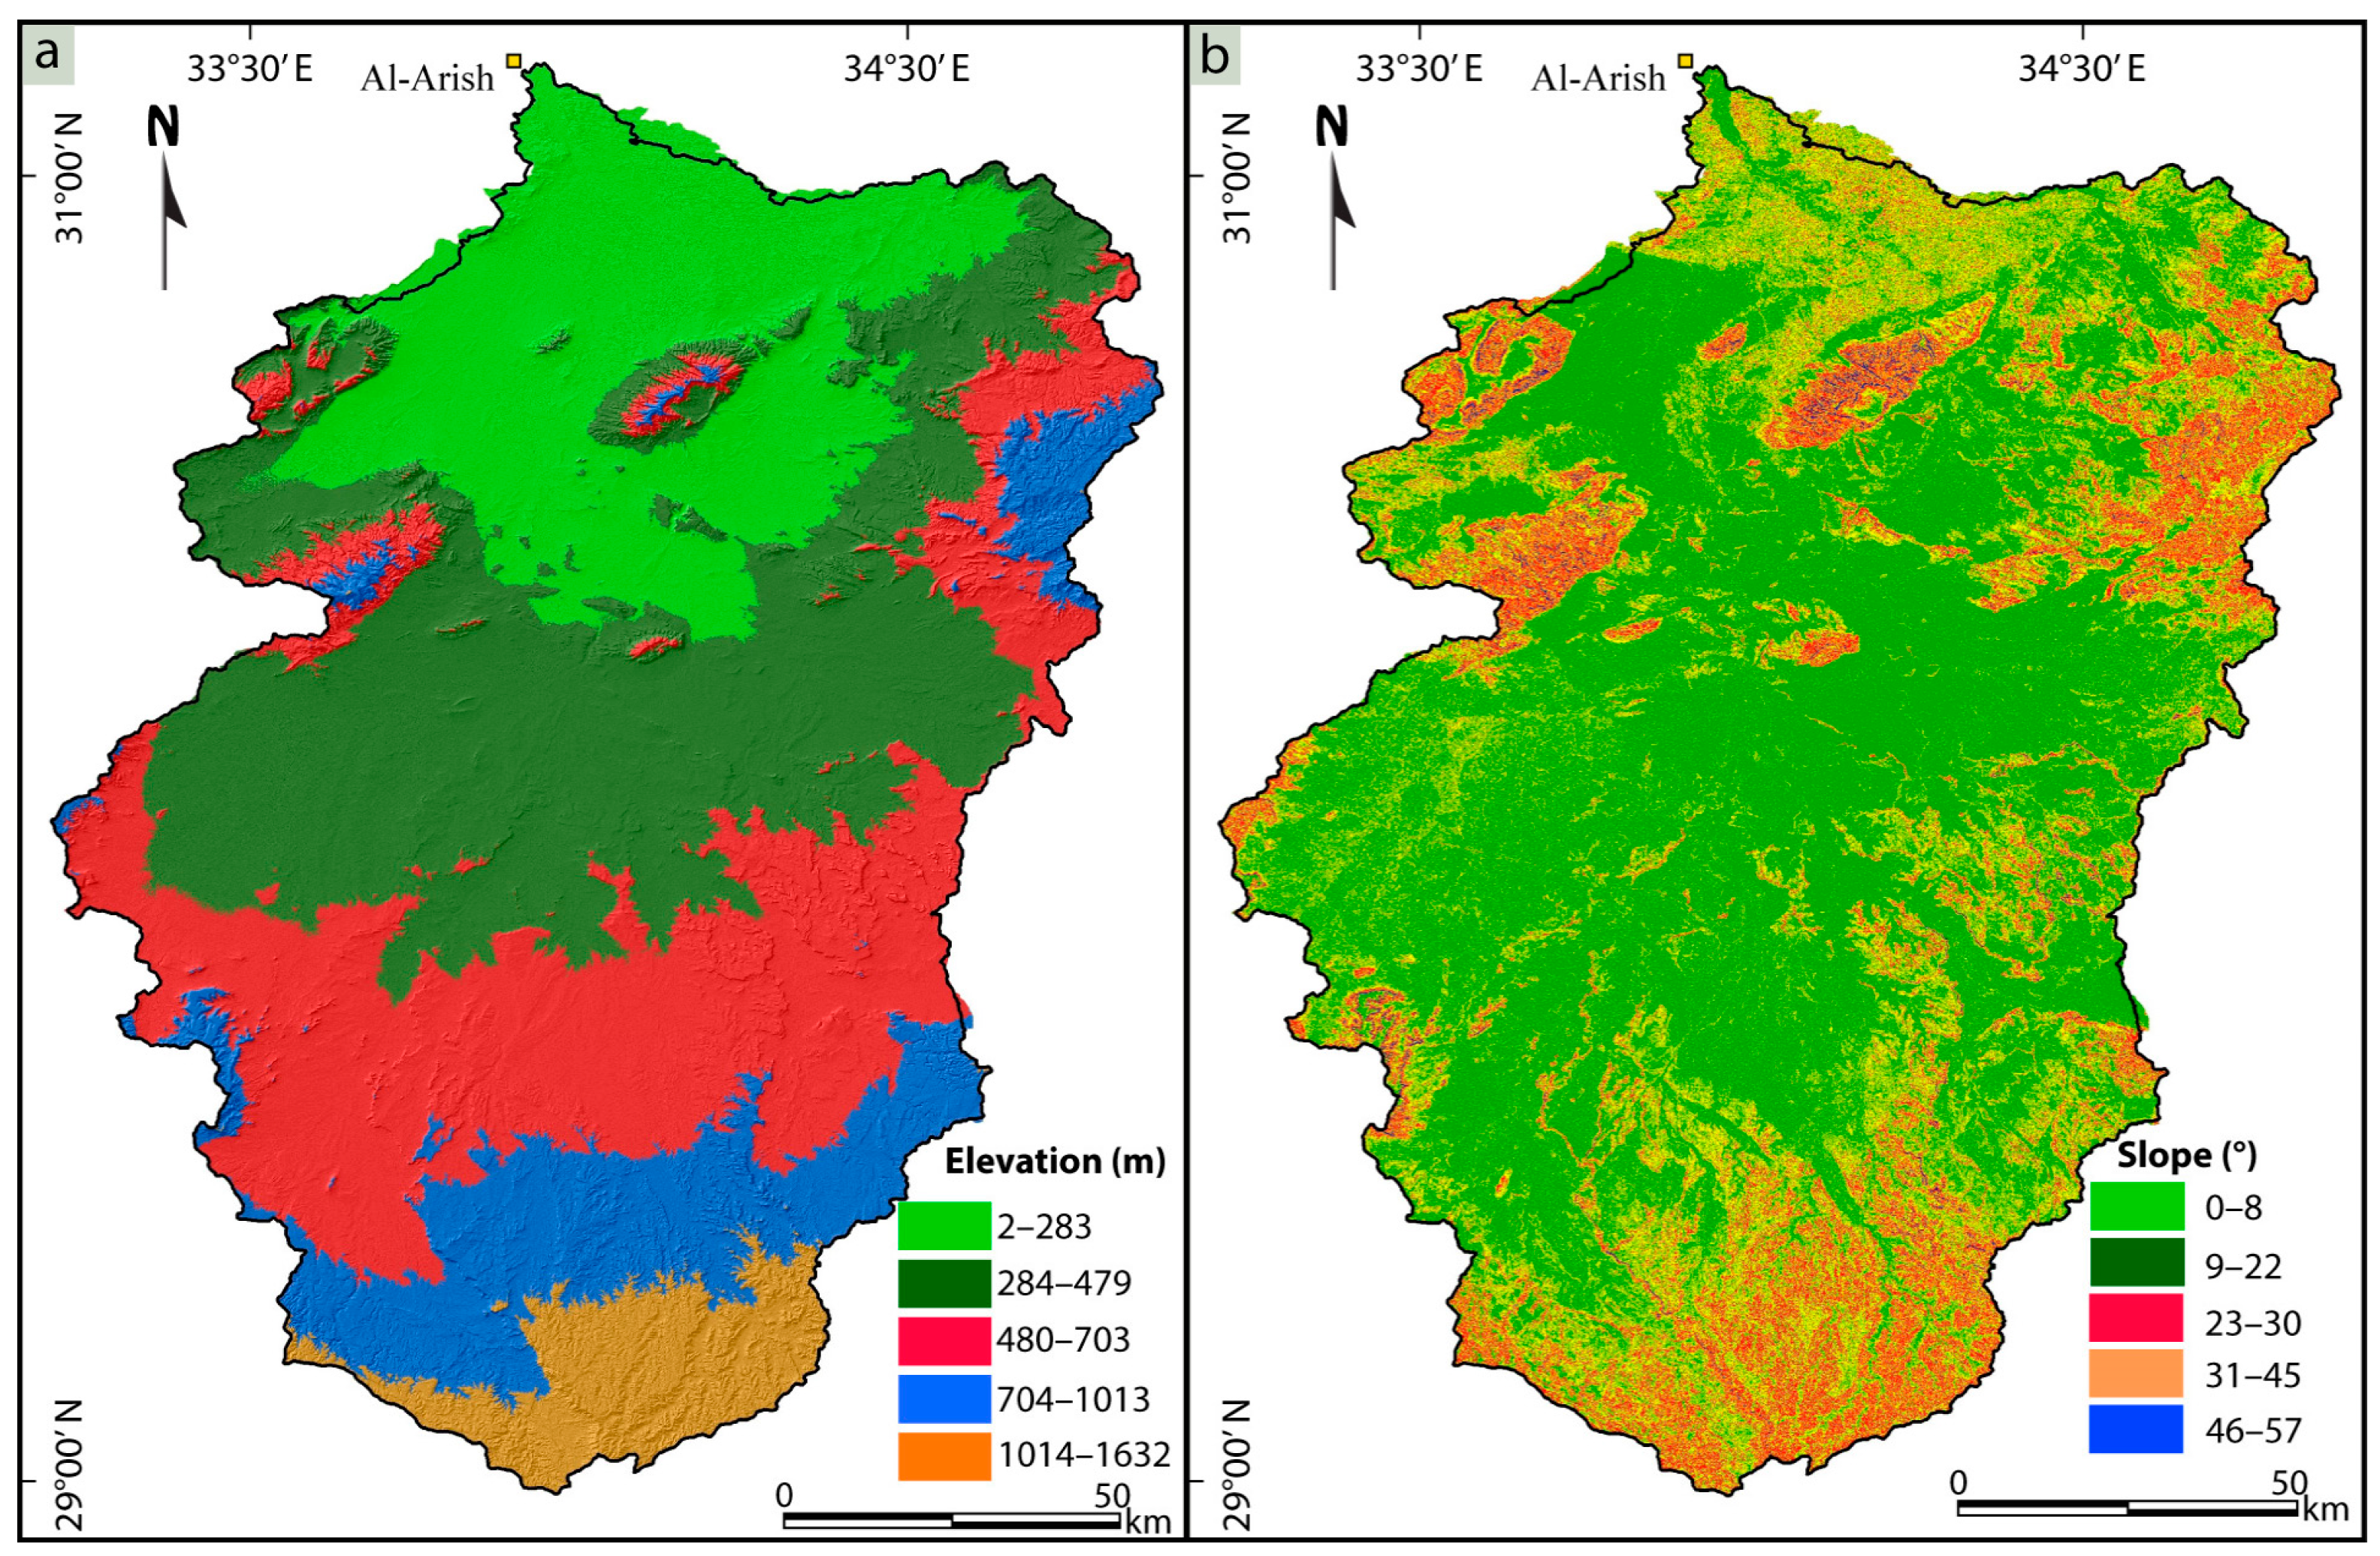
4.1.10. Catchment Relief Index (Hr)
4.1.11. Ruggedness Number Index (Rn)
4.1.12. Elevation–Relief Ratio Index (Rr)
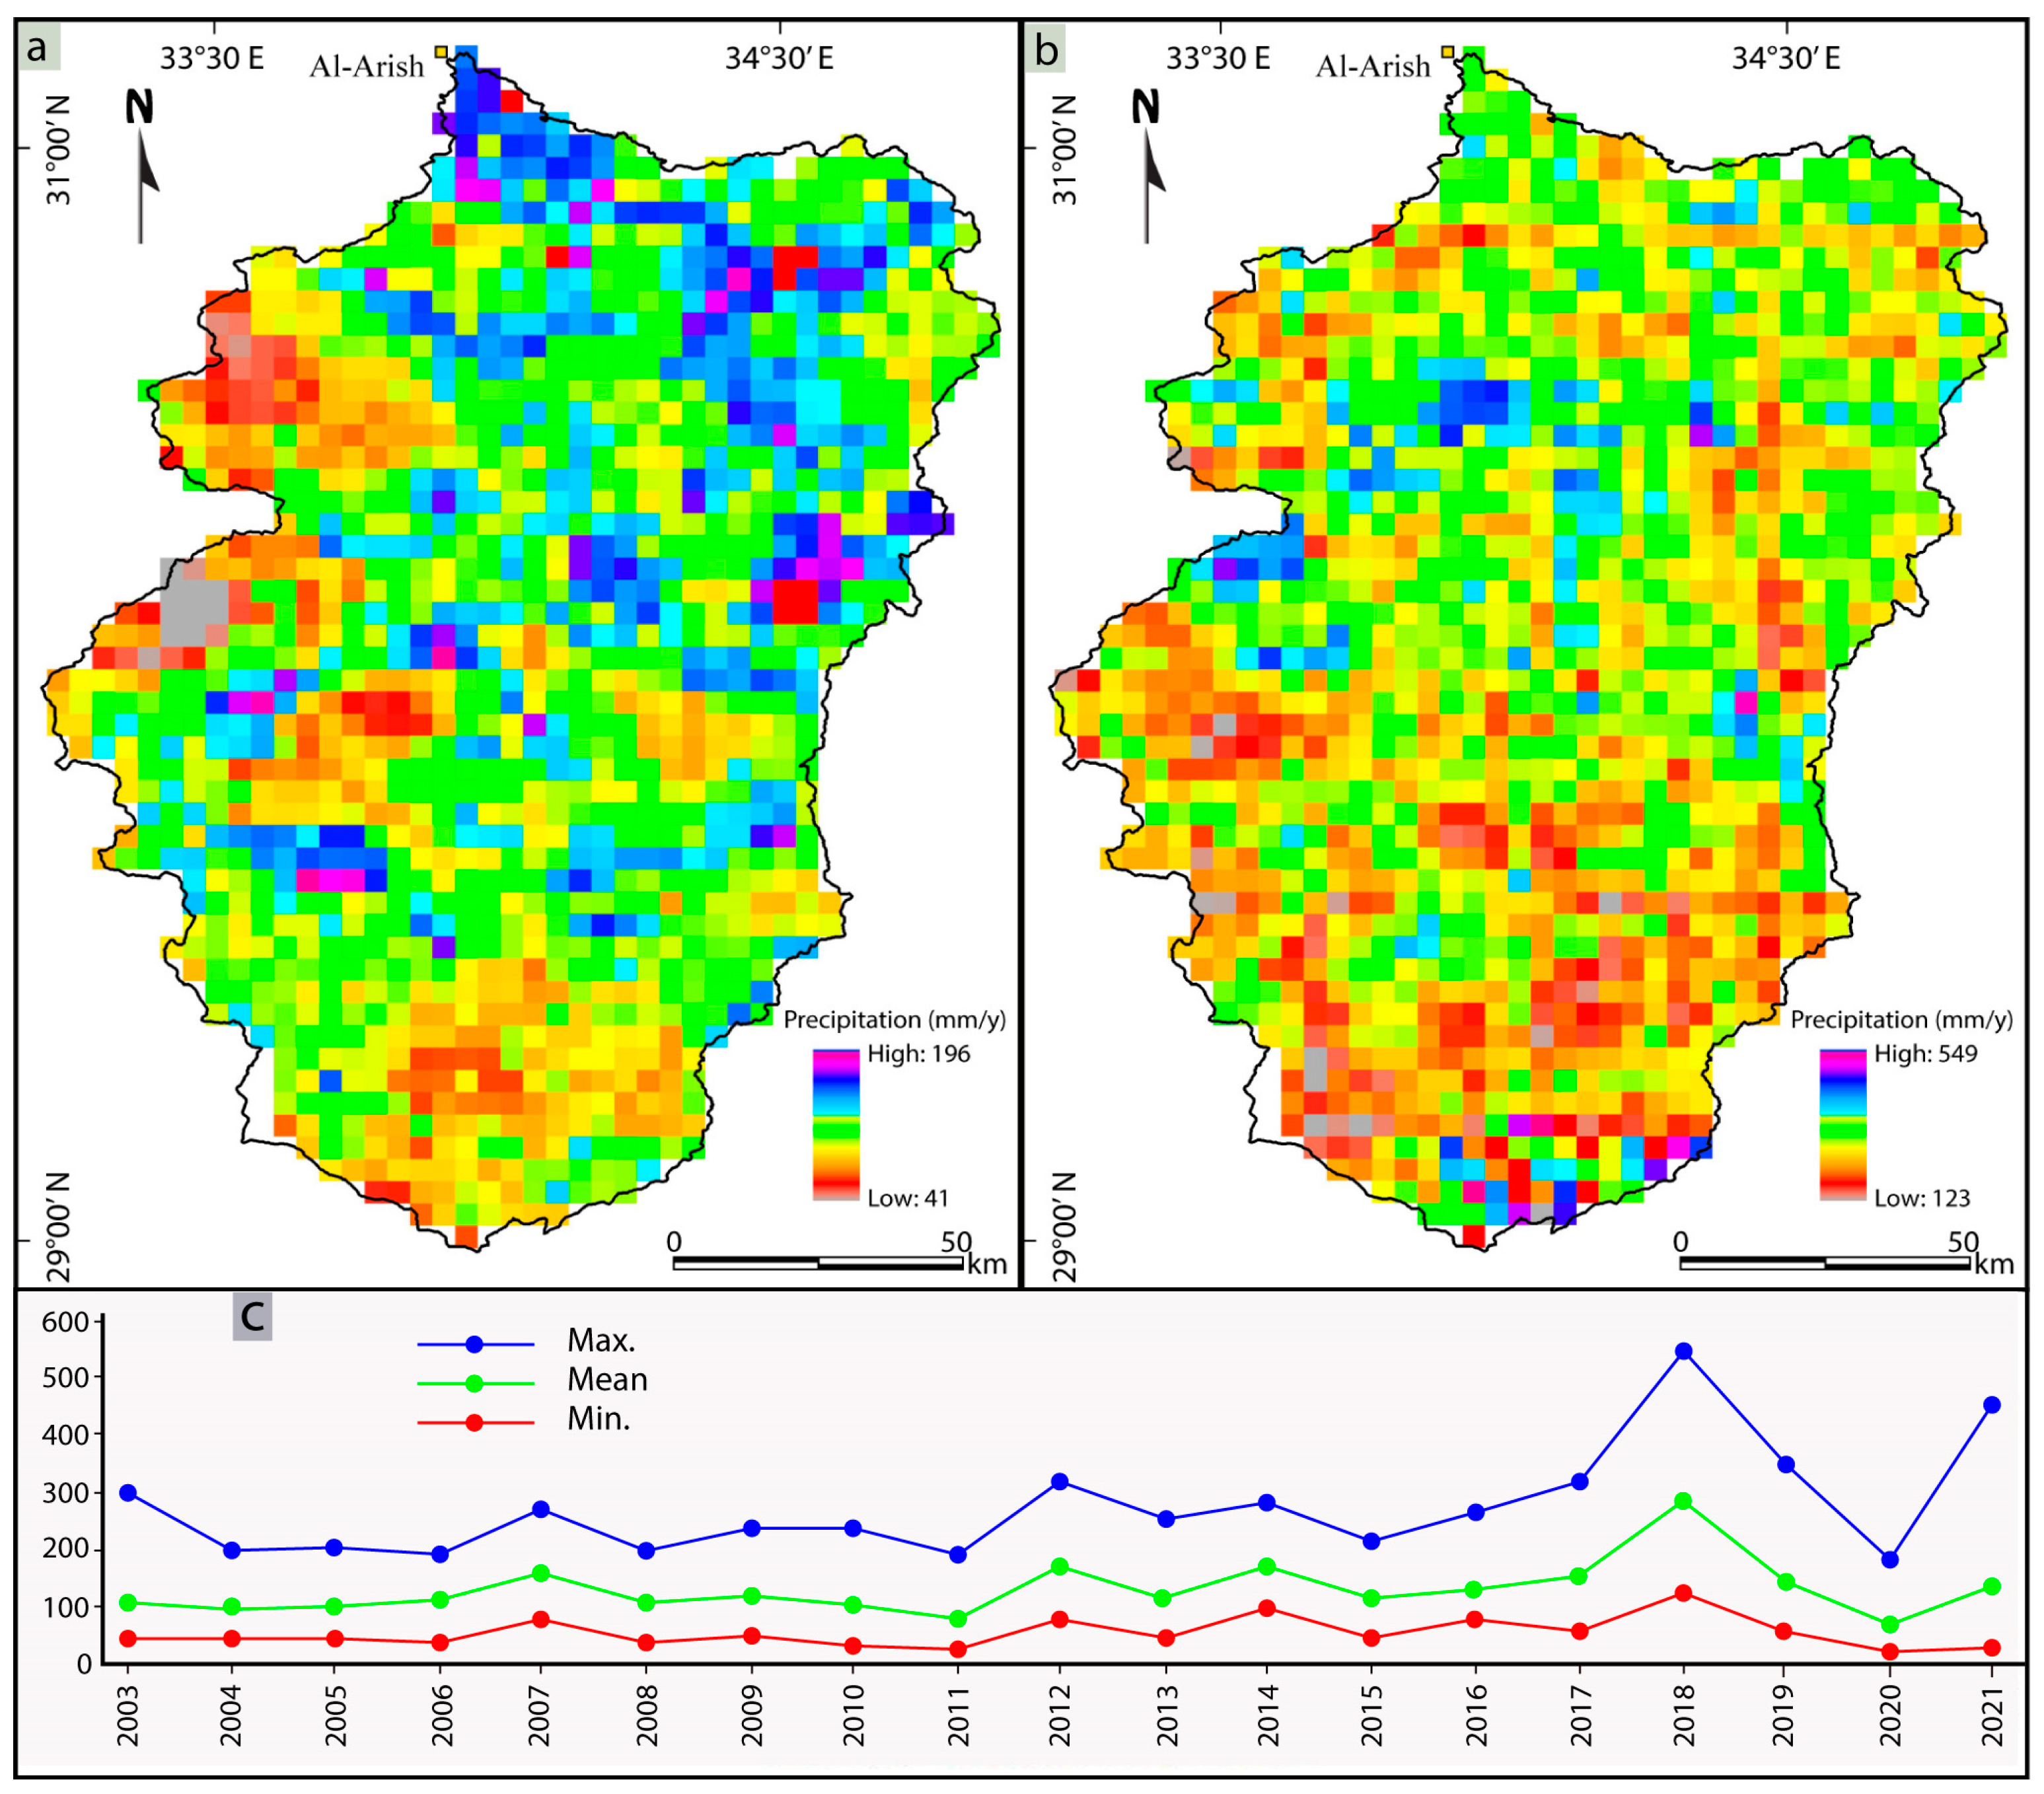
4.2. Climatic Changes in Sinai Peninsula
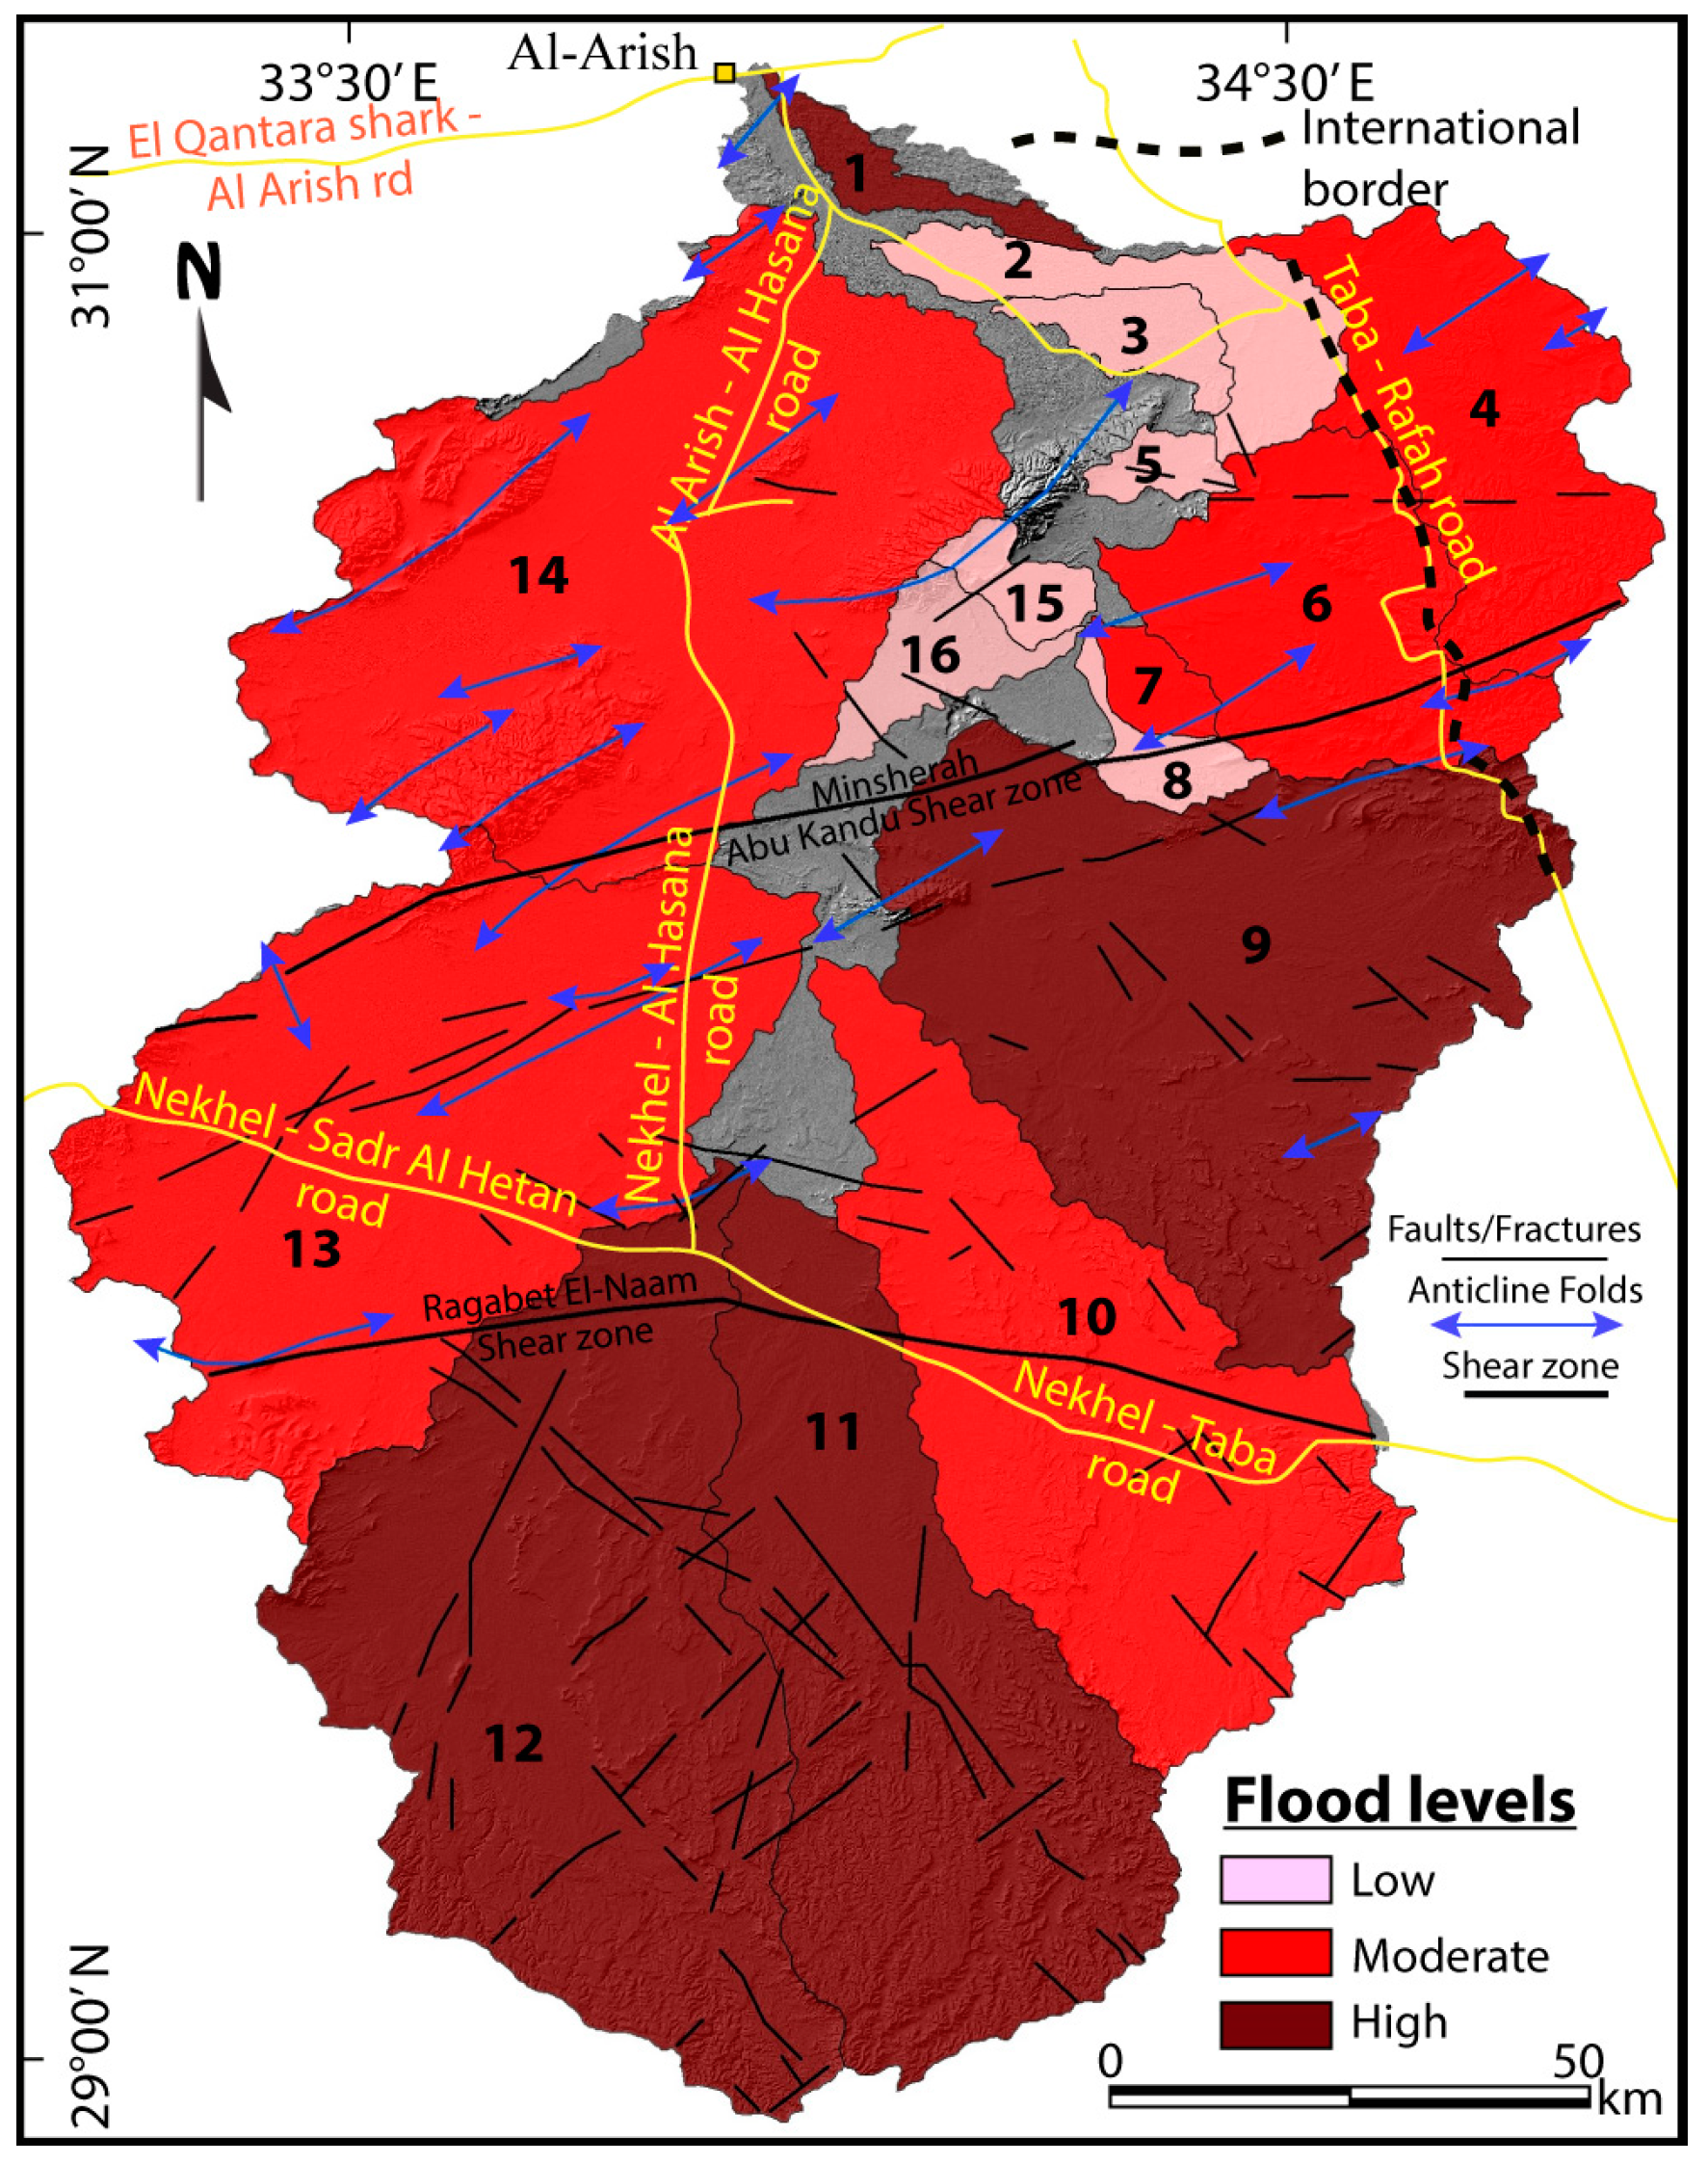
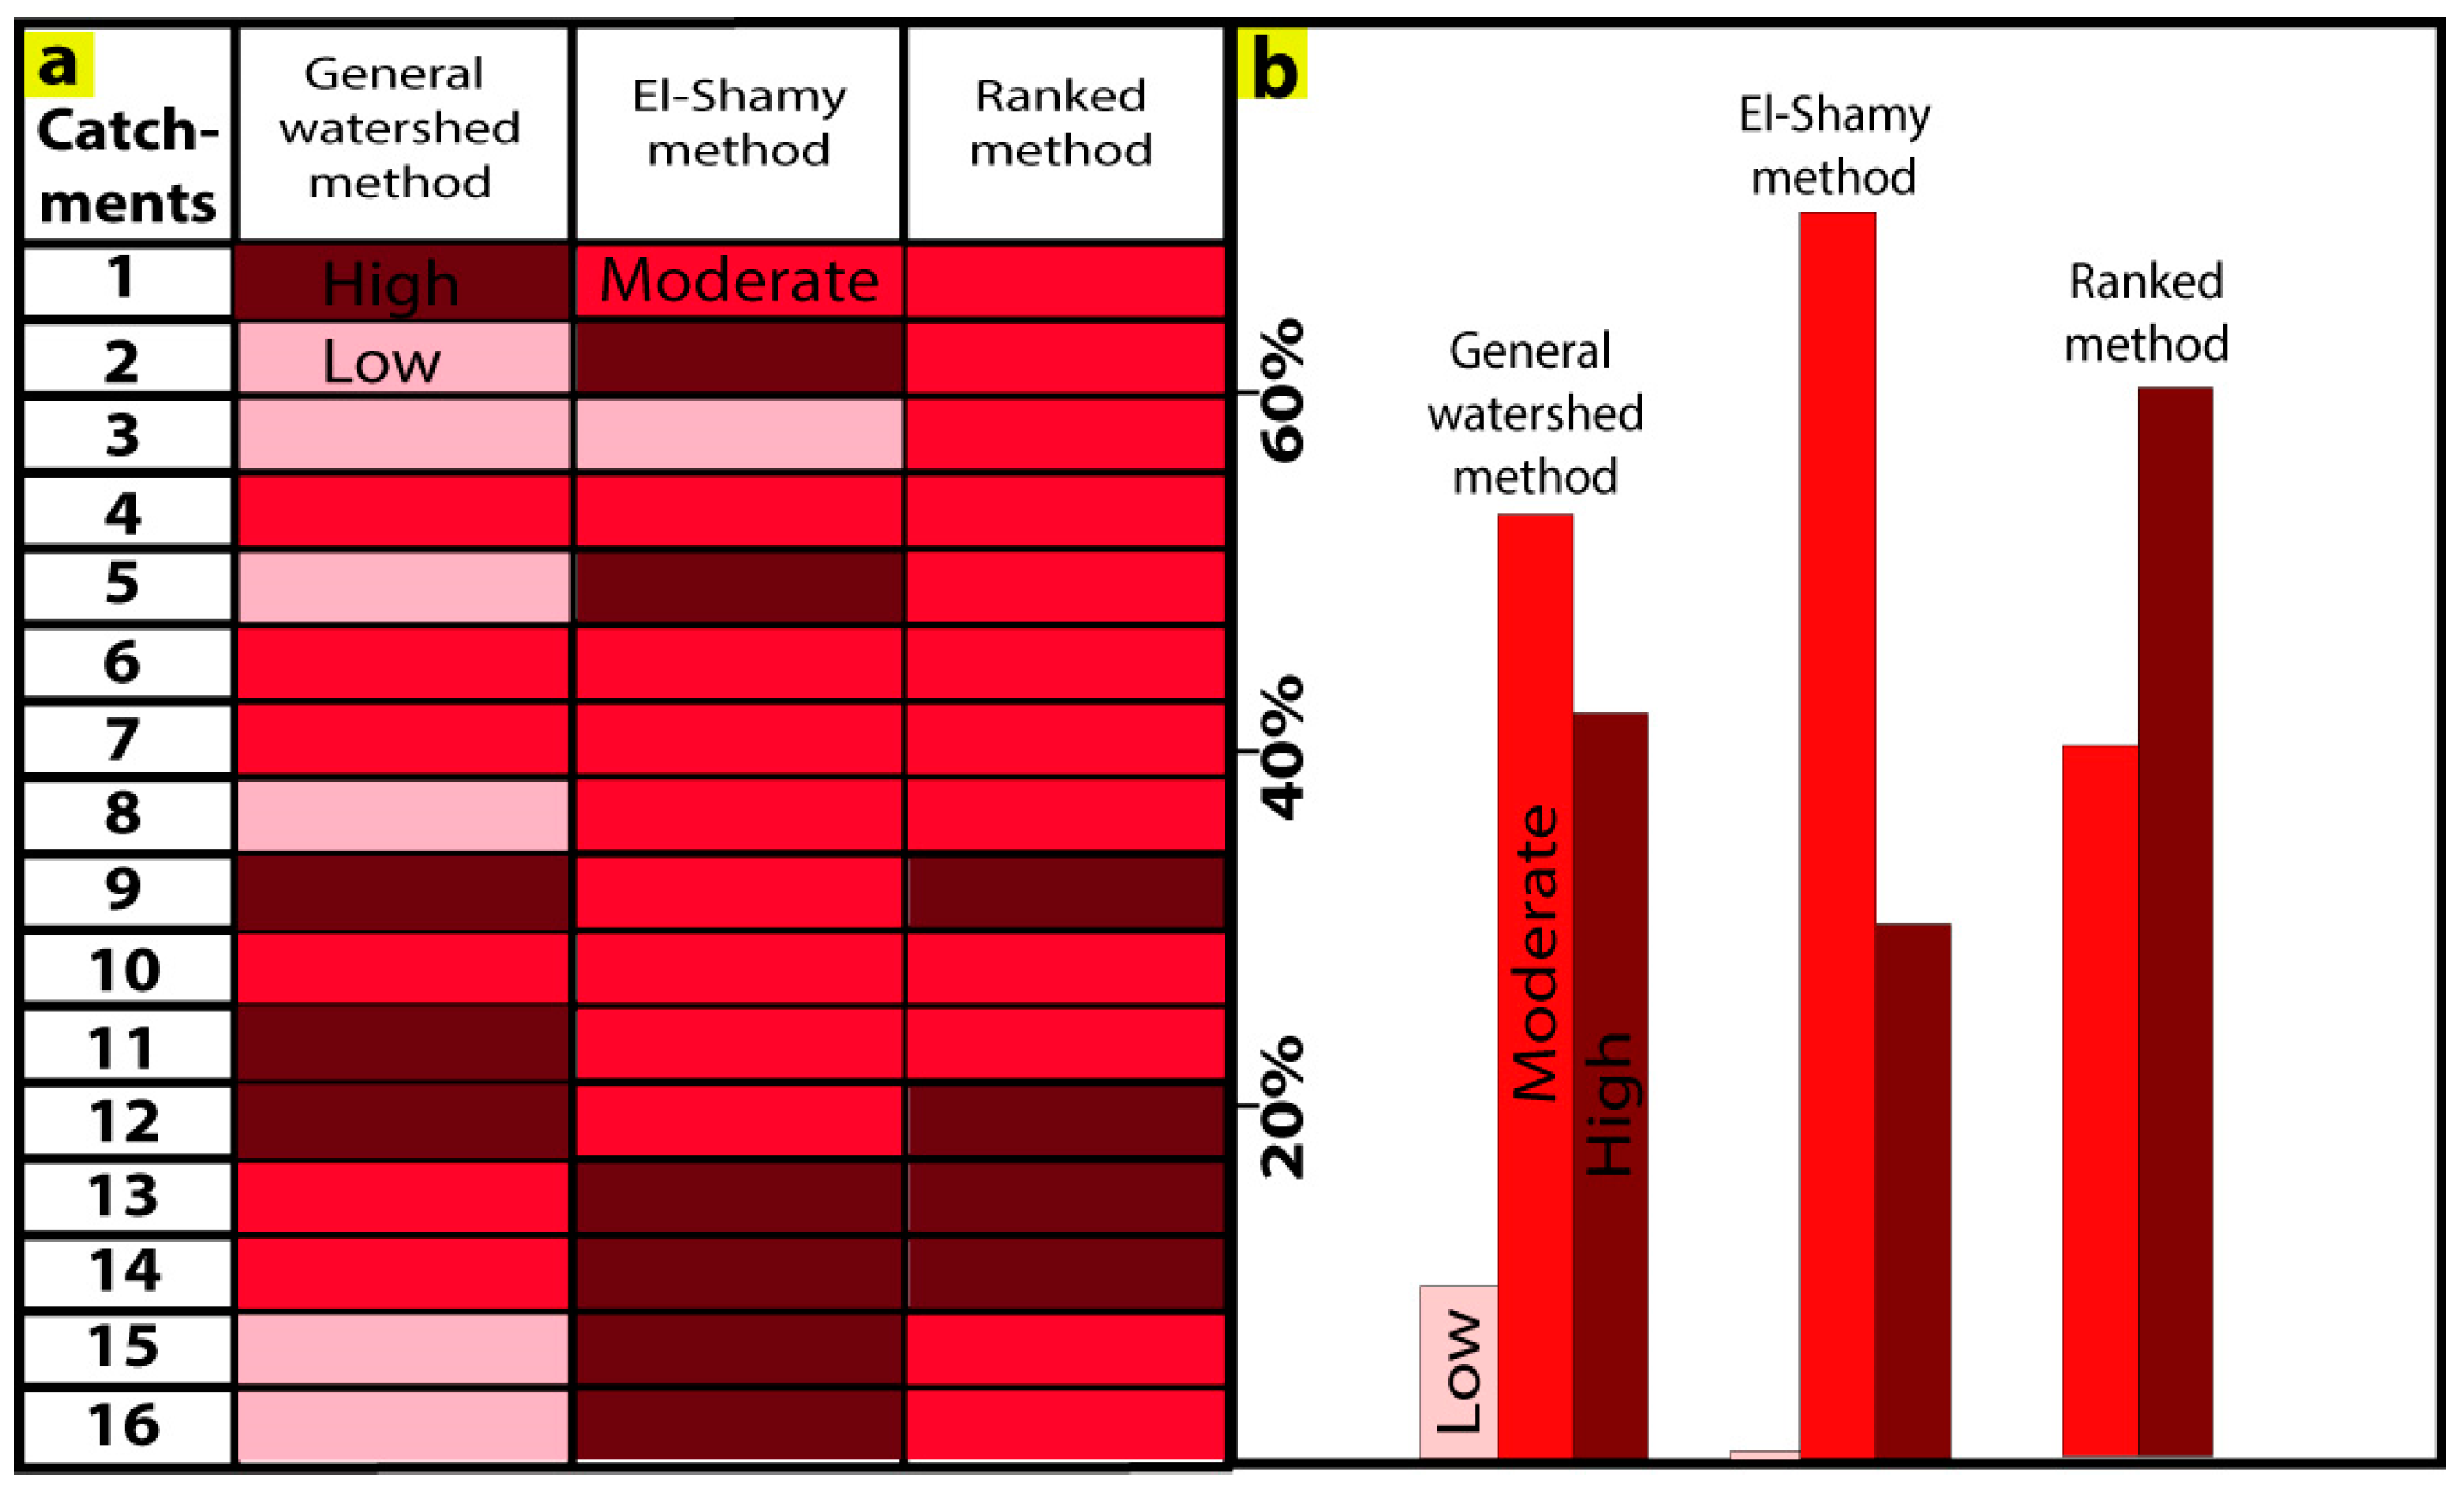
4.3. Flash Flood Evaluation Based on the General Watershed Level Method
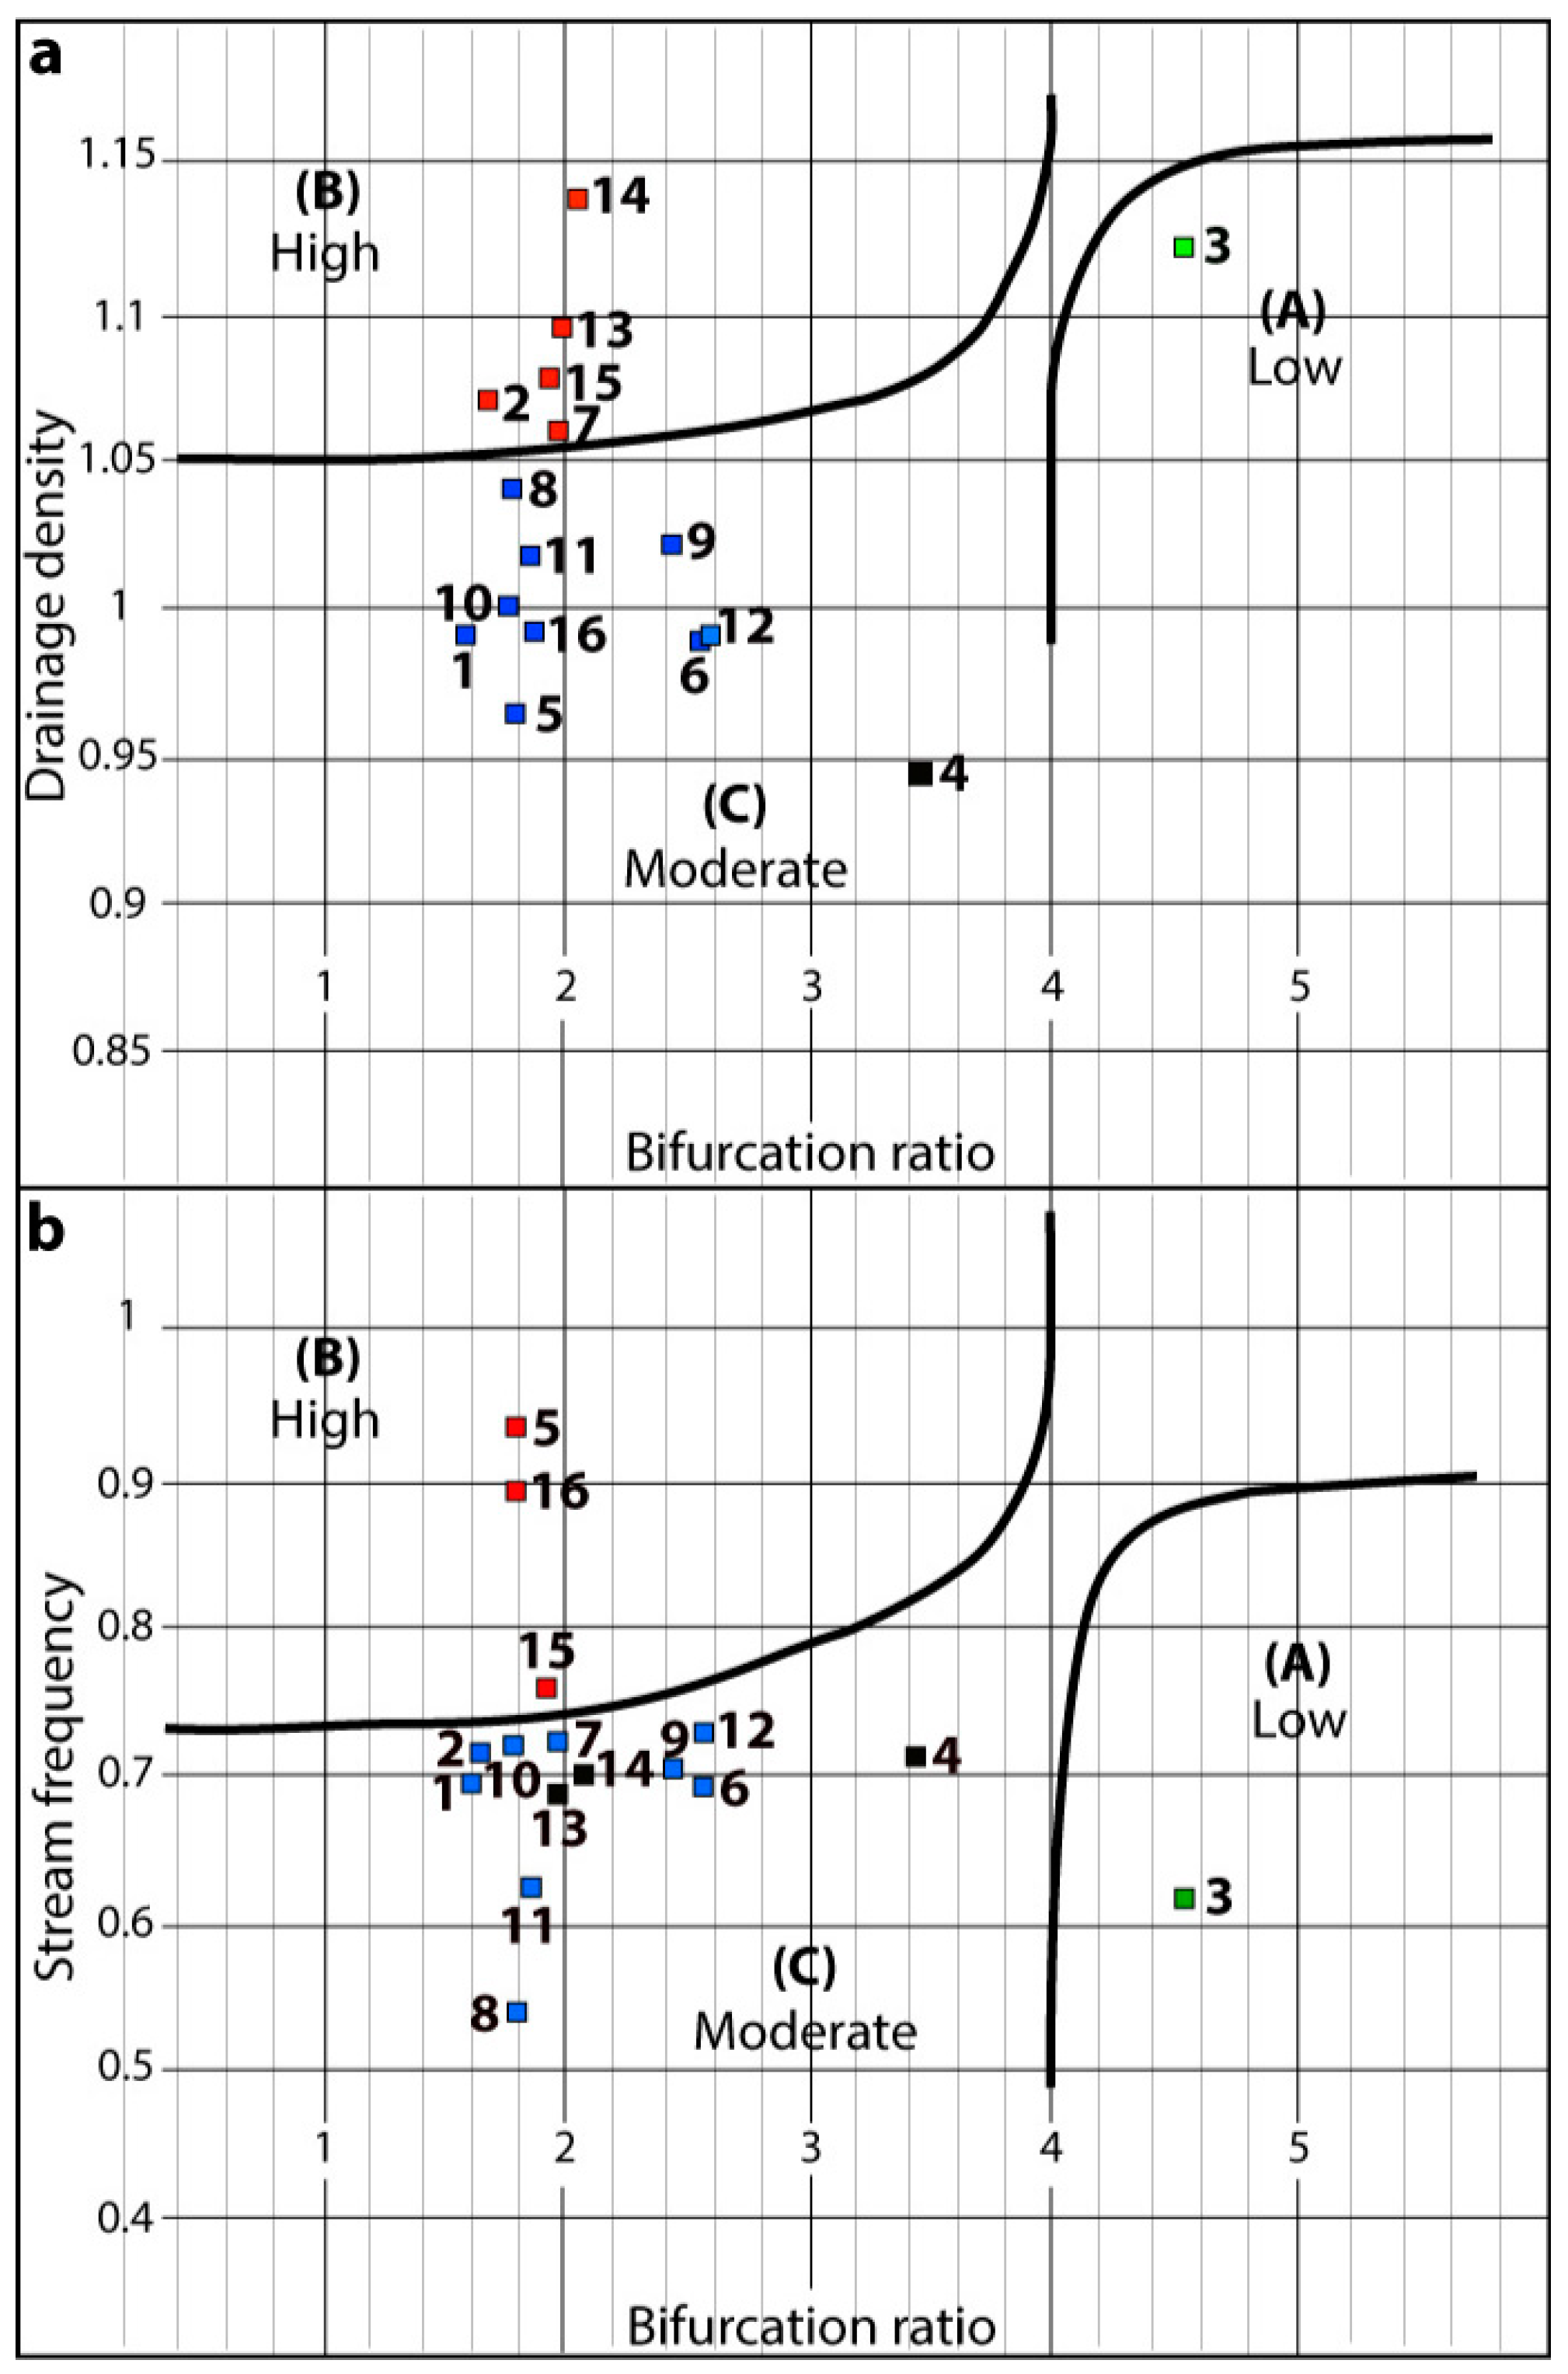
4.4. Flash Flood Evaluation Based on El-Shamy Method
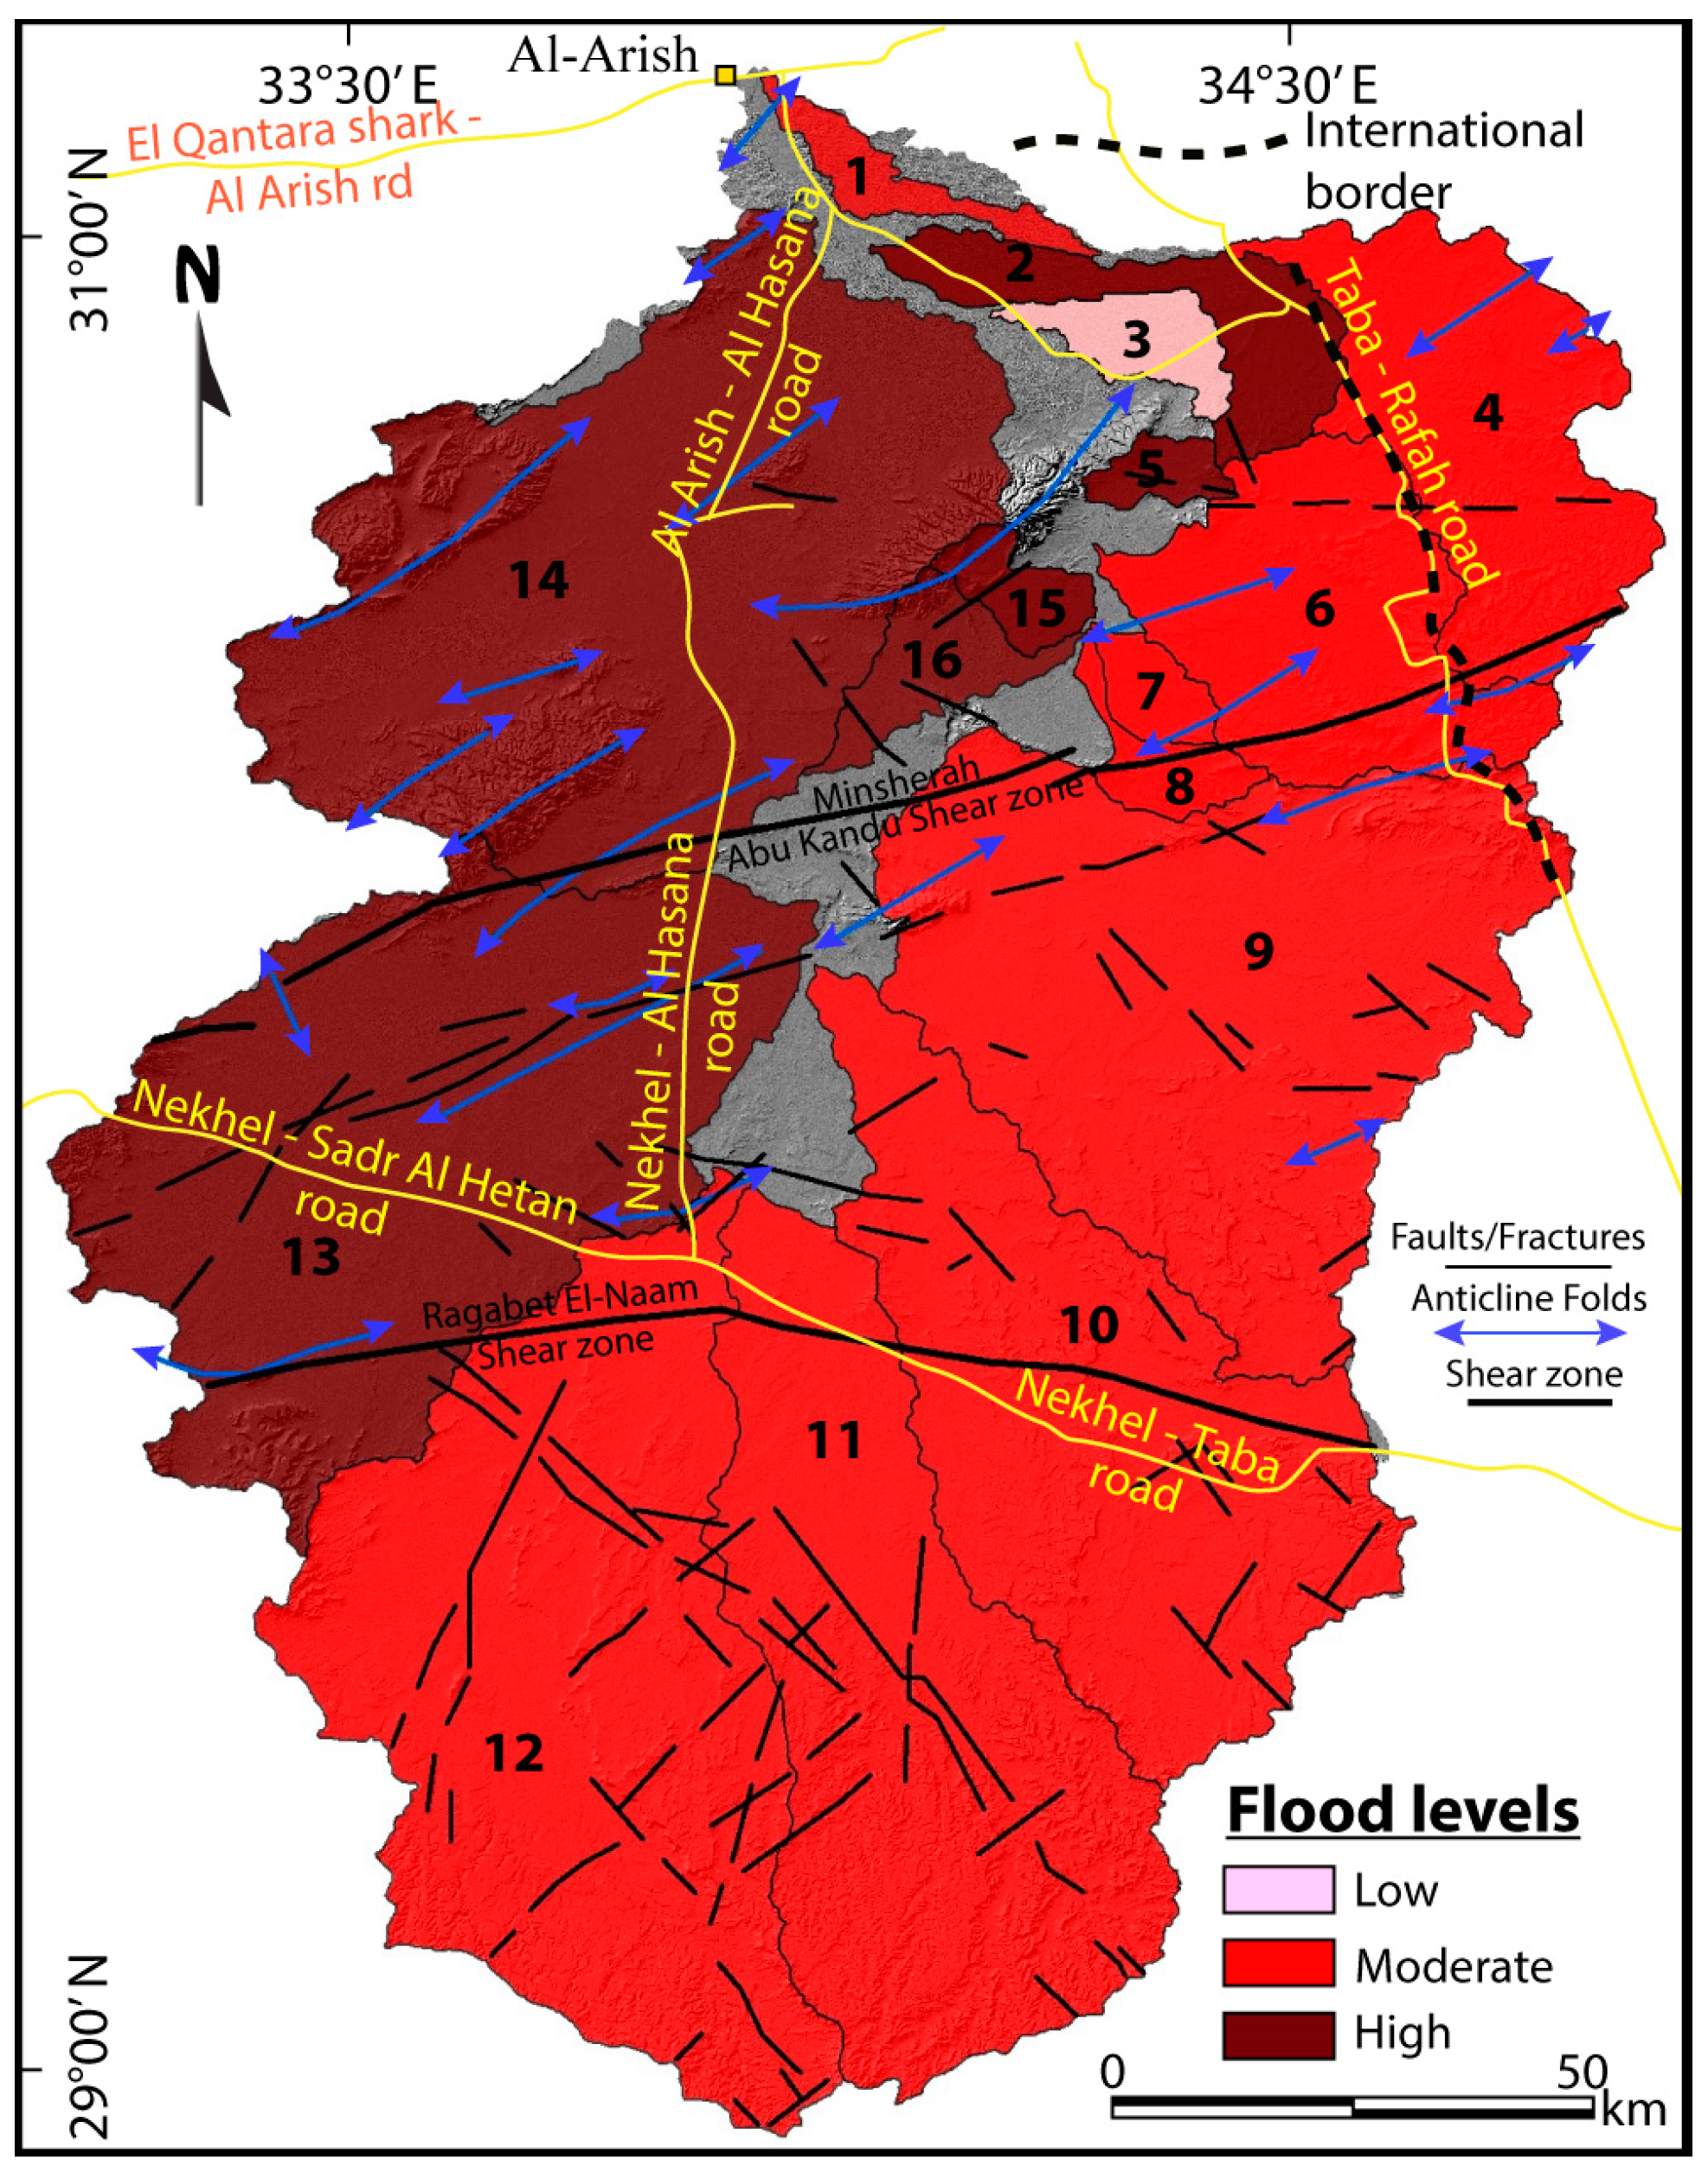
4.5. Flash Flood Evaluation Based on the Ranked Method
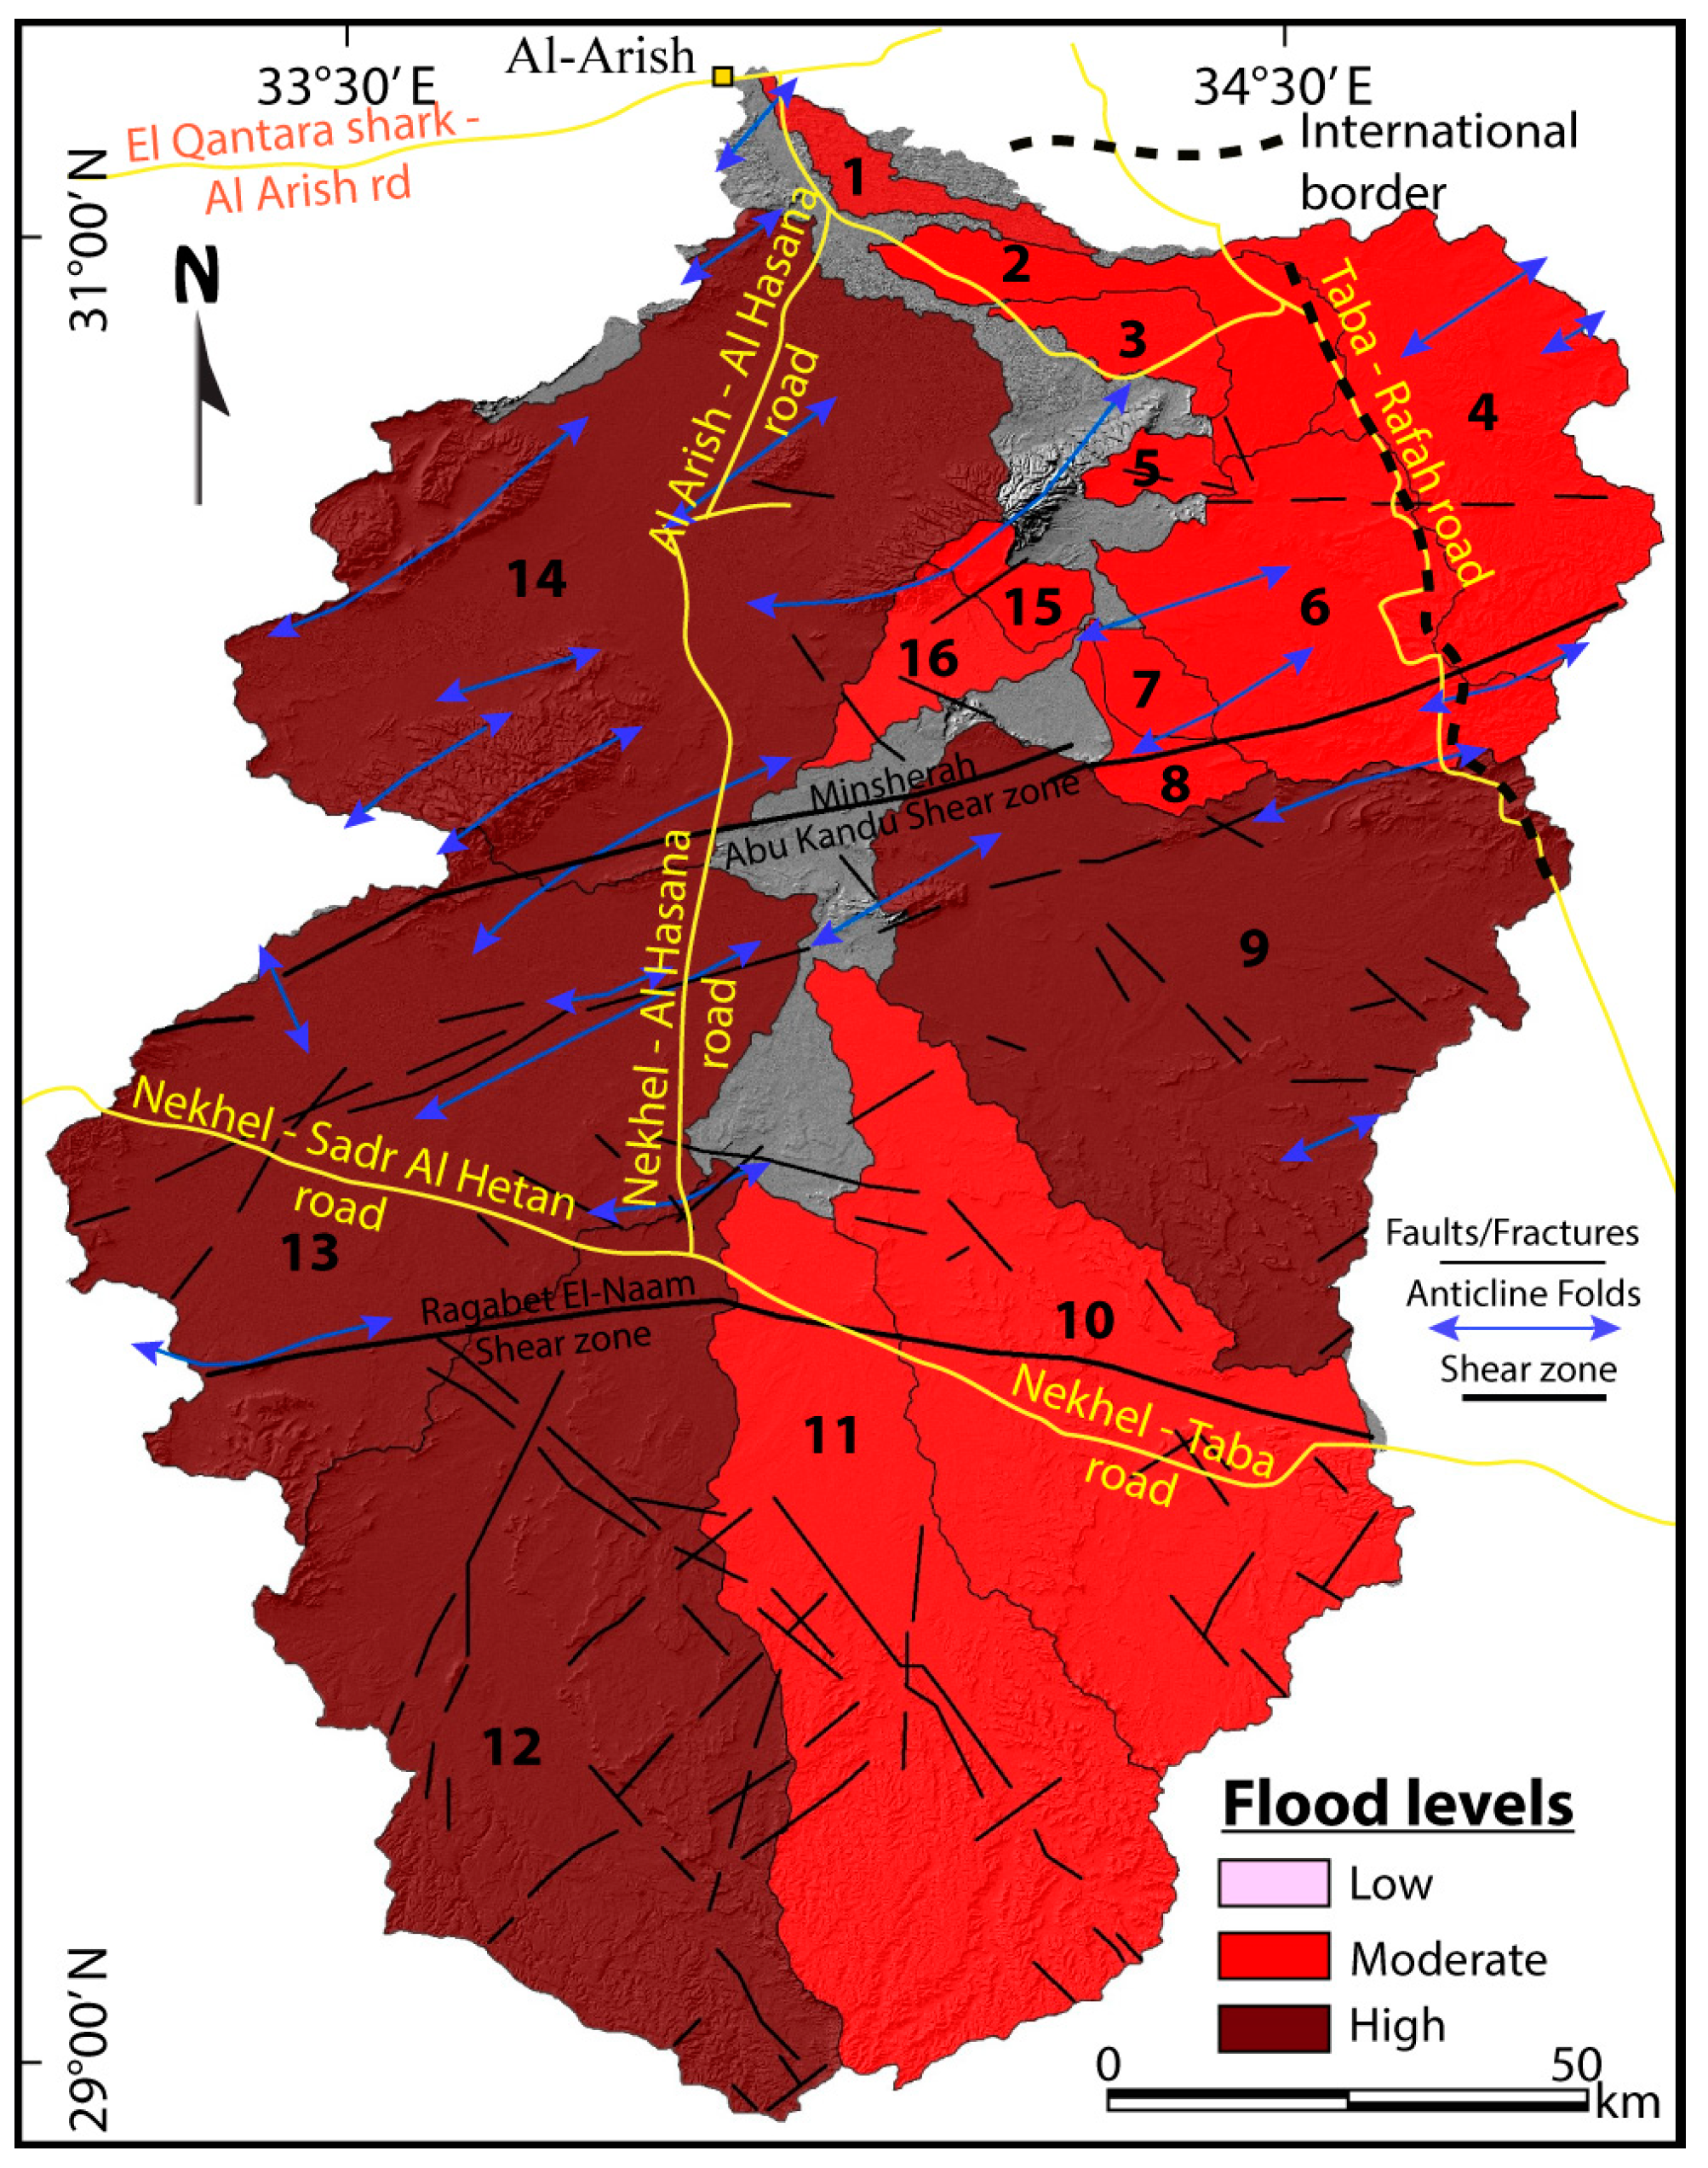
4.6. Overall Evaluation Based on the Combination Methods
4.7. Topographic Position Index
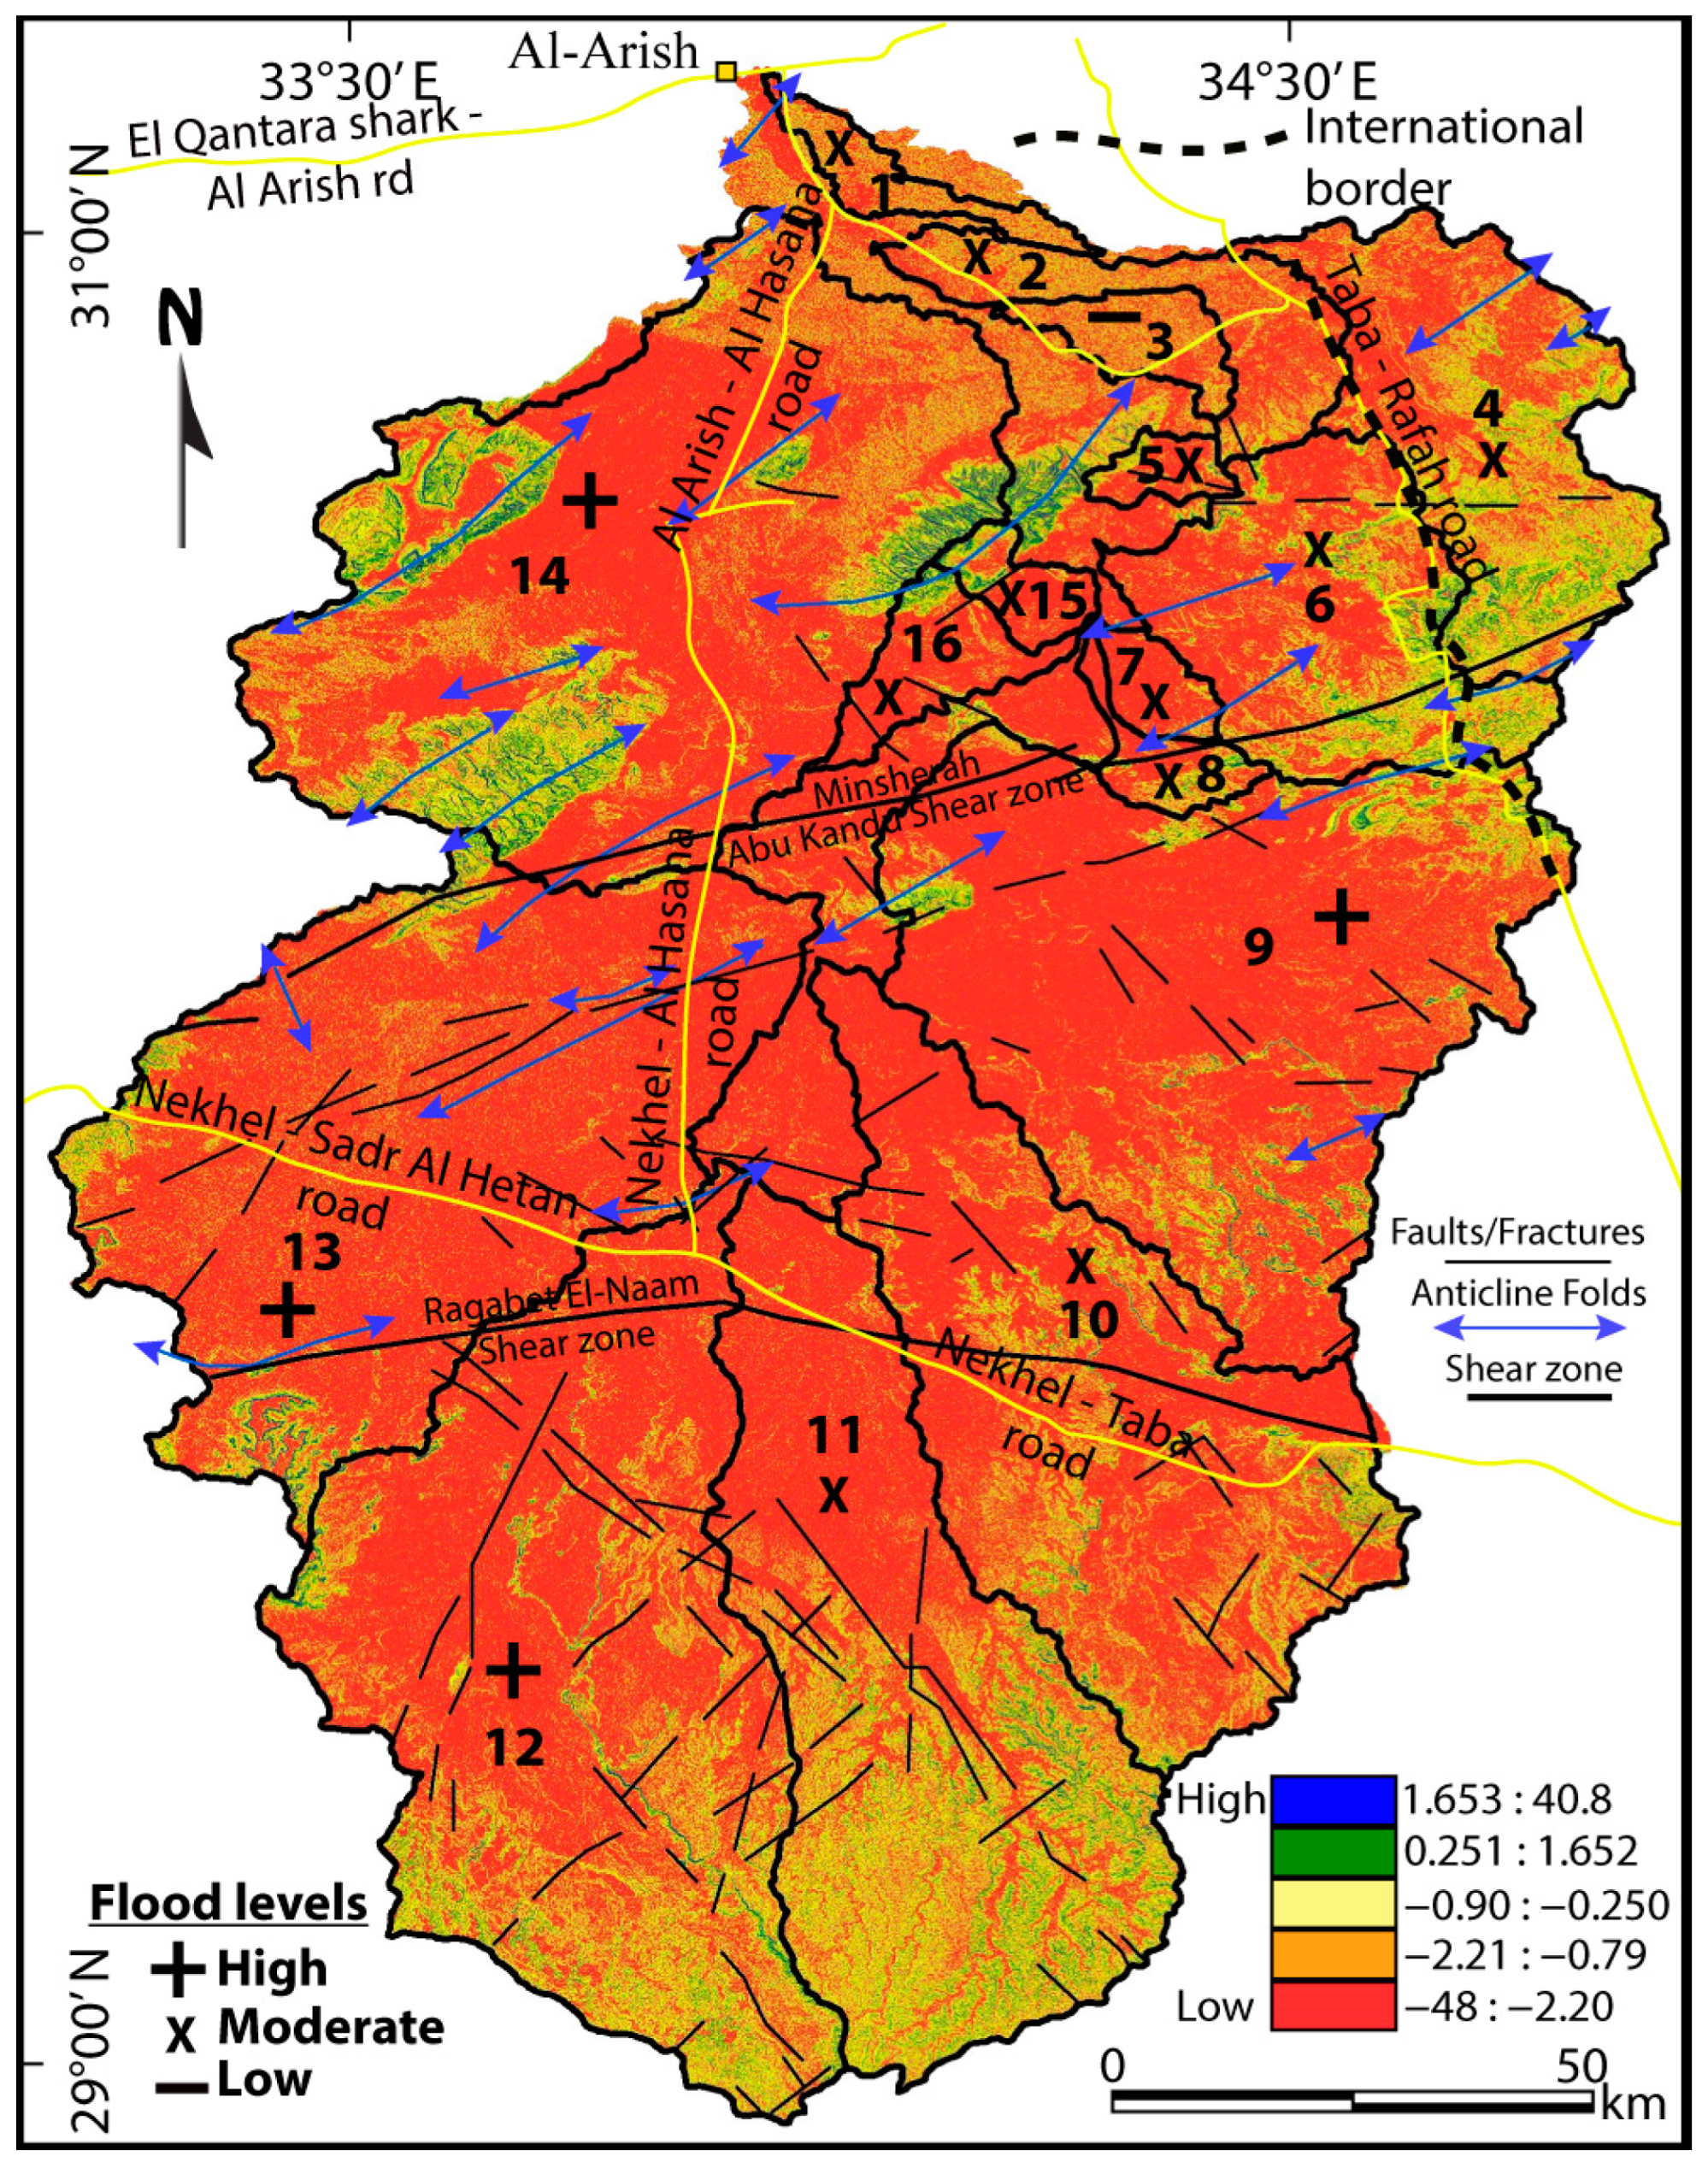
4.8. Flash Flood Hazard Susceptibility Levels
5. Conclusions and Suggestions
- Focus on applying the most modern advanced methods and data to monitor and evaluate this kind of serious risk preciously;
- Provide more attention to regularly updating the climatic datasets;
- Initiate response systems and monitoring stations in order to develop early risks warning techniques;
- Significant efforts such as hazard communication should be performed to help mitigate flood hazard effects and keep the environment safe and steady.
Author Contributions
Funding
Data Availability Statement
Acknowledgments
Conflicts of Interest
References
- Petrucci, O.; Aceto, L.; Bianchi, C.; Bigot, V.; Brázdil, R.; Pereira, S.; Kahraman, A.; Kılıç, Ö.; Kotroni, V.; Llasat, M.C.; et al. Flood Fatalities in Europe, 1980–2018: Variability, Features, and Lessons to Learn. Water 2019, 11, 1682. [Google Scholar] [CrossRef]
- Velasco, M.; Versini, P.A.; Cabello, A.; Barrera-Escoda, A. Assessment of flash floods taking into account climate change scenarios in the Llobregat River basin. Nat. Hazards Earth Syst. Sci. 2013, 13, 3145–3156. [Google Scholar] [CrossRef]
- Khalifa, A.; Bashir, B.; Alsalman, A.; Bachir, H. Morphometric-hydro Characterization of the Coastal Line between El-Qussier and Marsa-Alam, Egypt: Preliminary Flood Risk Signatures. Appl. Sci. 2022, 12, 6264. [Google Scholar] [CrossRef]
- Dankers, R.; Feyen, L. Flood hazard in Europe in an ensemble of regional climate scenarios. J. Geophys. Res. Atmos. 2009, 114, 1–16. [Google Scholar] [CrossRef]
- Bashir, B. Morphometric Parameters and Geospatial Analysis for Flash Flood Susceptibility Assessment: A Case Study of Jeddah City along the Red Sea Coast, Saudi Arabia. Water 2023, 15, 870. [Google Scholar] [CrossRef]
- Dawood, F.; Akhtar, M.M.; Ehsan, M. Evaluating urbanization impact on stressed aquifer of quetta valley, pakistan. Desalin. Water Treat. 2021, 222, 103–113. [Google Scholar] [CrossRef]
- Suparta, W.; Rahman, R.; Singh, M.S.J. Monitoring the variability of precipitable water vapor over the Klang Valley, Malaysia during flash flood. IOP Conf. Ser. Earth Environ. Sci. 2014, 20, 012057. [Google Scholar] [CrossRef]
- Bathrellos, G.D.; Karymbalis, E.; Skilodimou, H.D.; Gaki-Papanastassiou, K.; Baltas, E.A. Urban flood hazard assessment in the basin of Athens Metropolitan city, Greece. Environ. Earth Sci. 2016, 75, 319. [Google Scholar] [CrossRef]
- Alessio, G.; De Falco, M.; Di Crescenzo, G.; Nappi, R.; Santo, A. Flood hazard of the Somma-Vesuvius region based on historical (19–20th century) and geomorphological data. Ann. Geophys. 2013, 56, S0434. [Google Scholar] [CrossRef]
- Sherwood, J.M. Estimation of Flood Volumes and Simulation of Flood Hydrographs for Ungaged Small Rural Streams in Ohio. Water-Resour. Investig. Rep. 1993, 52, 4080. [Google Scholar] [CrossRef]
- Dawod, G.M.; Mirza, M.N.; Al-Ghamdi, K.A. GIS-Based Spatial Mapping of Flash Flood Hazard in Makkah City, Saudi Arabia. J. Geogr. Inf. Syst. 2011, 3, 225–231. [Google Scholar] [CrossRef]
- Manzoor, Z.; Ehsan, M.; Khan, M.B.; Manzoor, A.; Akhter, M.M.; Sohail, M.T.; Hussain, A.; Shafi, A.; Abu-Alam, T.; Abioui, M. Floods and flood management and its socio-economic impact on Pakistan: A review of the empirical literature. Front. Environ. Sci. 2022, 10, 2480. [Google Scholar] [CrossRef]
- Sohail, M.T.; Hussan, A.; Ehsan, M.; Al-Ansari, N.; Akhter, M.M.; Manzoor, Z.; Elbeltagi, A. Groundwater budgeting of Nari and Gaj formations and groundwater mapping of Karachi, Pakistan. Appl. Water Sci. 2022, 12, 267. [Google Scholar] [CrossRef]
- Ahmad, N.; Khan, S.; Ehsan, M.; Rehman, F.U.; Al-Shuhail, A. Estimating the Total Volume of Running Water Bodies Using Geographic Information System (GIS): A Case Study of Peshawar Basin (Pakistan). Sustainability 2022, 14, 3754, Correction in Sustainability 2022, 14, 8750. [Google Scholar] [CrossRef]
- Li, Z.; Zhang, Y.; Wang, J.; Ge, W.; Li, W.; Song, H.; Guo, X.; Wang, T.; Jiao, Y. Impact evaluation of geomorphic changes caused by extreme floods on inundation area considering geomorphic variations and land use types. Sci. Total Environ. 2021, 754, 142424. [Google Scholar] [CrossRef]
- Vincent, L.T.; Eaton, B.C.; Leenman, A.S.; Jakob, M. Secondary Geomorphic Processes and Their Influence on Alluvial Fan Morphology, Channel Behavior and Flood Hazards. J. Geophys. Res. Earth Surf. 2022, 127, e2021JF006371. [Google Scholar] [CrossRef]
- Khalifa, A.; Bashir, B.; Alsalman, A.; Öğretmen, N. Morpho-Tectonic Assessment of the Abu-Dabbab Area, Eastern Desert, Egypt: Insights from Remote Sensing and Geospatial Analysis. ISPRS Int. J. Geo-Inf. 2021, 10, 784. [Google Scholar] [CrossRef]
- Shah, S.M.H.; Mustaffa, Z.; Teo, F.Y.; Imam, M.A.H.; Yusof, K.W.; Al-Qadami, E.H.H. A review of the flood hazard and risk management in the South Asian Region, particularly Pakistan. Sci. Afr. 2020, 10, e00651. [Google Scholar] [CrossRef]
- Tariq, M.A.U.R.; Van de Giesen, N. Floods and flood management in Pakistan. Phys. Chem. Earth 2012, 47, 11–20. [Google Scholar] [CrossRef]
- Ahmad, F.; Kazmi, S.F.; Pervez, T. Human response to hydro-meteorological disasters: A case study of the 2010 flash floods in Pakistan. J. Geogr. Reg. Plan. 2011, 4, 518–524. [Google Scholar]
- Lepesteur, M.; Wegner, A.; Moore, S.A.; McComb, A. Importance of public information and perception for managing recreational activities in the Peel-Harvey estuary, Western Australia. J. Environ. Manag. 2008, 87, 389–395. [Google Scholar] [CrossRef] [PubMed]
- Ali, A.; Rana, I.A.; Ali, A.; Najam, F.A. Flood risk perception and communication: The role of hazard proximity. J. Environ. Manag. 2022, 316, 115309. [Google Scholar] [CrossRef] [PubMed]
- Ullah, F.; Saqib, S.E.; Ahmad, M.M.; Fadlallah, M.A. Flood risk perception and its determinants among rural households in two communities in Khyber Pakhtunkhwa, Pakistan. Nat. Hazards 2020, 104, 225–247. [Google Scholar] [CrossRef]
- Jamshed, A.; Birkmann, J.; McMillan, J.M.; Rana, I.A.; Feldmeyer, D.; Sauter, H. How do rural-urban linkages change after an extreme flood event? Empirical evidence from rural communities in Pakistan. Sci. Total Environ. 2021, 750, 141462. [Google Scholar] [CrossRef] [PubMed]
- Moawad, M.B. Analysis of the flash flood occurred on 18 January 2010 in wadi El Arish, Egypt (a case study). Geomat. Nat. Hazards Risk 2013, 4, 254–274. [Google Scholar] [CrossRef]
- Kader, H.A. GIS Based Morphometric Analysis of Wadi el-Arish Watershed Sinai, Egypt-Using ASTER (DEM) Data. Int. J. Sci. Eng. Res. 2020, 11, 682–694. [Google Scholar]
- Elbarbary, S.; Araffa, S.A.S.; El-Shahat, A.; Abdel Zaher, M.; Khedher, K.M. Delineation of water potentiality areas at Wadi El-Arish, Sinai, Egypt, using hydrological and geophysical techniques. J. Afr. Earth Sci. 2021, 174, 104056. [Google Scholar] [CrossRef]
- Bakheet, A.; Sefelnasr, A. Application of Remote Sensing data (GSMaP) to Flash Flood Modeling in an Arid Environment, Egypt. Int. Conf. Chem. Environ. Eng. 2018, 9, 252–272. [Google Scholar] [CrossRef]
- Morad, N. Assessment of the Rainfall Storm Events of January 2010 and March 2014 for the Catchment Modeling of Wadi El Arish and Wadi Wardan Basins, Sinai, Egypt. Egypt. J. Desert Res. 2016, 66, 137–168. [Google Scholar] [CrossRef]
- General Petroleum Corporation. Geological Map of Egypt, Scale 1:500,000; Gebel Hamata: Cairo, Egypt, 1987. [Google Scholar]
- Abdelsalam, M.G.; Stern, R.J. Sutures and shear zones in the Arabian-Nubian shield. J. Afr. Earth Sci. 1996, 23, 289–310. [Google Scholar] [CrossRef]
- Moustafa, A.R. Structural setting and tectonic evolution of North Sinai folds, Egypt. Geol. Soc. Spec. Publ. 2010, 341, 37–63. [Google Scholar] [CrossRef]
- Abdelfadil, K.M.; Obeid, M.A.; Azer, M.K.; Asimow, P.D. Late Neoproterozoic adakitic lavas in the Arabian-Nubian shield, Sinai Peninsula, Egypt. J. Asian Earth Sci. 2018, 158, 301–323. [Google Scholar] [CrossRef]
- El-Ghazawi, M.M. Hydrogeological Studies in Northeast Sinai, Egypt. Ph.D. Thesis, Departement of Geology, Faculty of Science, Mansoura University, Mansoura, Egypt, 1989; 290p. [Google Scholar]
- El-Shamy, I. Recent Recharge and Flash Flooding Opportunities in the Eastern Desert, Egypt. Annals of Geological Survey of Egypt. Ann. Geol. Surv. Egypt 1992, 18, 323–334. [Google Scholar]
- Bajabaa, S.; Masoud, M.; Al-Amri, N. Flash flood hazard mapping based on quantitative hydrology, geomorphology and GIS techniques (case study of Wadi Al Lith, Saudi Arabia). Arab. J. Geosci. 2014, 7, 2469–2481. [Google Scholar] [CrossRef]
- Elsadek, W.M.; Ibrahim, M.G.; Mahmod, W.E.; Kanae, S. Developing an overall assessment map for flood hazard on large area watershed using multi-method approach: Case study of Wadi Qena watershed, Egypt. Nat. Hazards 2019, 95, 739–767. [Google Scholar] [CrossRef]
- Kamel, M.; Arfa, M. Integration of remotely sensed and seismicity data for geo-natural hazard assessment along the Red Sea Coast, Egypt. Arab. J. Geosci. 2020, 13, 1195. [Google Scholar] [CrossRef]
- Davis, J.C. Statistics and Data Analysis in Geology, 3rd ed.; Wiley: New York, NY, USA, 1975; 656p. [Google Scholar]
- Horton, R.E. Erosional development of streams and their drainage basins: Hydrophysical approach to quantitative morphology. Bull. Geol. Soc. Am. 1945, 56, 275–370. [Google Scholar] [CrossRef]
- Cotti, D.; Harb, M.; Hadri, A.; Aboufirass, M.; Chaham, K.R.; Libertino, A.; Campo, L.; Trasforini, E.; Krätzschmar, E.; Bellert, F.; et al. An Integrated Multi-Risk Assessment for Floods and Drought in the Marrakech-Safi Region (Morocco). Front. Water 2022, 4, 886648. [Google Scholar] [CrossRef]
- Owen, L.A. 5.2 Tectonic Geomorphology: A Perspective. In Treatise on Geomorphology; Elsevier: Amsterdam, The Netherlands, 2013; Volume 148, pp. 3–12. ISBN 9780123983534. [Google Scholar]
- Horton, R.E. Drainage-basin characteristics. Trans. Am. Geophys. Union 1932, 13, 350–361. [Google Scholar] [CrossRef]
- Arnous, M.O.; Aboulela, H.A.; Green, D.R. Geo-environmental hazards assessment of the north western Gulf of Suez, Egypt. J. Coast. Conserv. 2011, 15, 37–50. [Google Scholar] [CrossRef]
- Alam, A.; Ahmed, B.; Sammonds, P. Flash flood susceptibility assessment using the parameters of drainage basin morphometry in SE Bangladesh. Quat. Int. 2021, 575–576, 295–307. [Google Scholar] [CrossRef]
- Horton, R.E.; Hitrata, T. Erosional development of streams and their drainage basins, hydrophysical approach to quantitative morphology. J. Jpn. For. Soc. 1955, 37, 417–420. [Google Scholar] [CrossRef]
- Schumm, S.A. Evolution of drainage systems and slopes in badlands at Perth Amboy, New Jersey. Geol. Soc. Am. Bull. 1956, 67, 597–646. [Google Scholar] [CrossRef]
- Strahler, A. Dynamic Basis of Geomorphology. Geol. Soc. Am. Bull. 1952, 63, 923–938. [Google Scholar] [CrossRef]
- El-Fakharany, M.A.; Mansour, N.M. Morphometric analysis and flash floods hazards assessment for Wadi Al Aawag drainage Basins, southwest Sinai, Egypt. Environ. Earth Sci. 2021, 80, 168. [Google Scholar] [CrossRef]
- Smith, K.G. Standards for grading texture of erosional topography. Am. J. Sci. 1950, 248, 655–668. [Google Scholar] [CrossRef]
- Faniran, A. The Index of Drainage Intensity—A Provisional New Drainage Factor. Aust. J. Sci. 1968, 31, 328–330. [Google Scholar]
- Melton, M.A. An Analysis of the Relations Among Elements of Climate, Surface Properties, and Geomorphology; Technical Report 11; Office of Naval Research, Geography Branch: New York, NY, USA, 1957; 102p. [Google Scholar] [CrossRef]
- Weiss, A. Topographic position and landforms analysis. In Proceedings of the Poster Presentation, ESRI User Conference, San Diego, CA, USA, 9–13 July 2001. [Google Scholar]
- Strahler, A.N. Quantitative Geomorphology of Drainage Basins and Channel Networks. In Handbook of Applied Hydrology; Chow, V.T., Ed.; McGraw Hill B. Company: New York, NY, USA, 1964; pp. 439–476. [Google Scholar]
- Bhat, M.S.; Alam, A.; Ahmad, S.; Farooq, H.; Ahmad, B. Flood hazard assessment of upper Jhelum basin using morphometric parameters. Environ. Earth Sci. 2019, 78, 54. [Google Scholar] [CrossRef]
- Mesa, L.M. Morphometric analysis of a subtropical Andean basin (Tucumán, Argentina). Environ. Geol. 2006, 50, 1235–1242. [Google Scholar] [CrossRef]
- Patton, P.C. Drainage basin morphometry and floods. In Flood Geomorphology; Baker, V., Kochel, R., Patton, P., Eds.; Wiley: New York, NY, USA, 1988; pp. 51–65. [Google Scholar]
- Obi Reddy, G.P.; Maji, A.K.; Gajbhiye, K.S. Drainage morphometry and its influence on landform characteristics in a basaltic terrain, Central India—A remote sensing and GIS approach. Int. J. Appl. Earth Obs. Geoinf. 2004, 6, 1–16. [Google Scholar] [CrossRef]
- Gregory, K.J.; Wallingford, D.E. Drainage Basin Form and Process—A Geomorphological Approach; Wiley: New York, NY, USA, 1973; 456p. [Google Scholar] [CrossRef]
- Hajam, R.A.; Hamid, A.; Bhat, S. Application of Morphometric Analysis for Geo-Hydrological Studies Using Geo-Spatial Technology –A Case Study of Vishav Drainage Basin. J. Waste Water Treat. Anal. 2013, 4, 1–12. [Google Scholar] [CrossRef]
- Azor, A.; Keller, E.A.; Yeats, R.S. Geomorphic indicators of active fold growth: South Mountain-Oak Ridge anticline, Ventura basin, southern California. Bull. Geol. Soc. Am. 2002, 114, 745–753. [Google Scholar] [CrossRef]
- Keller, E.A.; Pinter, N. Active Tectonics: Earthquakes, Uplift and Landscape, 2nd ed.; Prentice Hall: Upper Saddle River, NJ, USA, 2002. [Google Scholar]
- Bhatt, S.; Ahmed, S.A. Morphometric analysis to determine floods in the Upper Krishna basin using Cartosat DEM. Geocarto Int. 2014, 29, 878–894. [Google Scholar] [CrossRef]
- Kabite, G.; Gessesse, B. Hydro-geomorphological characterization of Dhidhessa River Basin, Ethiopia. Int. Soil Water Conserv. Res. 2018, 6, 175–183. [Google Scholar] [CrossRef]
- Costa, J.E. Hydraulics and basin morphometry of the largest flash floods in the conterminous United States. J. Hydrol. 1987, 93, 313–338. [Google Scholar] [CrossRef]
- Patton, P.C.; Baker, V.R. Morphometry and floods in small drainage basins subject to diverse hydrogeomorphic controls. Water Resour. Res. 1976, 12, 941–952. [Google Scholar] [CrossRef]
- Adnan, M.S.G.; Dewan, A.; Zannat, K.E.; Abdullah, A.Y.M. The use of watershed geomorphic data in flash flood susceptibility zoning: A case study of the Karnaphuli and Sangu river basins of Bangladesh. Nat. Hazards 2019, 99, 425–448. [Google Scholar] [CrossRef]
- Dadamouny, M.A.; Schnittler, M. Trends of climate with rapid change in Sinai, Egypt. J. Water Clim. Chang. 2016, 7, 393–414. [Google Scholar] [CrossRef]
- Mohamed, S.A.; El-Raey, M.E. Vulnerability assessment for flash floods using GIS spatial modeling and remotely sensed data in El-Arish City, North Sinai, Egypt. Nat. Hazards 2020, 102, 707–728. [Google Scholar] [CrossRef]
- Pawluszek, K.; Borkowski, A. Impact of DEM-derived factors and analytical hierarchy process on landslide susceptibility mapping in the region of Rożnów Lake, Poland. Nat. Hazards 2017, 86, 919–952. [Google Scholar] [CrossRef]
- Jebur, M.N.; Pradhan, B.; Tehrany, M.S. Optimization of landslide conditioning factors using very high-resolution airborne laser scanning (LiDAR) data at catchment scale. Remote Sens. Environ. 2014, 152, 150–165. [Google Scholar] [CrossRef]
- Pourghasemi, H.R.; Moradi, H.R.; Fatemi Aghda, S.M.; Gokceoglu, C.; Pradhan, B. GIS-based landslide susceptibility mapping with probabilistic likelihood ratio and spatial multi-criteria evaluation models (North of Tehran, Iran). Arab. J. Geosci. 2014, 7, 1857–1878. [Google Scholar] [CrossRef]
- Görüm, T. Tectonic, topographic and rock-type influences on large landslides at the northern margin of the Anatolian Plateau. Landslides 2019, 16, 333–346. [Google Scholar] [CrossRef]
- De Reu, J.; Bourgeois, J.; Bats, M.; Zwertvaegher, A.; Gelorini, V.; De Smedt, P.; Chu, W.; Antrop, M.; De Maeyer, P.; Finke, P.; et al. Application of the topographic position index to heterogeneous landscapes. Geomorphology 2013, 186, 39–49. [Google Scholar] [CrossRef]
- Woods, R.A.; Sivapalan, M. A connection between topographically driven runoff generation and channel network structure. Water Resour. Res. 1997, 33, 2939–2950. [Google Scholar] [CrossRef]


| Catchments | Area (km2) (A) | Perimeter (km) (P) | Length (km) (Lu) | Elevation (m) Max (H) | Elevation (m) Min (h) |
|---|---|---|---|---|---|
| C1 | 142.2 | 100.74 | 41.1 | 149 | 04 |
| C2 | 402.45 | 149.65 | 61.2 | 463 | 27 |
| C3 | 164.18 | 76.38 | 29.6 | 341 | 93 |
| C4 | 1067.01 | 201.15 | 34.5 | 1023 | 151 |
| C5 | 81.78 | 46.12 | 14 | 460 | 162 |
| C6 | 1000.85 | 169.06 | 50.9 | 1030 | 172 |
| C7 | 104.69 | 46.42 | 19 | 461 | 189 |
| C8 | 124.25 | 70.3 | 28.2 | 656 | 190 |
| C9 | 2888.03 | 283.34 | 62.2 | 999 | 231 |
| C10 | 2347.29 | 277 | 95.2 | 1198 | 305 |
| C11 | 2454.98 | 273.13 | 104 | 1630 | 372 |
| C12 | 3237.79 | 314.27 | 96.9 | 1603 | 372 |
| C13 | 3111.62 | 301.95 | 80.5 | 1050 | 288 |
| C14 | 3351.79 | 301.25 | 78.3 | 1077 | 45 |
| C15 | 220.16 | 92.87 | 23.7 | 897 | 189 |
| C16 | 119.73 | 54.1 | 17.4 | 908 | 178 |
| Catchments | I | II | III | IV | V | VI | Total |
|---|---|---|---|---|---|---|---|
| C1 | 51 | 27 | 21 | 0 | 0 | 0 | 99 |
| C2 | 144 | 72 | 37 | 34 | 0 | 0 | 287 |
| C3 | 53 | 24 | 22 | 6 | 0 | 0 | 105 |
| C4 | 380 | 202 | 103 | 19 | 45 | 6 | 755 |
| C5 | 35 | 19 | 8 | 7 | 0 | 0 | 69 |
| C6 | 350 | 168 | 69 | 65 | 39 | 7 | 698 |
| C7 | 38 | 23 | 8 | 6 | 0 | 0 | 75 |
| C8 | 37 | 19 | 9 | 7 | 0 | 0 | 72 |
| C9 | 1020 | 466 | 276 | 173 | 83 | 18 | 2036 |
| C10 | 838 | 409 | 207 | 96 | 61 | 60 | 1672 |
| C11 | 794 | 379 | 223 | 94 | 52 | 41 | 1583 |
| C12 | 1167 | 555 | 300 | 195 | 93 | 18 | 2328 |
| C13 | 1083 | 510 | 299 | 166 | 63 | 39 | 2159 |
| C14 | 1179 | 556 | 323 | 150 | 110 | 38 | 2357 |
| C15 | 82 | 38 | 31 | 13 | 0 | 0 | 164 |
| C16 | 50 | 27 | 10 | 6 | 5 | 0 | 98 |
| Catchments | Nu | Lu | Rb | Fs | F | Rt | Dd | If | Hr | Rn | Rr |
|---|---|---|---|---|---|---|---|---|---|---|---|
| C1 | 99 | 140.89 | 1.58 | 0.69 | 0.08 | 0.98 | 0.99 | 0.70 | 145 | 0.14 | 03.52 |
| C2 | 287 | 431.02 | 1.67 | 0.71 | 0.10 | 1.91 | 1.07 | 0.66 | 436 | 0.46 | 07.12 |
| C3 | 105 | 184.65 | 4.52 | 0.63 | 0.18 | 1.37 | 1.12 | 0.56 | 248 | 0.27 | 08.37 |
| C4 | 755 | 1005.93 | 3.43 | 0.70 | 0.89 | 3.75 | 0.94 | 0.75 | 872 | 0.82 | 25.27 |
| C5 | 69 | 78.93 | 1.78 | 0.84 | 0.41 | 1.49 | 0.96 | 0.87 | 298 | 0.28 | 21.28 |
| C6 | 698 | 990.06 | 2.56 | 0.69 | 0.38 | 4.12 | 0.98 | 0.70 | 858 | 0.84 | 16.85 |
| C7 | 75 | 110.98 | 1.95 | 0.71 | 0.29 | 1.61 | 1.06 | 0.67 | 272 | 0.28 | 14.31 |
| C8 | 72 | 129.37 | 1.78 | 0.57 | 0.15 | 1.02 | 1.04 | 0.55 | 466 | 0.48 | 16.52 |
| C9 | 2036 | 2953.69 | 2.43 | 0.70 | 0.74 | 7.18 | 1.02 | 0.68 | 768 | 0.78 | 12.34 |
| C10 | 1672 | 2348.20 | 1.75 | 0.71 | 0.25 | 6.03 | 1.00 | 0.71 | 893 | 0.89 | 09.38 |
| C11 | 1583 | 2501.54 | 1.84 | 0.64 | 0.22 | 5.79 | 1.01 | 0.63 | 1258 | 1.28 | 12.09 |
| C12 | 2328 | 3205.29 | 2.55 | 0.71 | 0.34 | 7.40 | 0.98 | 0.72 | 1231 | 1.21 | 12.70 |
| C13 | 2159 | 3413.22 | 1.97 | 0.69 | 0.48 | 7.15 | 1.09 | 0.63 | 762 | 0.83 | 09.46 |
| C14 | 2357 | 3820.63 | 2.05 | 0.70 | 0.54 | 7.82 | 1.13 | 0.61 | 1032 | 1.17 | 13.18 |
| C15 | 164 | 237.37 | 1.92 | 0.74 | 0.39 | 1.76 | 1.07 | 0.69 | 708 | 0.76 | 29.87 |
| C16 | 98 | 119.03 | 1.58 | 0.81 | 0.39 | 1.81 | 0.99 | 0.82 | 730 | 0.72 | 41.95 |
| Catchments | Nu | Lu | Rb | Fs | F | Rt | Dd | If | Hr | Rn | Rr | Sum | General Hazard Level |
|---|---|---|---|---|---|---|---|---|---|---|---|---|---|
| C1 | 1.02 | 1.03 | 1.00 | 1.55 | 1.00 | 0.99 | 1.48 | 1.91 | 1.00 | 1.00 | 0.99 | 13.02 | 1.18 |
| C2 | 1.90 | 1.18 | 1.06 | 1.72 | 1.05 | 1.27 | 2.30 | 1.68 | 1.52 | 1.50 | 1.17 | 15.68 | 1.42 |
| C3 | 1.03 | 1.05 | 3.00 | 1.00 | 1.25 | 1.11 | 2.84 | 1.07 | 1.18 | 1.21 | 1.23 | 16.00 | 1.45 |
| C4 | 1.59 | 1.49 | 2.26 | 1.66 | 2.99 | 1.80 | 1.00 | 2.22 | 2.30 | 2.05 | 2.03 | 21.45 | 1.95 |
| C5 | 1.00 | 1.00 | 1.13 | 3.00 | 1.82 | 1.15 | 1.22 | 2.99 | 1.27 | 1.22 | 1.84 | 17.67 | 1.60 |
| C6 | 1.54 | 1.48 | 1.66 | 1.56 | 1.74 | 1.91 | 1.47 | 1.93 | 2.28 | 2.10 | 1.63 | 19.35 | 1.75 |
| C7 | 1.00 | 1.01 | 1.24 | 1.75 | 1.50 | 1.18 | 2.19 | 1.75 | 1.22 | 1.22 | 1.51 | 15.62 | 1.42 |
| C8 | 1.00 | 1.02 | 1.13 | 0.41 | 1.17 | 1.01 | 1.99 | 1.00 | 1.57 | 1.53 | 1.61 | 13.49 | 1.22 |
| C9 | 2.71 | 2.53 | 1.57 | 1.32 | 2.63 | 2.81 | 1.81 | 1.83 | 2.11 | 2.00 | 1.42 | 22.78 | 2.07 |
| C10 | 2.40 | 2.21 | 1.11 | 1.71 | 1.43 | 2.47 | 1.58 | 1.97 | 2.34 | 2.16 | 1.72 | 20.70 | 1.88 |
| C11 | 2.32 | 2.29 | 1.17 | 1.05 | 1.35 | 2.40 | 1.77 | 1.48 | 3.00 | 2.77 | 1.40 | 21.04 | 1.91 |
| C12 | 2.97 | 2.67 | 1.47 | 1.77 | 1.64 | 2.87 | 1.47 | 2.06 | 2.95 | 2.67 | 1.43 | 24.21 | 2.20 |
| C13 | 2.82 | 2.78 | 2.56 | 1.53 | 1.97 | 2.80 | 2.56 | 1.47 | 2.10 | 2.07 | 1.28 | 22.69 | 2.06 |
| C14 | 3.00 | 3.00 | 3.00 | 1.62 | 2.13 | 3.00 | 3.00 | 1.38 | 2.59 | 2.61 | 1.46 | 25.12 | 2.28 |
| C15 | 1.08 | 1.08 | 2.37 | 2.03 | 1.75 | 1.22 | 2.37 | 1.84 | 2.01 | 1.96 | 2.25 | 18.86 | 1.71 |
| C16 | 1.02 | 1.02 | 1.52 | 2.75 | 1.76 | 1.24 | 1.52 | 2.67 | 2.05 | 1.90 | 2.83 | 19.98 | 1.81 |
Disclaimer/Publisher’s Note: The statements, opinions and data contained in all publications are solely those of the individual author(s) and contributor(s) and not of MDPI and/or the editor(s). MDPI and/or the editor(s) disclaim responsibility for any injury to people or property resulting from any ideas, methods, instructions or products referred to in the content. |
© 2023 by the authors. Licensee MDPI, Basel, Switzerland. This article is an open access article distributed under the terms and conditions of the Creative Commons Attribution (CC BY) license (https://creativecommons.org/licenses/by/4.0/).
Share and Cite
Khalifa, A.; Bashir, B.; Alsalman, A.; Naik, S.P.; Nappi, R. Remotely Sensed Data, Morpho-Metric Analysis, and Integrated Method Approach for Flood Risk Assessment: Case Study of Wadi Al-Arish Landscape, Sinai, Egypt. Water 2023, 15, 1797. https://doi.org/10.3390/w15091797
Khalifa A, Bashir B, Alsalman A, Naik SP, Nappi R. Remotely Sensed Data, Morpho-Metric Analysis, and Integrated Method Approach for Flood Risk Assessment: Case Study of Wadi Al-Arish Landscape, Sinai, Egypt. Water. 2023; 15(9):1797. https://doi.org/10.3390/w15091797
Chicago/Turabian StyleKhalifa, Abdelrahman, Bashar Bashir, Abdullah Alsalman, Sambit Prasanajit Naik, and Rosa Nappi. 2023. "Remotely Sensed Data, Morpho-Metric Analysis, and Integrated Method Approach for Flood Risk Assessment: Case Study of Wadi Al-Arish Landscape, Sinai, Egypt" Water 15, no. 9: 1797. https://doi.org/10.3390/w15091797