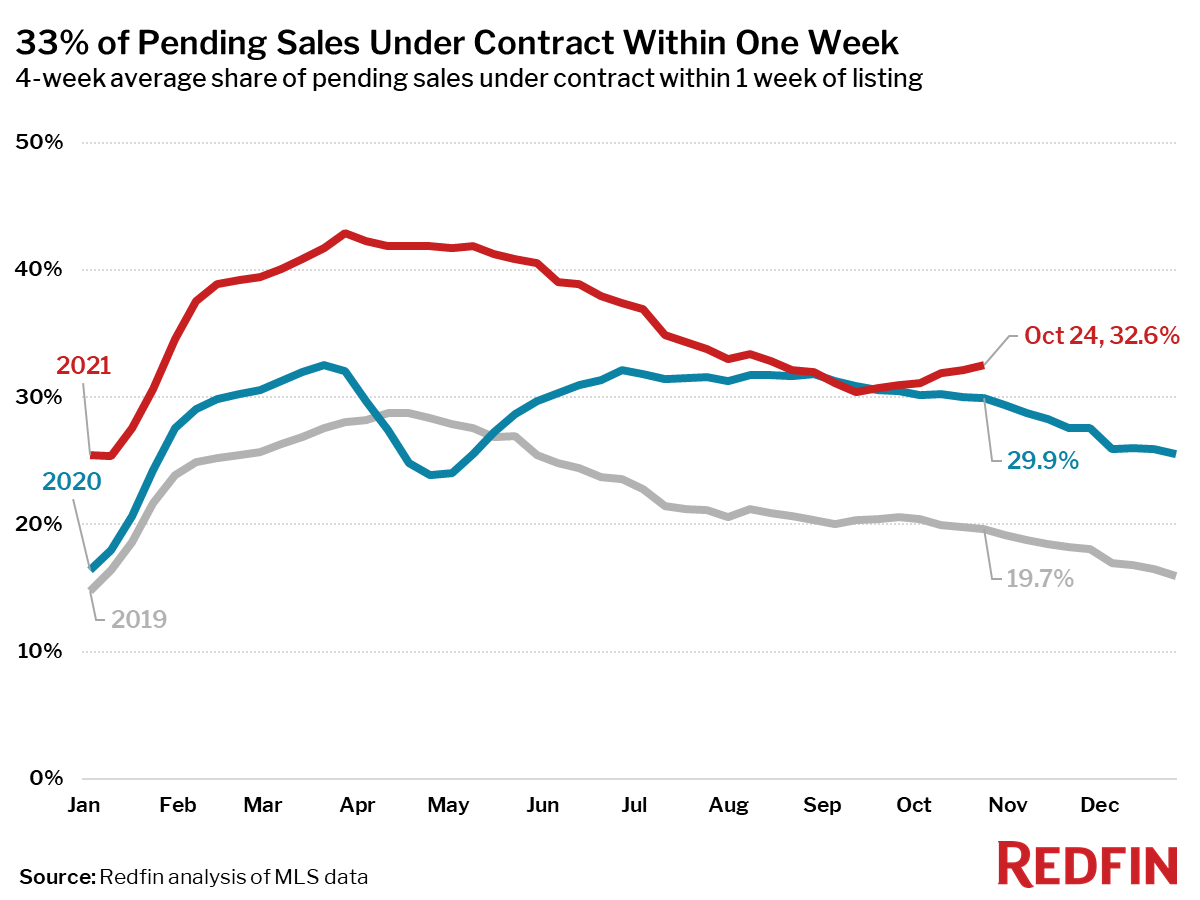
One-third of homes sold were under contract in a week.
One-third of homes that sold in the past four weeks went under contract within seven days of hitting the market. This rate has been on the rise for the past six weeks, during a time of year when the market typically slows down. It’s likely that the market is speeding up now because homebuyer demand is holding steady and strong; home tours are up twice as much from January as they were at this time in 2019. Yet homes for sale remain few and far between.
“Homes continue to sell quicker and quicker,” said Redfin Chief Economist Daryl Fairweather. “There are still plenty of homebuyers lying in wait who missed out during the Spring frenzy, and they are snatching up homes quickly. Now, those homes are selling for near-record prices. The housing market will likely stay hot until mortgage rates rise substantially.”
Key housing market takeaways for 400+ U.S. metro areas:
Unless otherwise noted, the data in this report covers the four-week period ending October 24. Redfin’s housing market data goes back through 2012. Except where indicated otherwise, the housing market is generally experiencing seasonal cooling trends, similar to what was seen during this same period in 2019. Comparing today’s market with the pre-pandemic fall market of 2019 highlights how hot the market remains, even as most measures are settling into typical seasonal patterns.
Data based on homes listed and/or sold during the period:
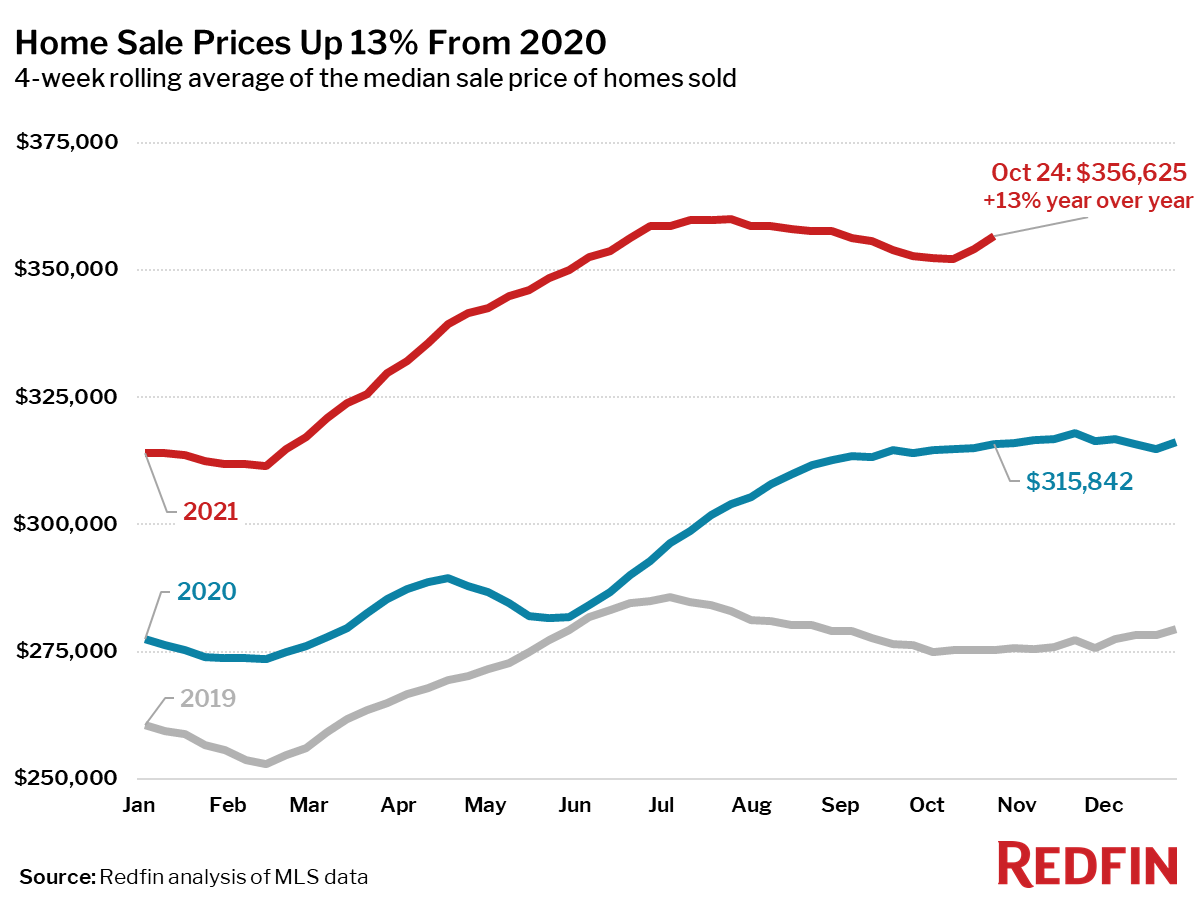
- The median home-sale price increased 13% year over year to $358,125. This was up 30% from the same period in 2019.
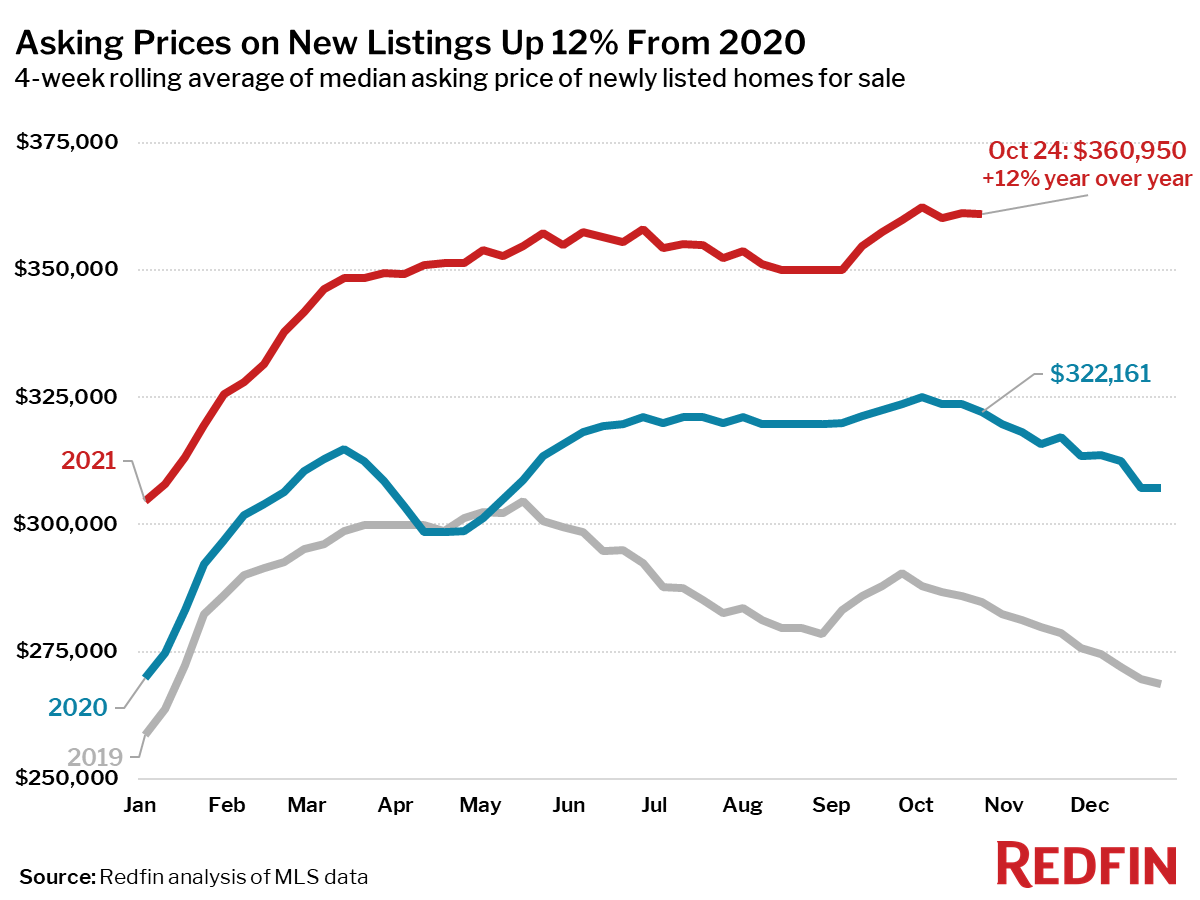
- Asking prices of newly listed homes were up 11% from the same time a year ago and up 26% from 2019 to a median of $362,335, down 1% from the all-time high set during the four-week period ending October 3. Asking prices typically increase in September and then begin to decline in October through the end of the year.
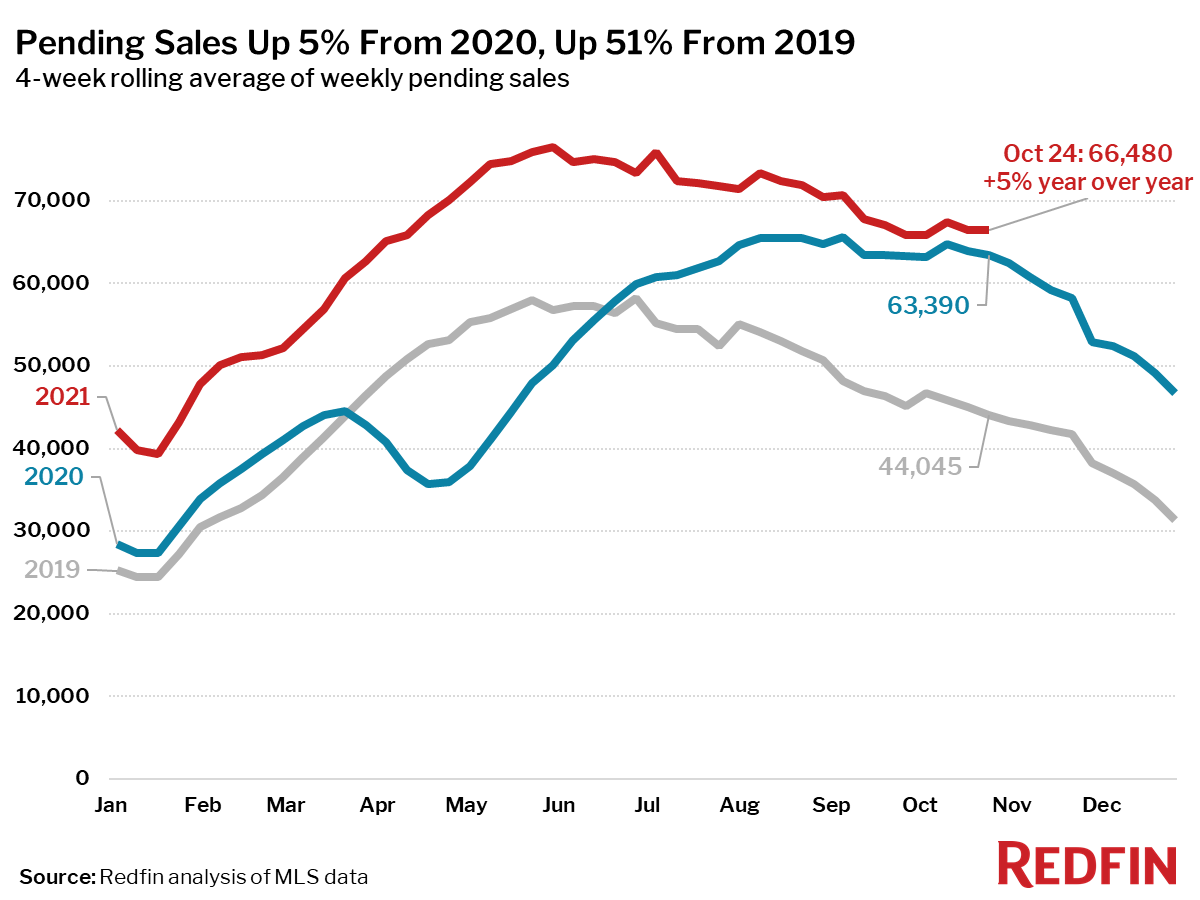
- Pending home sales were up 2% year over year, and up 47% compared to the same period in 2019, which was a more typical year in terms of seasonality for sales and listings.
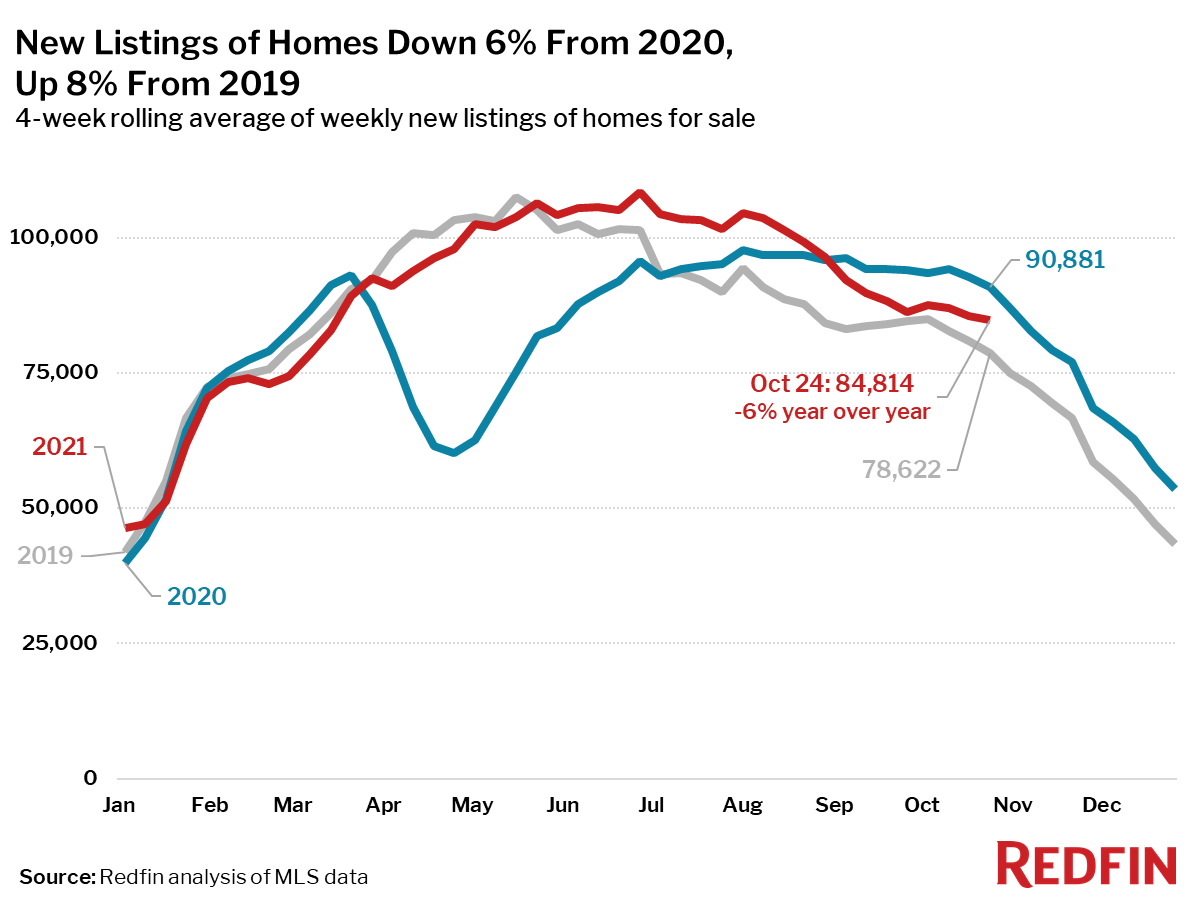
- New listings of homes for sale were down 8% from a year earlier. New listings remained positive compared to 2019, up 6%.
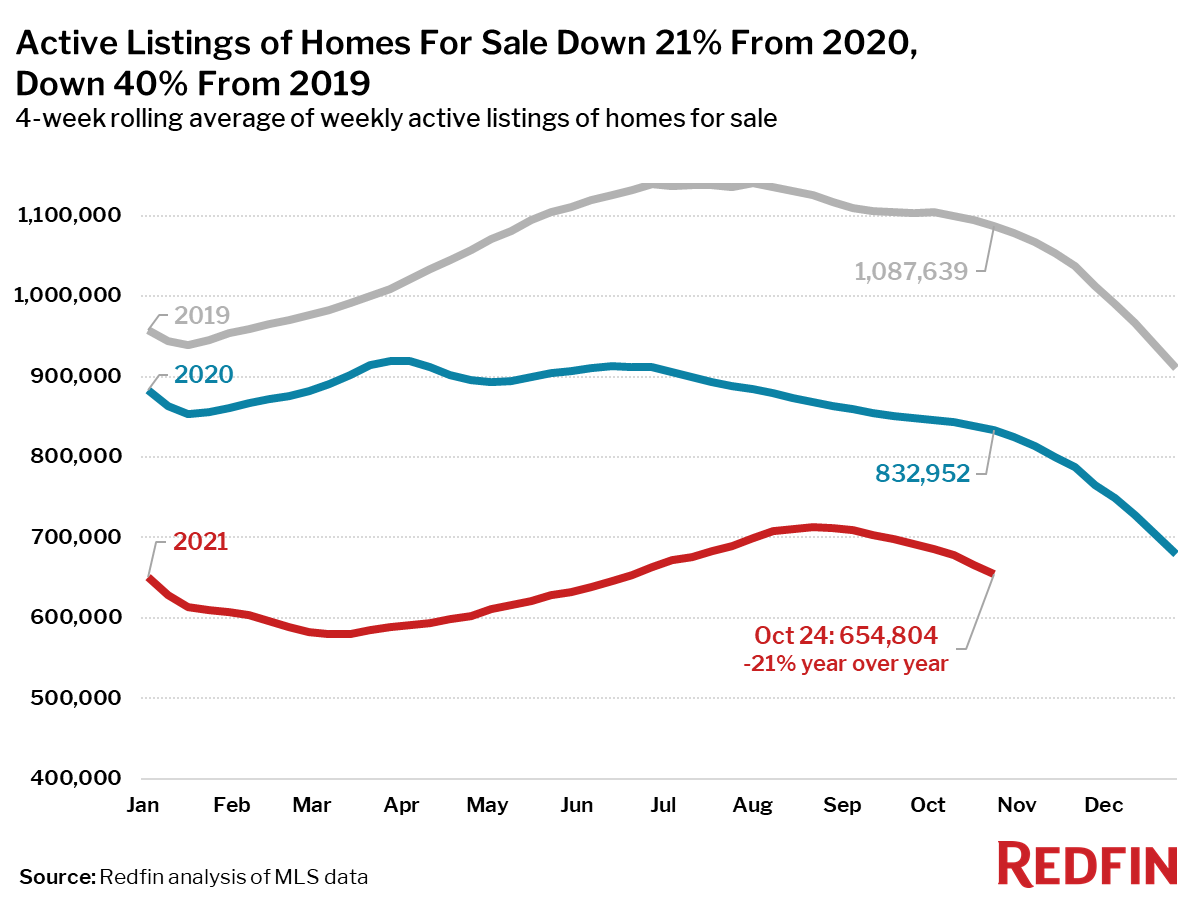
- Active listings (the number of homes listed for sale at any point during the period) fell 22% from 2020, and were down 40% from 2019.
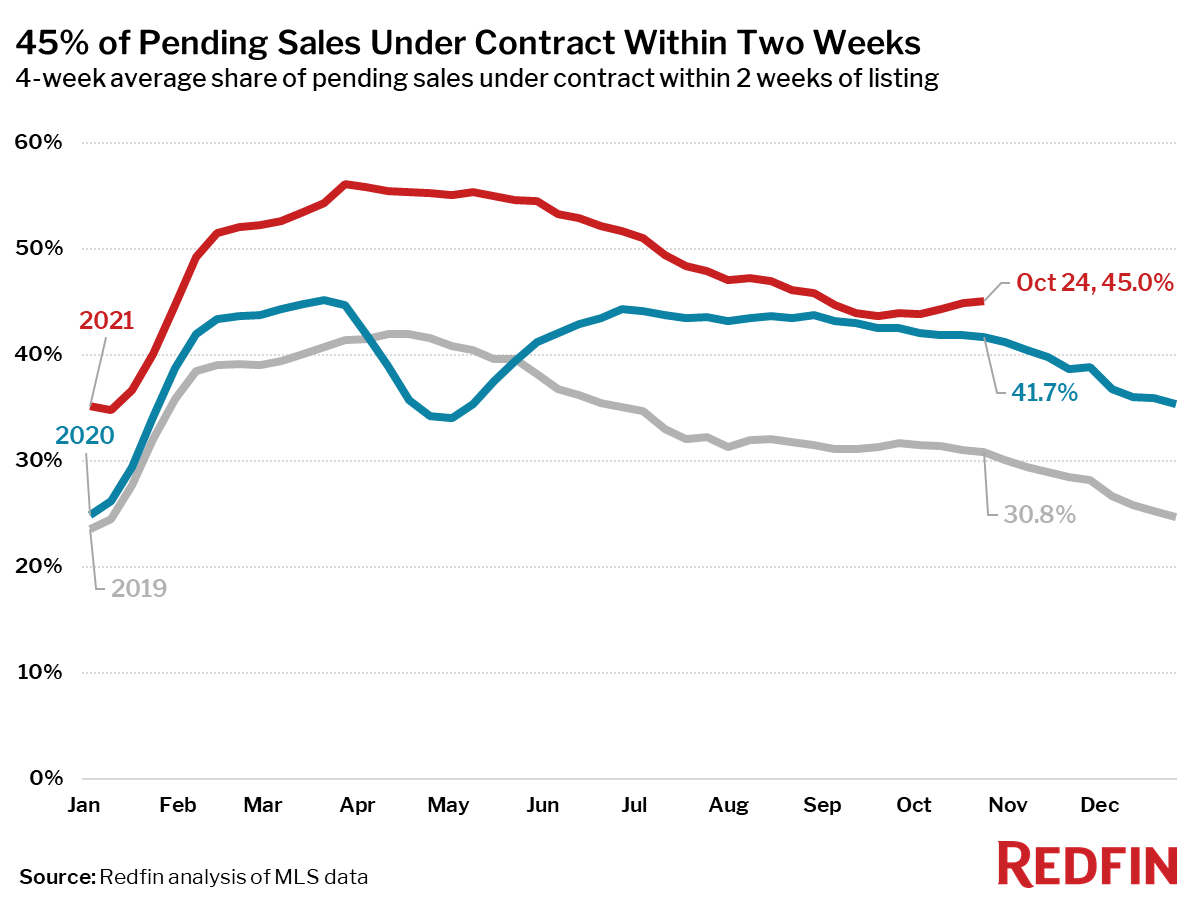
- 45% of homes that went under contract had an accepted offer within the first two weeks on the market, above the 42% rate of a year earlier and the 31% rate in 2019.
- 33% of homes that went under contract had an accepted offer within one week of hitting the market, up from 30% during the same period a year earlier and 20% in 2019. Since the four-week period ending September 12, the share of homes under contract within a week is up 2.3 percentage points. During the same time in 2019, the share fell 0.7 points.
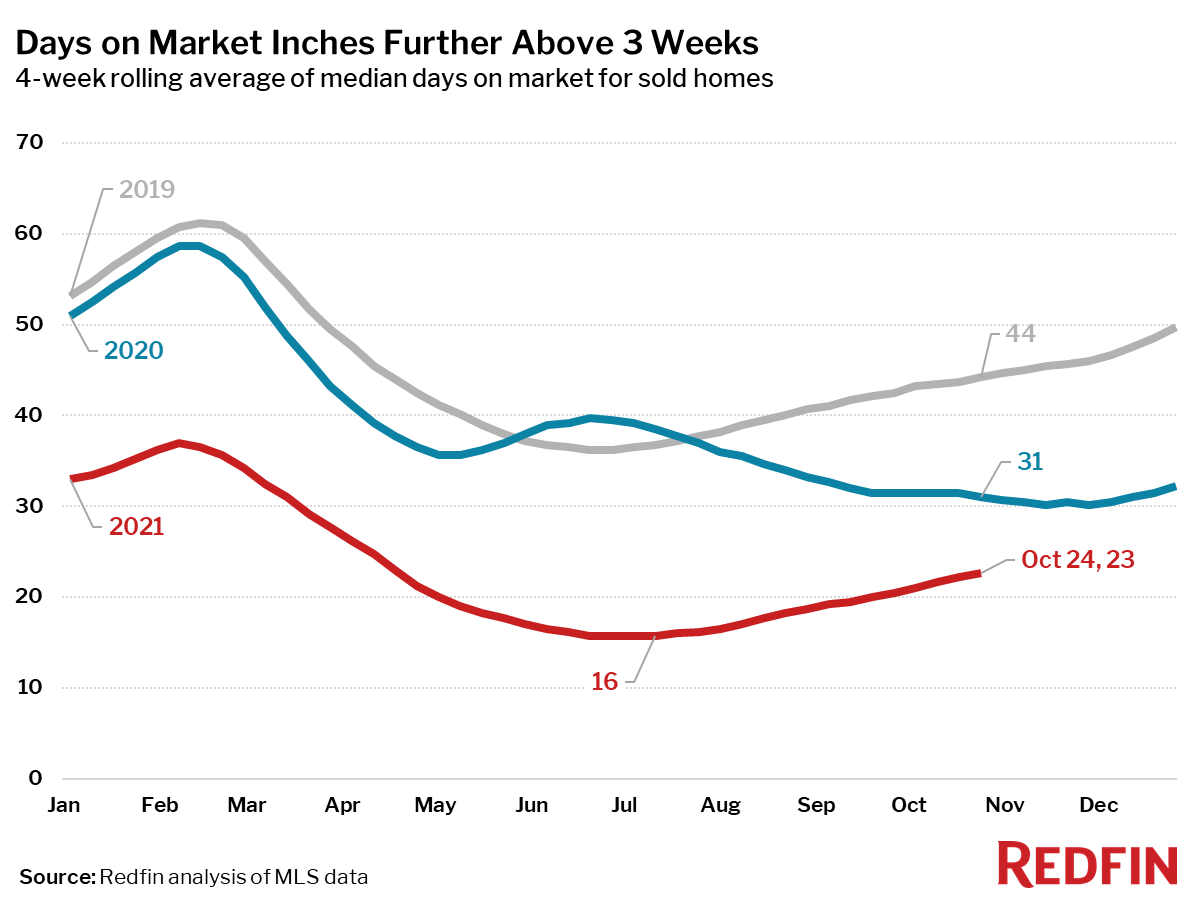
- Homes that sold were on the market for a median of 23 days, a full week longer than the all-time low of 15 days seen in late June and July, down from 31 days a year earlier and 44 days in 2019.
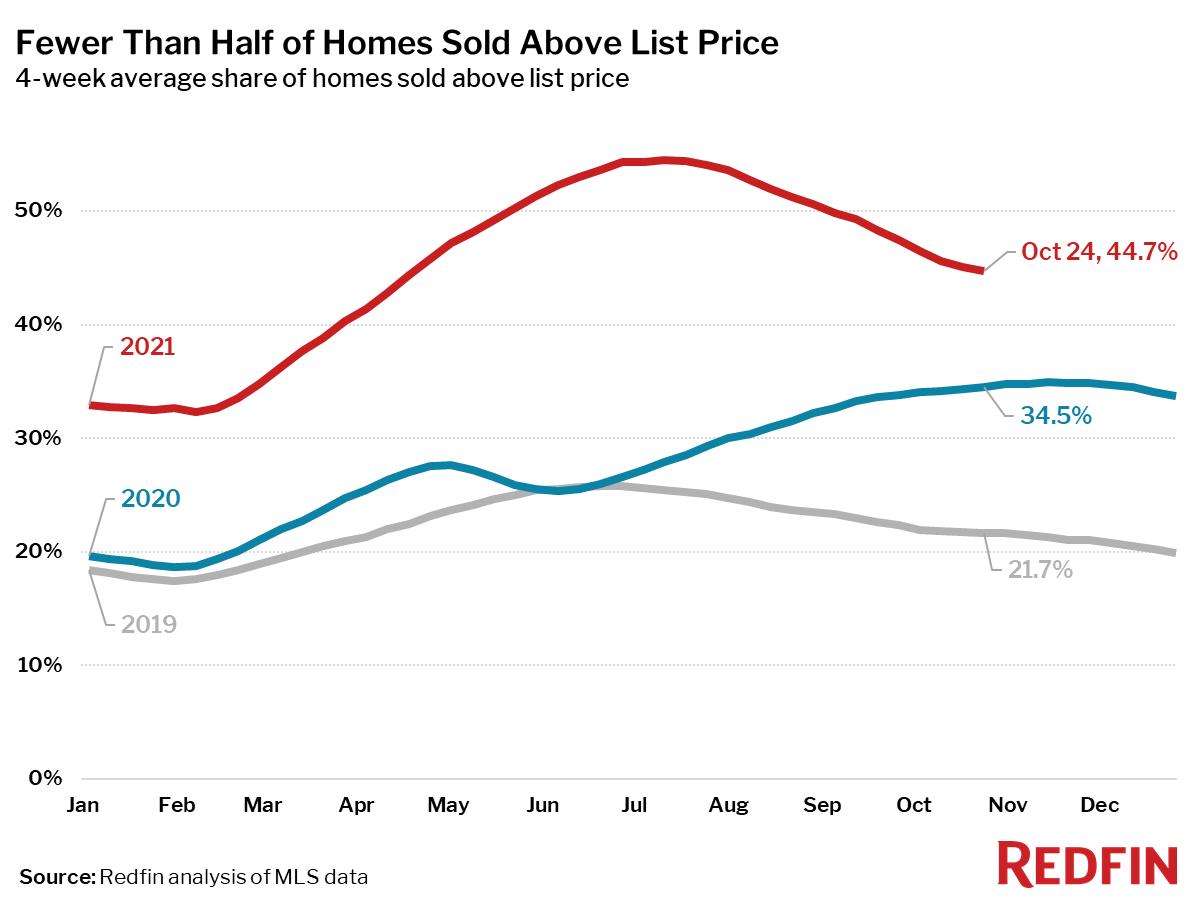
- 45% of homes sold above list price, up from 35% a year earlier and 22% in 2019, but the smallest share since April.
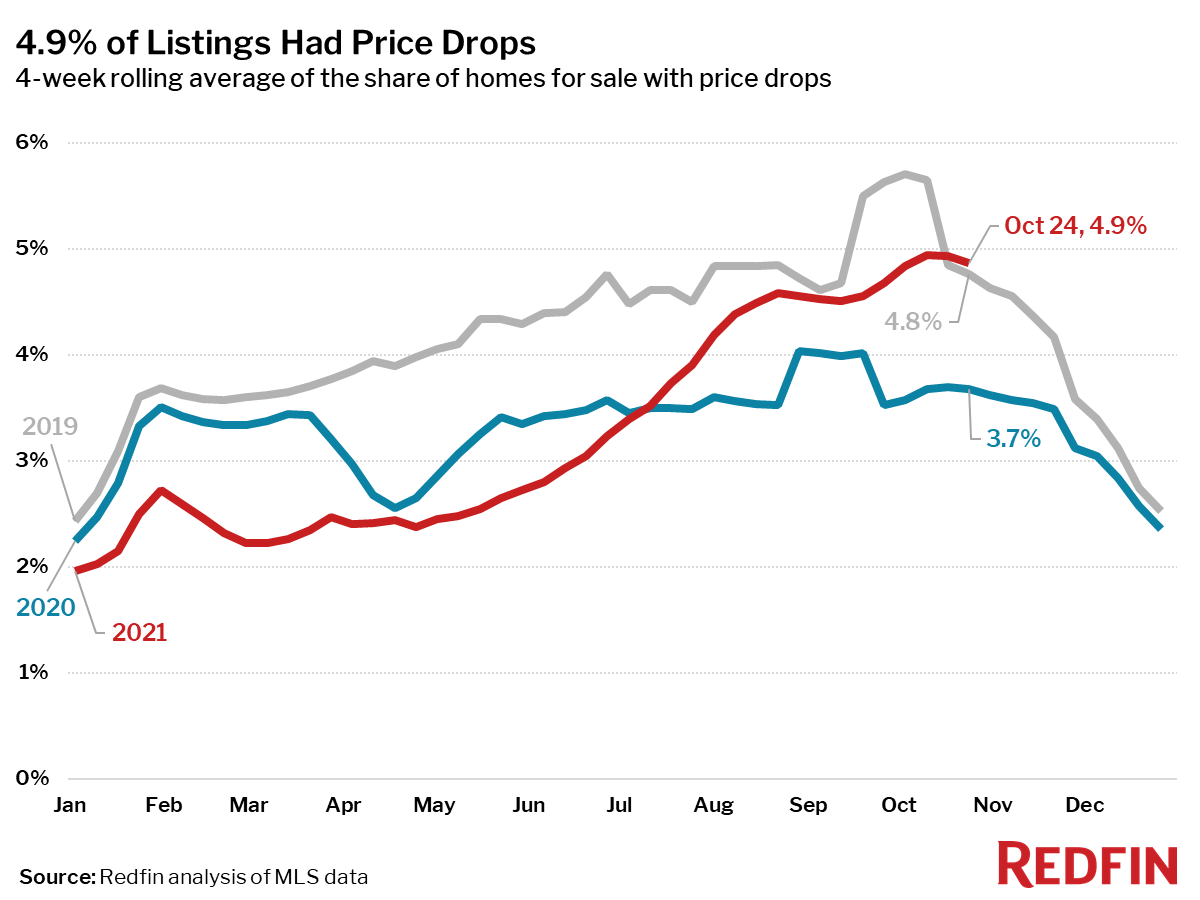
- On average, 4.9% of homes for sale each week had a price drop, up 1.2 percentage points from the same time in 2020, up 0.1 points from 2019.
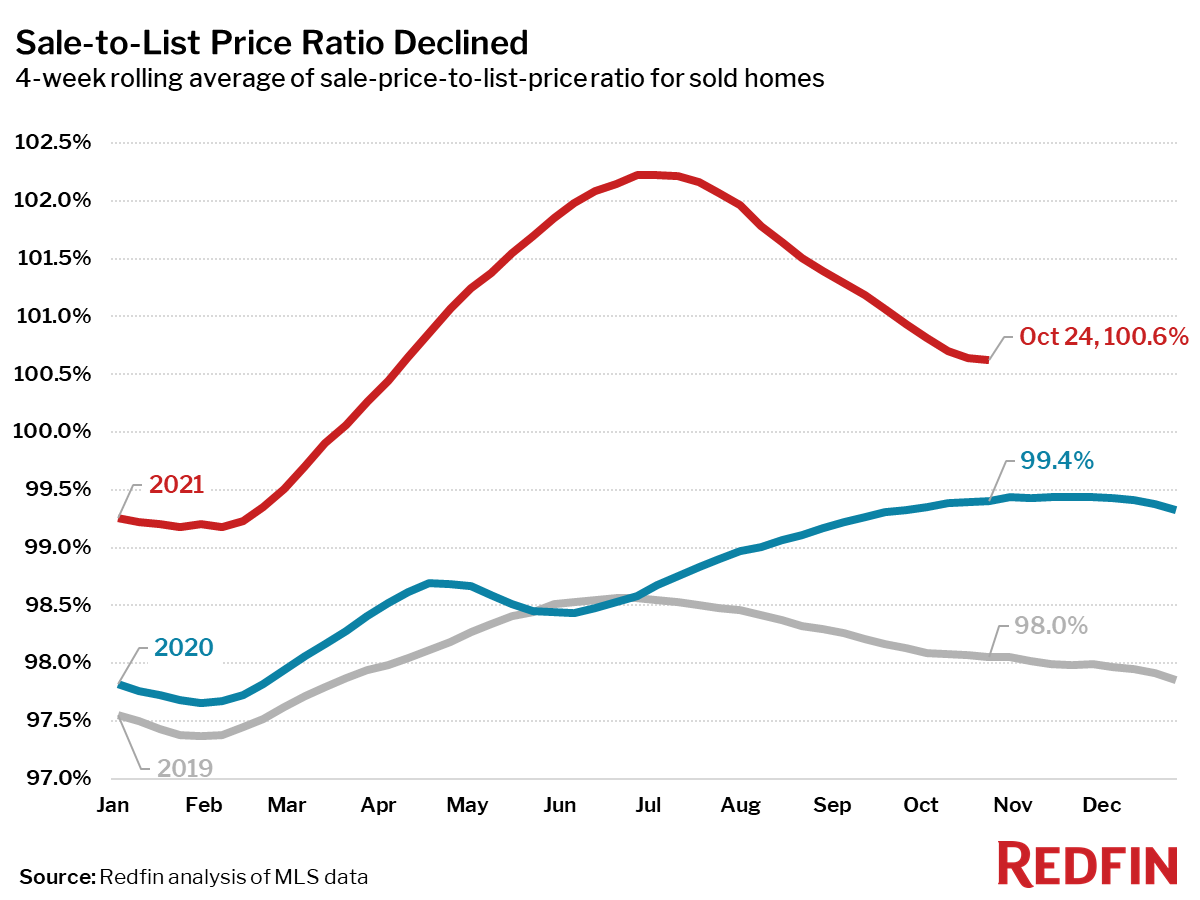
- The average sale-to-list price ratio, which measures how close homes are selling to their asking prices, was flat at 100.6%, the lowest level since April. In other words, the average home sold for 0.6% above its asking price.
Other leading indicators of homebuying activity:
- Mortgage purchase applications increased 4% week over week (seasonally adjusted) during the week ending October 22. For the week ending October 21, 30-year mortgage rates rose to 3.09%, the highest level since early April.
- From January 1 to October 24, home tours were up 7%, compared to a 20% increase over the same period last year, but higher than the 4% rate in 2019, according to home tour technology company ShowingTime.
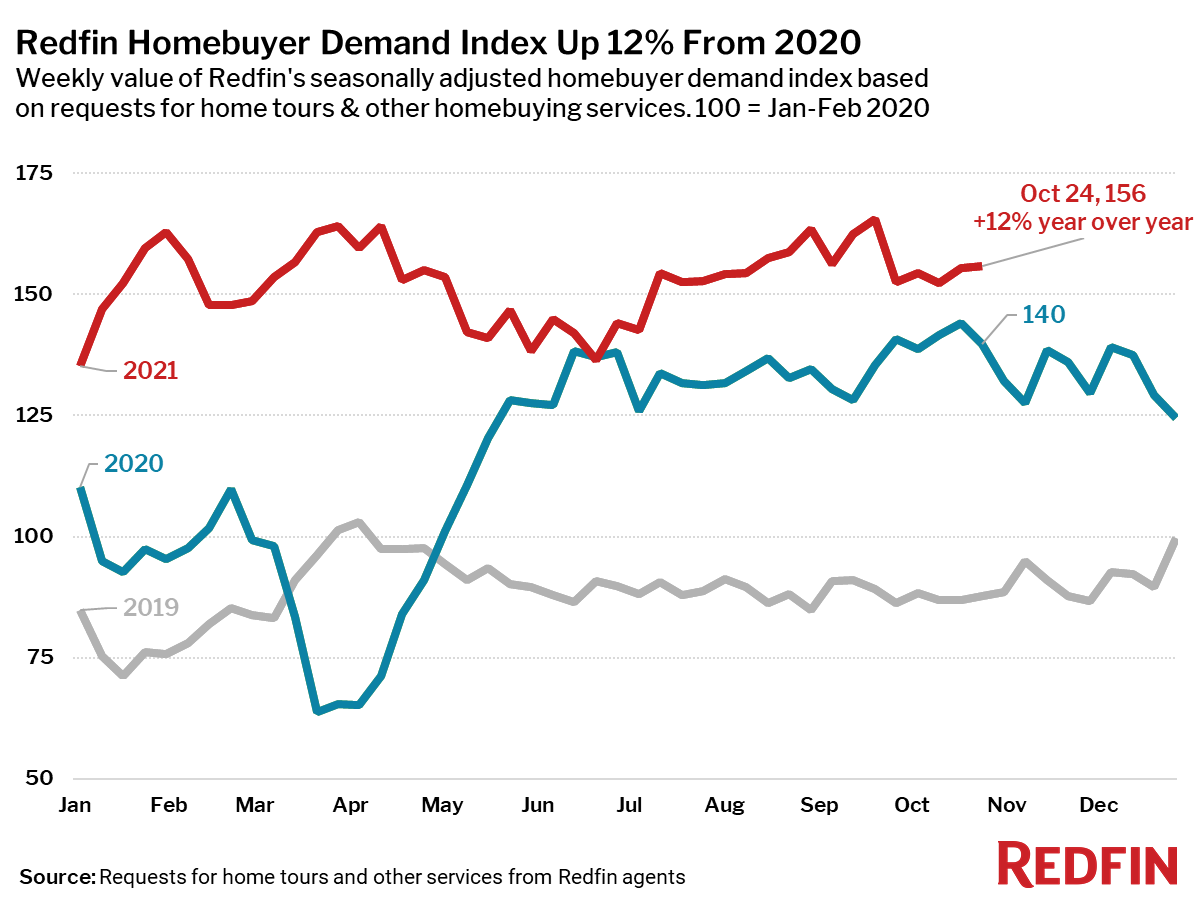
- The Redfin Homebuyer Demand Index rose 1.2 points during the week ending October 24, and was up 10% from a year earlier. The seasonally adjusted Redfin Homebuyer Demand Index is a measure of requests for home tours and other home-buying services from Redfin agents.
Refer to our metrics definition page for explanations of all the metrics used in this report.
 United States
 Canada