Mapping the US Energy Economy to Inform Transition Planning
Hundreds of US counties may experience substantial wage and employment changes due to a shift away from fossil fuels.
1. Introduction
Over the next several decades, the United States and the world will need to dramatically reduce greenhouse gas emissions to avoid the worst effects of climate change. This imperative implies an unprecedented transition in the energy system away from greenhouse-gas-emitting fuels (coal, oil, and natural gas) and toward clean energy sources, such as wind, solar, and nuclear, along with emerging technologies, such as large-scale energy storage and carbon capture, use, and storage. This transition will be challenging for a variety of technical, political, and socioeconomic reasons.
This report seeks to inform transition planning by identifying the regions of the United States that will experience substantial economic changes due to a shift away from fossil fuels. These communities will require considerable attention and funding from federal policymakers to support employment, economic development, public finances, and more as the production and consumption of fossil fuels decline (National Academies of Science, Engineering, and Medicine 2021).
Because local conditions vary widely, the mix of policy supports will vary from region to region. Although this brief is not intended to describe the scope of potential federal interventions, one key feature of any successful transition effort will be extensive engagement and collaboration between local stakeholders and federal agencies that can provide transition assistance (Look et al. 2021). To facilitate this collaboration, federal policymakers will need to identify the communities and regions that are likely to be most affected and understand the degree of potential impact, an effort recently begun by the federal Interagency Working Group on empowering workers in energy communities (Interagency Working Group on Coal and Power Plant Communities and Economic Revitalization 2021).

2. The Potential Timeline of Transition
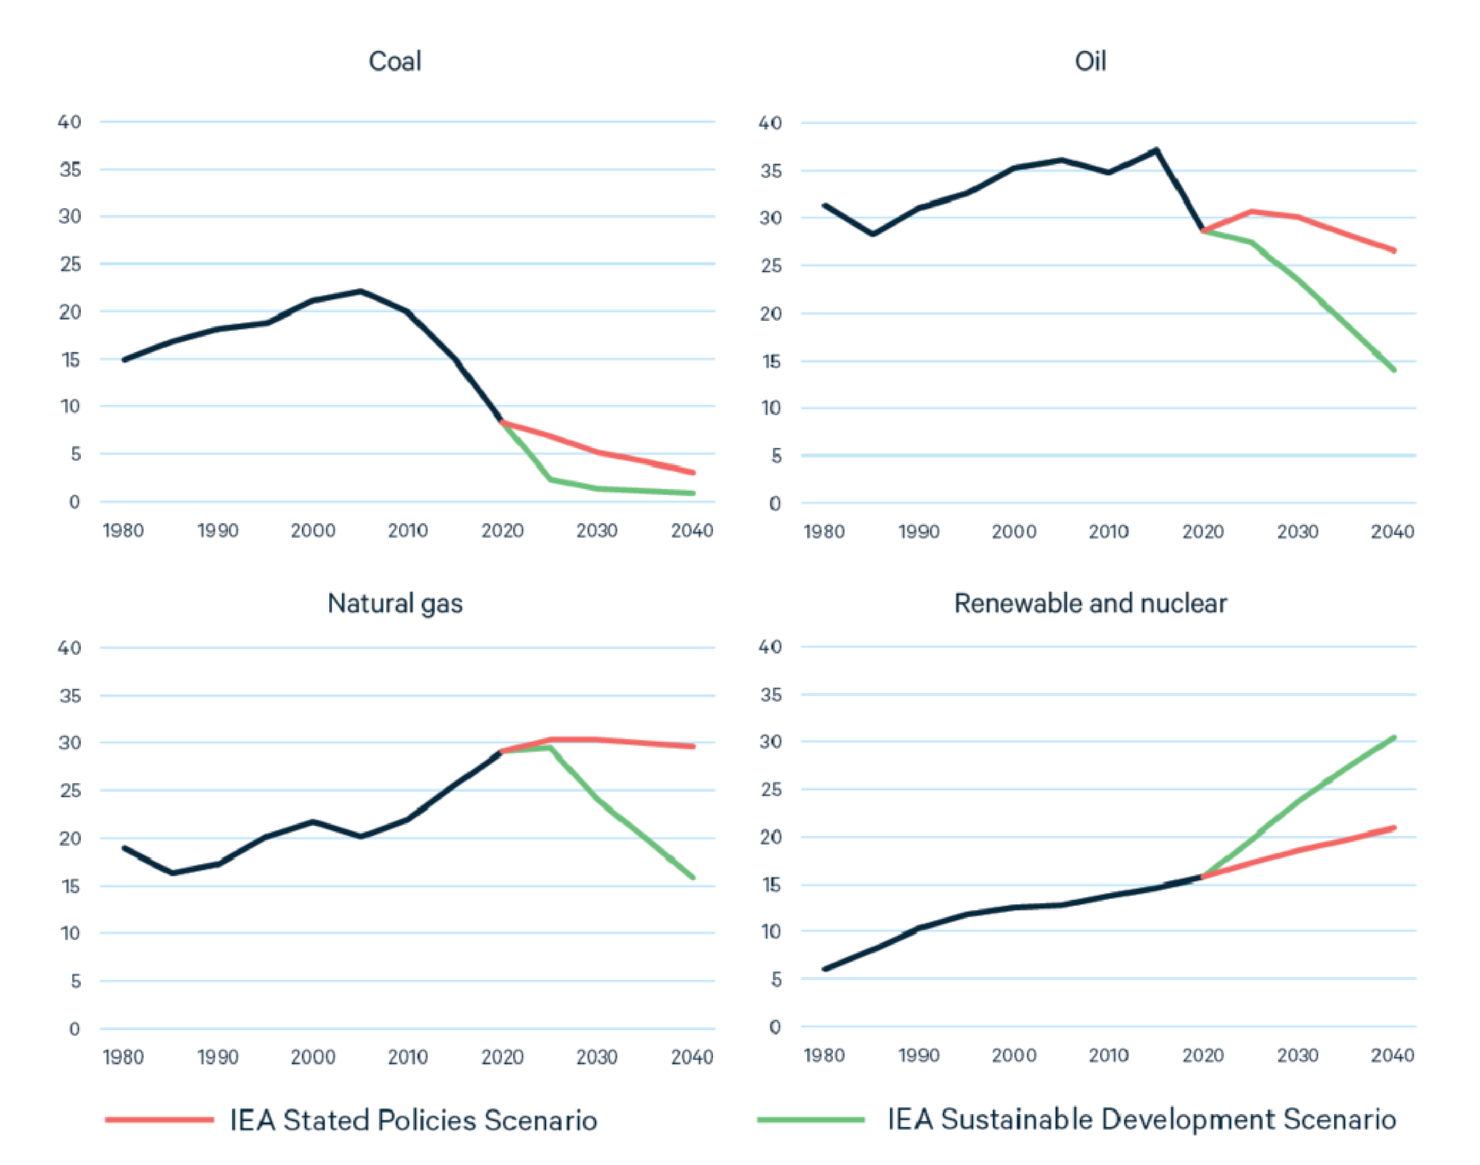
One approach to understanding the potential timeline of an energy transition is to examine scenarios from organizations such as the International Energy Agency (IEA). In the IEA’s Sustainable Development Scenario (SDS), which aligns with the long-term Paris Agreement targets of limiting global temperature rise to “well below 2ºC” by 2100, US coal consumption falls by 90 percent by 2040, and oil and natural gas consumption decline by almost half. Even under the IEA’s Stated Policies Scenario (STEPS), which assumes that no new major climate policies are announced, demand for these fuels declines or is steady through 2040 (Figure 1). Despite some potential for exports to facilitate higher production levels, it is unlikely that increased exports would fully make up for decreased domestic demand. In addition, global climate efforts would reduce demand for fossil fuels worldwide under this scenario, limiting the opportunity for exports.
Although each fossil fuel declines considerably under the SDS, the transition timeline varies widely across fuels. Because coal has the highest carbon content and can be substituted easily in the power sector (where most coal is used), these communities will be the first to face a transition due to climate policy. Indeed, coal employment has already declined dramatically over the last several decades due to increased automation and, since the mid-2000s, decreased demand driven by low-cost alternatives (Coglianese et al 2020). US coal employment has fallen from 170,000 in 1985 to less than 50,000 in 2020 (BLS 2020).
Oil and natural gas demand also decline substantially in the SDS. Oil demand falls 40 percent below 2020 levels by 2030—less than 10 years from today—and 51 percent by 2040. Natural gas consumption falls by 34 percent by 2030 and 45 percent by 2040. When we consider that these declines are from 2020, a year in which energy demand plummeted due to Covid-19, the implications for the US energy sector are brought into stark relief. Employment in the “upstream” US oil and gas sector fell from roughly 470,000 at the start of 2020 to less than 400,000 by year’s end, This includes employment in oil and gas extraction (North American Industry Classification System [NAICS] code 2111) and support activities for mining (NAICS 2131), which mostly consists of services provided to oil and gas companies. and employment will contract further under an ambitious climate scenario such as the SDS. Looking forward, declining production nationally will have different regional effects, with low-cost producers experiencing less short-term disruption than higher-cost regions.
Figure 1. US Energy Demand by Type (quadrillion British thermal units)
3. Mapping the US Energy Economy
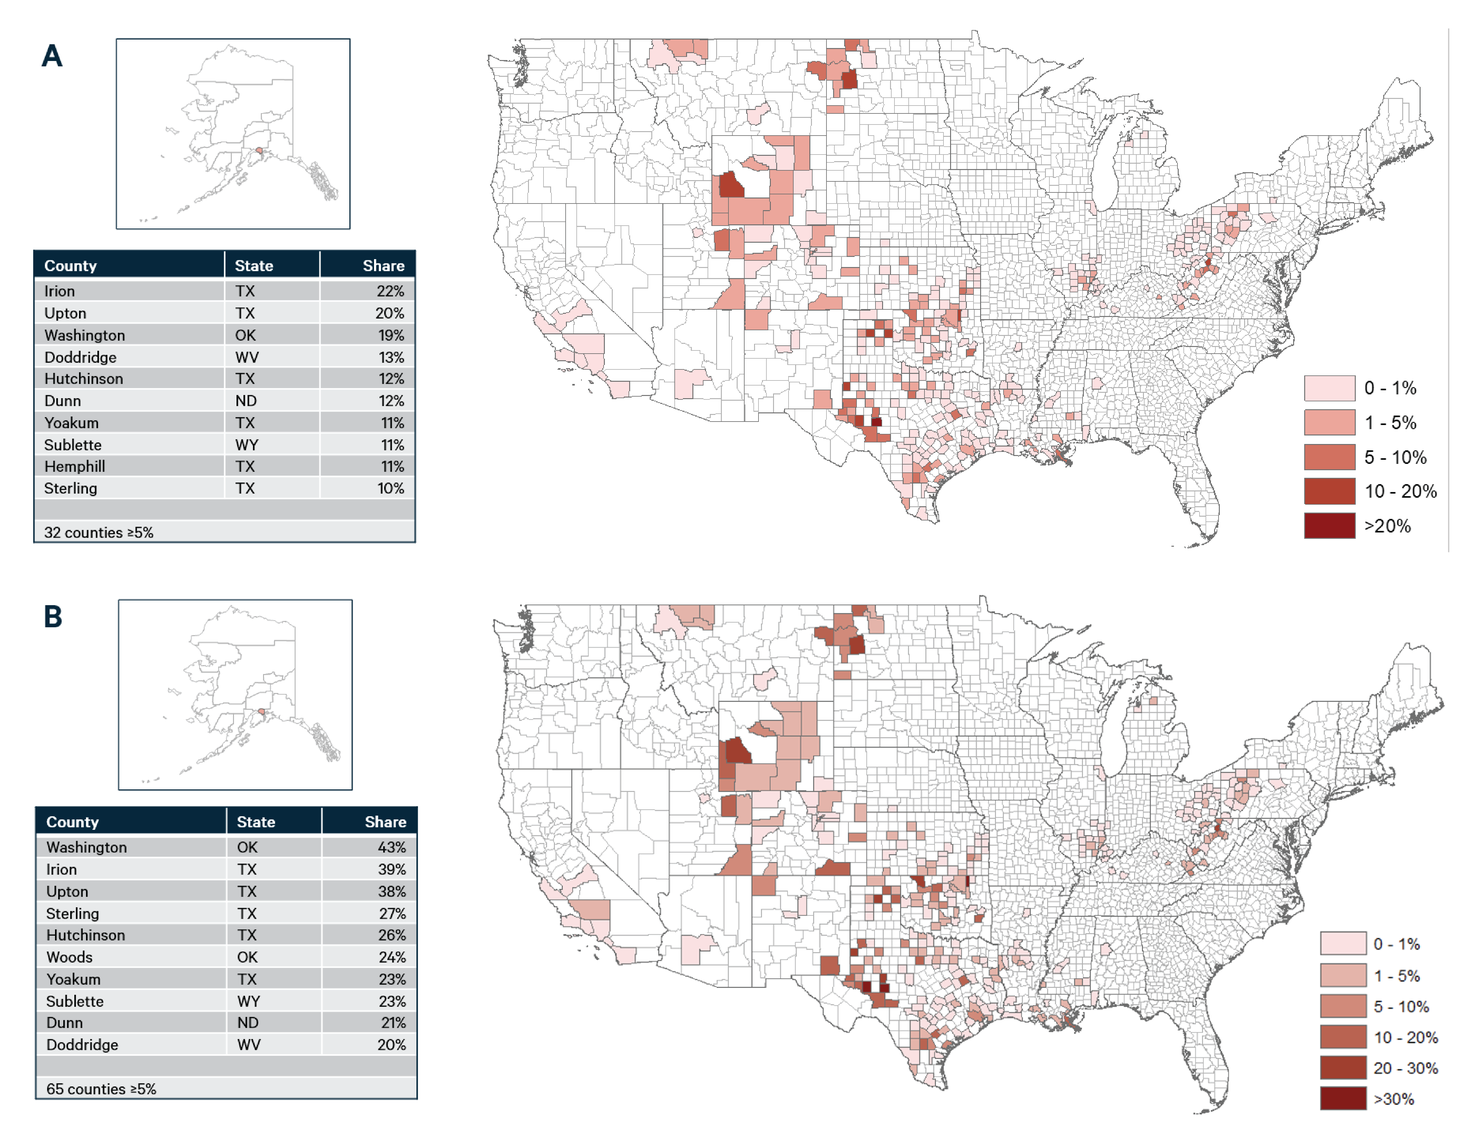
In some counties, fossil energy production is by far the leading employer and earnings generator. For example, more than 22 percent of all jobs in Irion County, Texas come from the oil and gas sector, and 21 percent is from support activities for mining (which mostly consists of oilfield service companies). Because some of these positions pay better than the average job, oil and gas extraction provides 39 percent of all wages in the county, and support activities are 25 percent. Several other counties in Texas, Oklahoma, North Dakota, Wyoming, and Alaska show a similarly heavy dependence on the oil and gas sector. Aggregating jobs and wages across all energy sectors reveals a considerable number where fossil energy dominates the local economy. In 50 counties, 25 percent or more of all wages come from these four sectors, and 16 counties have 25 percent or more of total jobs coming from fossil energy.
To understand the scale of this economic contribution, consider the University of Michigan—Ann Arbor, which is the dominant local employer in Washtenaw County, Michigan. Its contraction or closure would cause dramatic economic effects for all residents of the county and beyond. The university and its associated hospital system employ roughly 50,000 people (University of Michigan Office of Budget and Planning 2021), or 14 percent of the county population.
Along with the counties where fossil energy is the dominant employer, dozens more have high concentrations of jobs and wages in coal, oil, and natural gas. Table 1 demonstrates this dynamic, showing the number of counties where 5 percent or more of total jobs or wages come primarily from fossil energy during 2016–2019. It illustrates that although the shift away from coal has affected a substantial number of counties, the number that would be affected by declining oil and gas production is considerably higher. Power sector jobs, which include nonfossil energy sources, such as hydropower, nuclear, wind, and solar, also play a large role in the economies of dozens of counties.
Table 1. Number of Counties with 5 Percent or More of Jobs or Wages from Energy, 2016–2019

Importantly, the figures shown in Table 1 and the maps systematically underestimate the true number, as the Bureau of Labor Statistics (BLS) omits data for certain counties for confidentiality purposes. In addition, these figures do not include midstream or downstream sectors, such jobs or wages working on pipelines, at refineries, or at fuel retailers (i.e., gasoline stations).
3.1 Coal Communities
Coal communities have faced major challenges in recent years. In parts of Appalachia, coal-related employment has declined for decades due to increased automation and reduced demand. In the Powder River Basin, the largest source of US coal, production began declining in 2008 and has fallen more sharply in recent years.
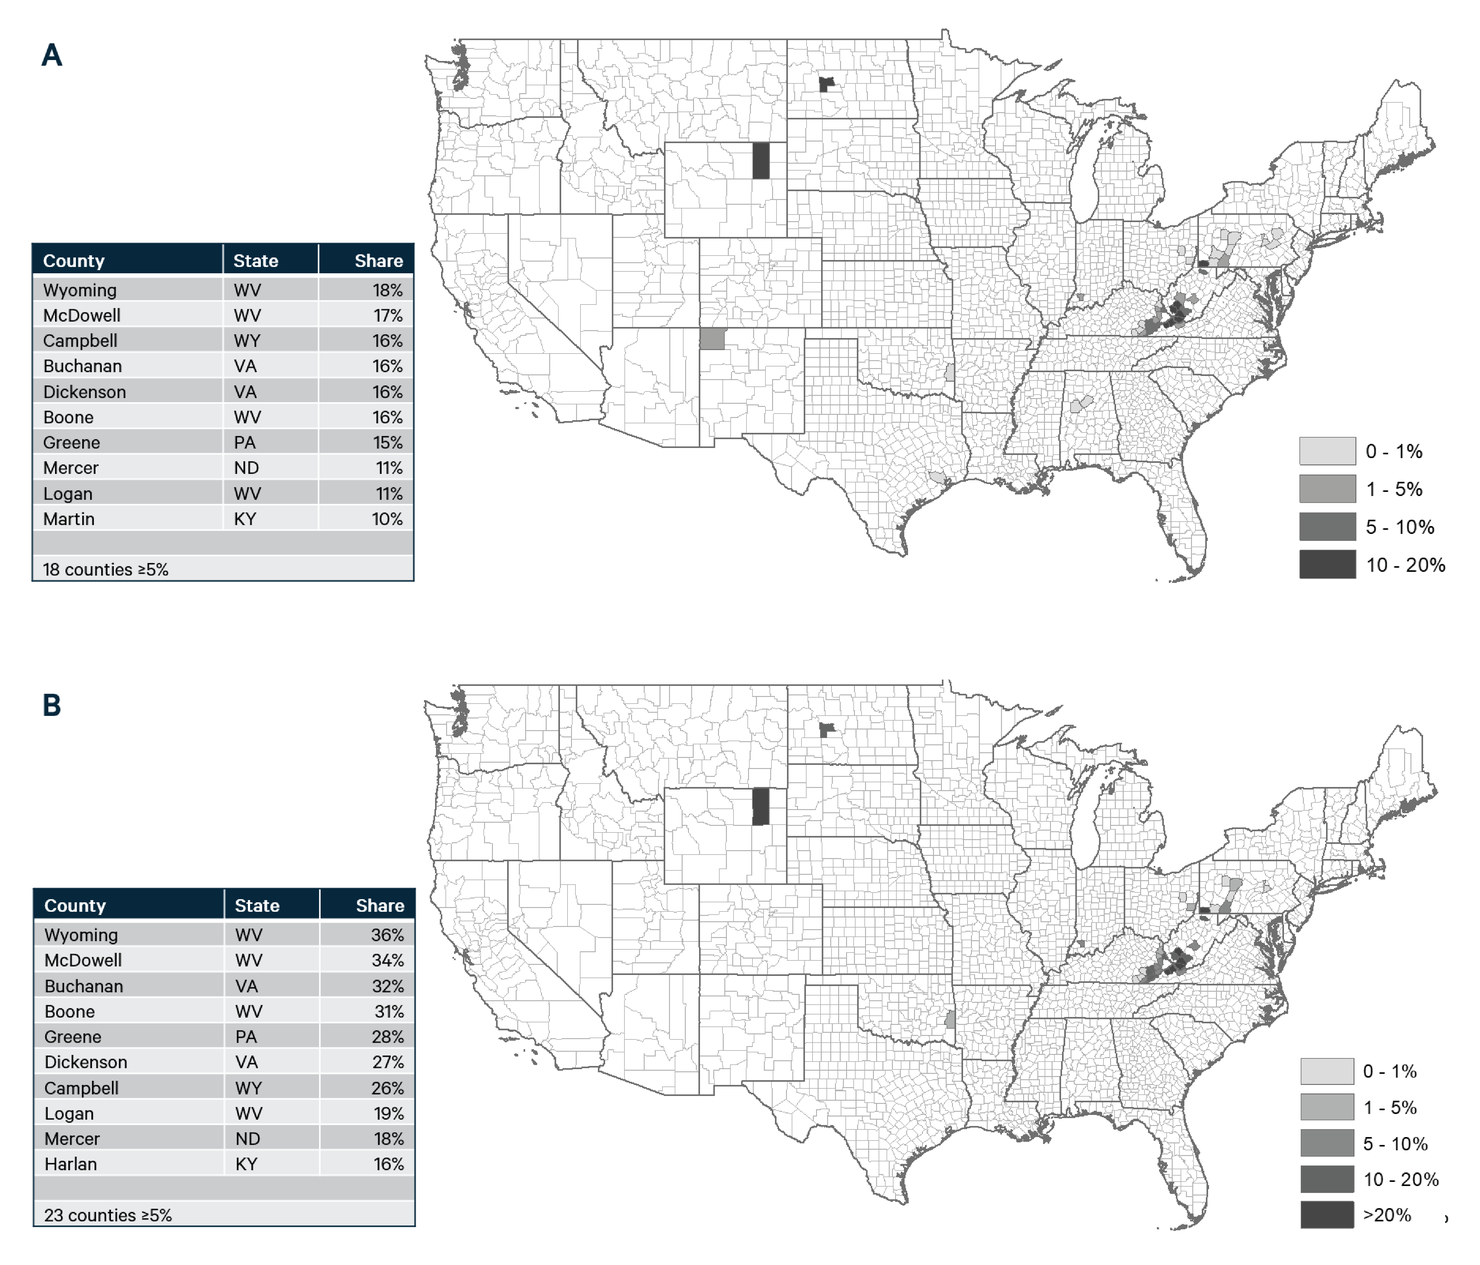
Figure 2 illustrates the percentage share of employment (A) and wages (B) that come from coal mining at the county level. It accounts for 15 percent or more of county-level employment in seven counties and 5 percent or more in 18 counties. Because coal mining jobs offer higher pay than regional averages, their wages account for 20 percent or more of total wages in seven counties and 5 percent or more in 23 counties. As noted, the figure underestimates the true count because BLS suppresses some data for confidentiality purposes.
Figure 2. Coal (A) Job and (B) Wages Shares by County
3.2. Oil and Gas Communities
Due to a suite of innovations often referred to as the “shale revolution” (Raimi 2017), domestic oil and natural gas production has grown at unprecedented scale, making the United States the world’s largest producer of both commodities in recent years. However, this growth has been accompanied by volatility, creating challenges for local businesses, governments, workers, and others (Raimi et al 2019). As the energy system shifts toward a low-carbon future, the long history of “booms and busts” in the oil and gas sector (McNally 2017) may be replaced by a longer-term decline, raising distinct challenges.
Like coal mining, oil and gas extraction is concentrated in regions with economically recoverable resources, leading the sector to play an outsized role in some local economies. Figure 3A illustrates how the sector is important to dozens of local economies, providing 5 percent or more of county-level employment in 32 counties, concentrated in parts of Texas, Oklahoma, Wyoming, North Dakota, and several other states. Figure 3B shows that residents of 65 counties receive more than 5 percent of all wages from oil and gas extraction.
Figure 3. Oil and Gas Extraction (A) Job and (B) Wages Shares by County
As noted, BLS classifies many workers in the oil and gas sector in the “support activities for mining” category. In practice, most of these employees provide specialized services for the oil and gas industry, though some offer services for other mining, including coal, hard rock, or metals. As Figure 4 demonstrates, this classification encompasses many more employees and earnings than “coal mining” or “oil and gas extraction.” One hundred and twenty-two counties rely on this sector to employ more than 5 percent of their workforce, and it is more than 25 percent of the workforce in eight counties. More than 5 percent of total wages are from “support activities for mining” in 165 counties, with concentrations above 30 percent in more than a dozen.
Figure 4. Support Activities for Mining (A) Job and (B) Wages Shares by County

3.3. Power Sector
Electricity generates employment and wages across the United States and is much less geographically concentrated than coal, oil, or gas extraction. In 2020, roughly 60 percent of net electricity generation in the US came from natural gas (40 percent), coal (19 percent), and petroleum products (0.4 percent). Although BLS data do provide fuel-specific data, the following estimates are helpful to understand a rough order of magnitude of how a shift away from fossil-fired electricity may affect employment and wages.
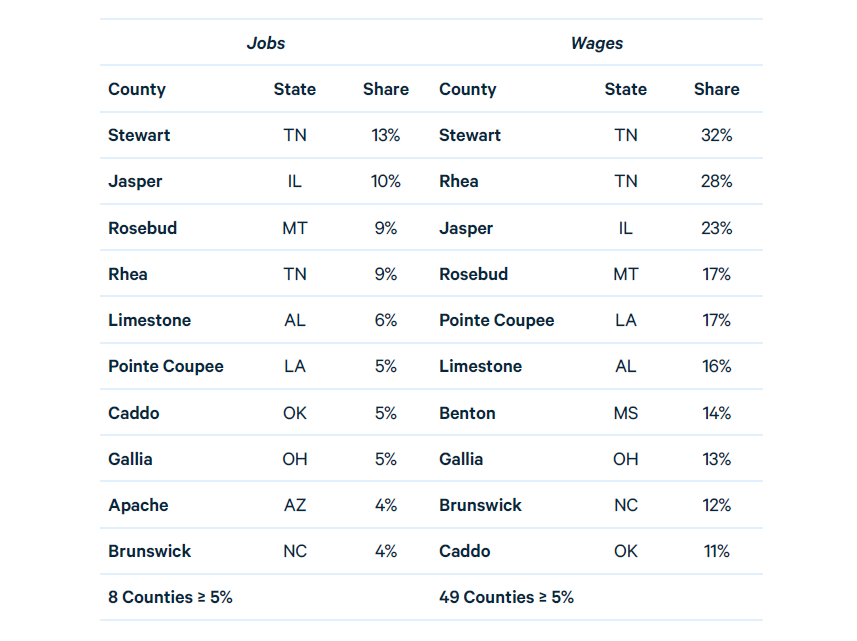
Electricity generation is capital intensive, and power sector employment is 5 percent or more in just eight counties. However, because power sector wages are well above the national average, this industry provides 5 percent or more of wages in 49 counties, with several counties relying on it for more than 20 percent of wages.
Unfortunately, county-level maps could not be completed at the time of publication. Table 2 presents the 10 counties with the highest shares of power sector employment and wages from 2016 through 2019.
Table 2. Power Sector Job and Wage Shares for Top-10 Counties


